San Francisco Bay Area · Port of Oakland, national labs and Silicon Valley tool rooms

Asset tracking in the Bay Area, for labs, tool rooms and the Oakland waterfront

Spatial Map shows where tagged equipment, tooling and other assets are on a live 3D map of each building, using the reads and positions your RFID and BLE systems already produce. Asset tracking in the Bay Area is mostly about expensive things that move between rooms: instruments shared by several teams, tooling moved between a store and a line, and containers and chassis at the Port of Oakland. Each site is its own facility, and all of them can sit in one workspace.

No credit card. Runs in the browser. Pro is $60/month for up to 4 facilities. Book a demo

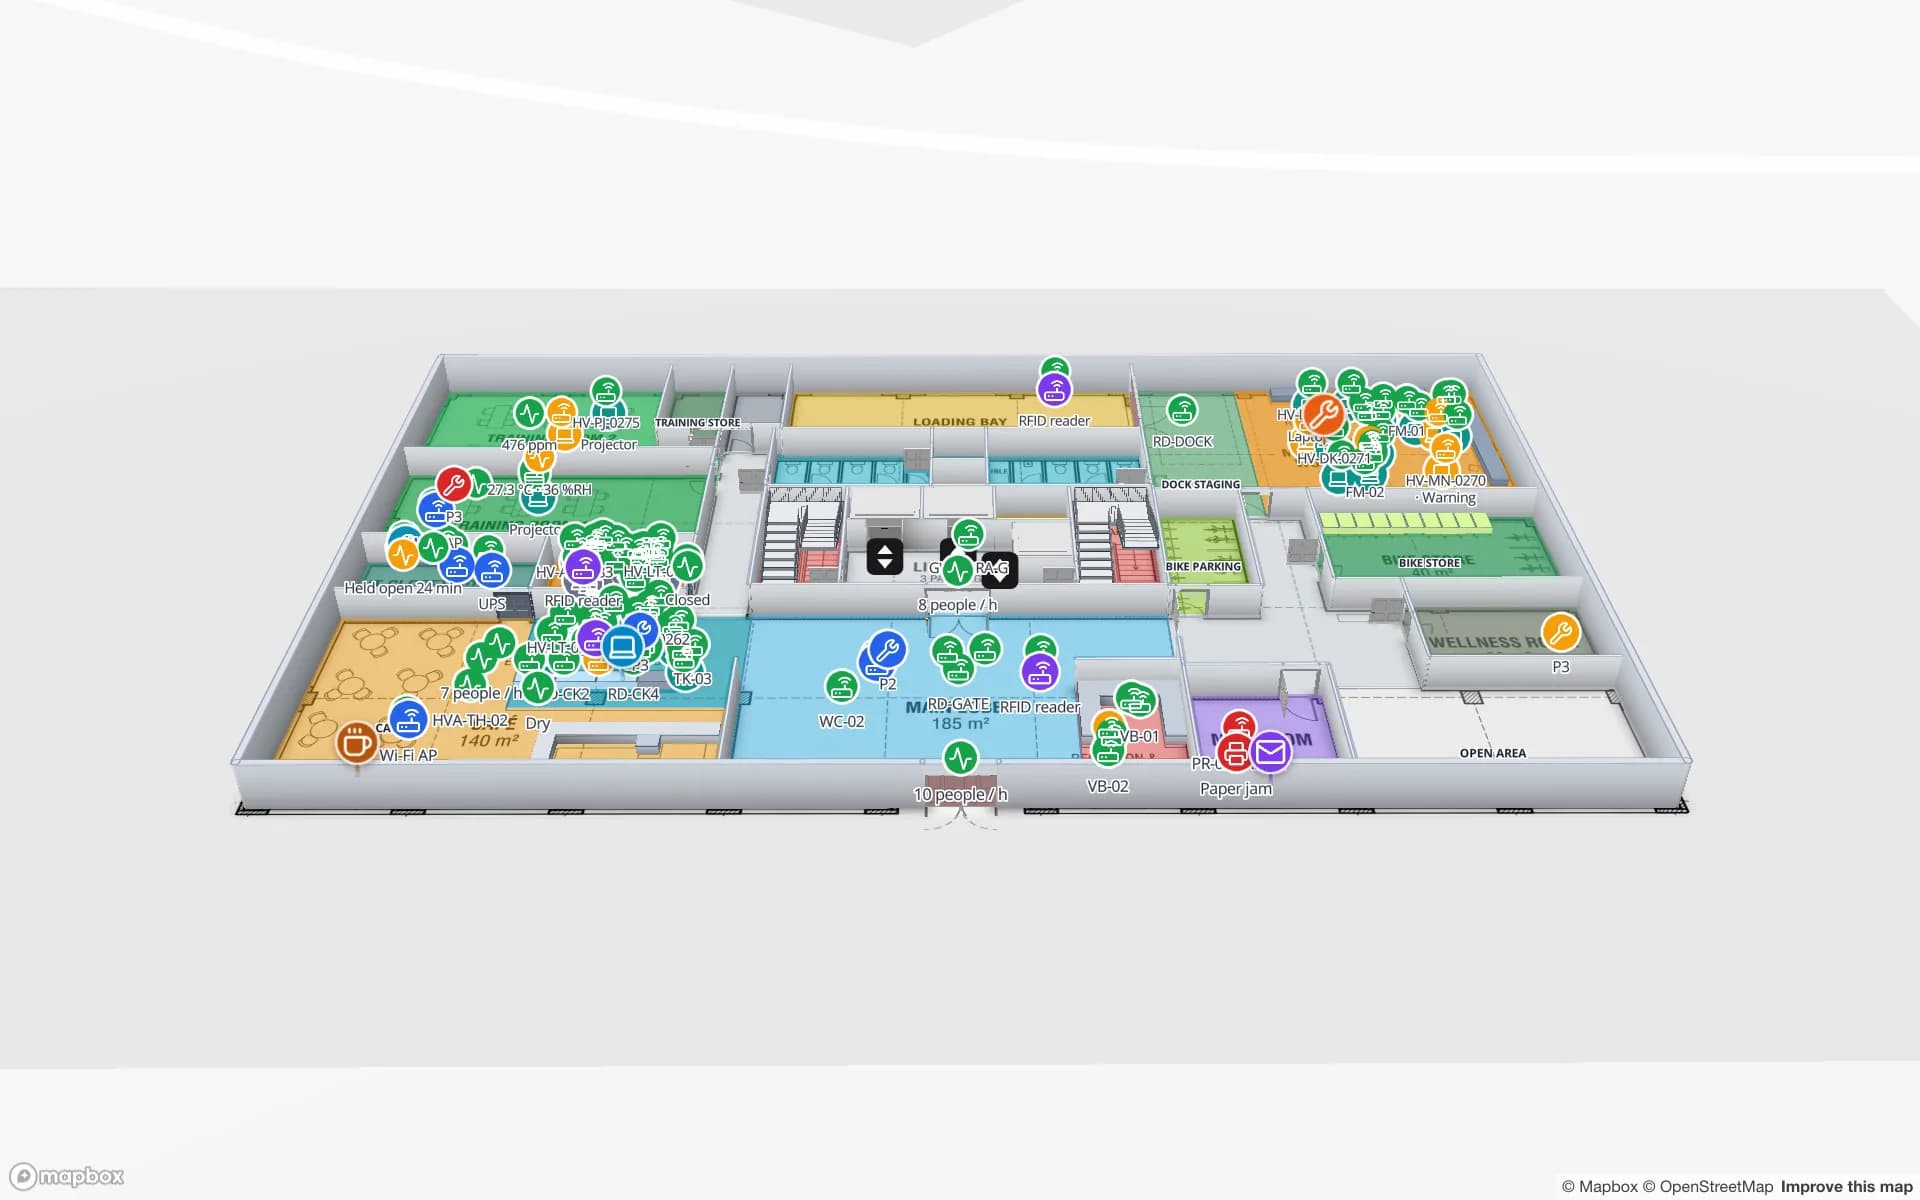
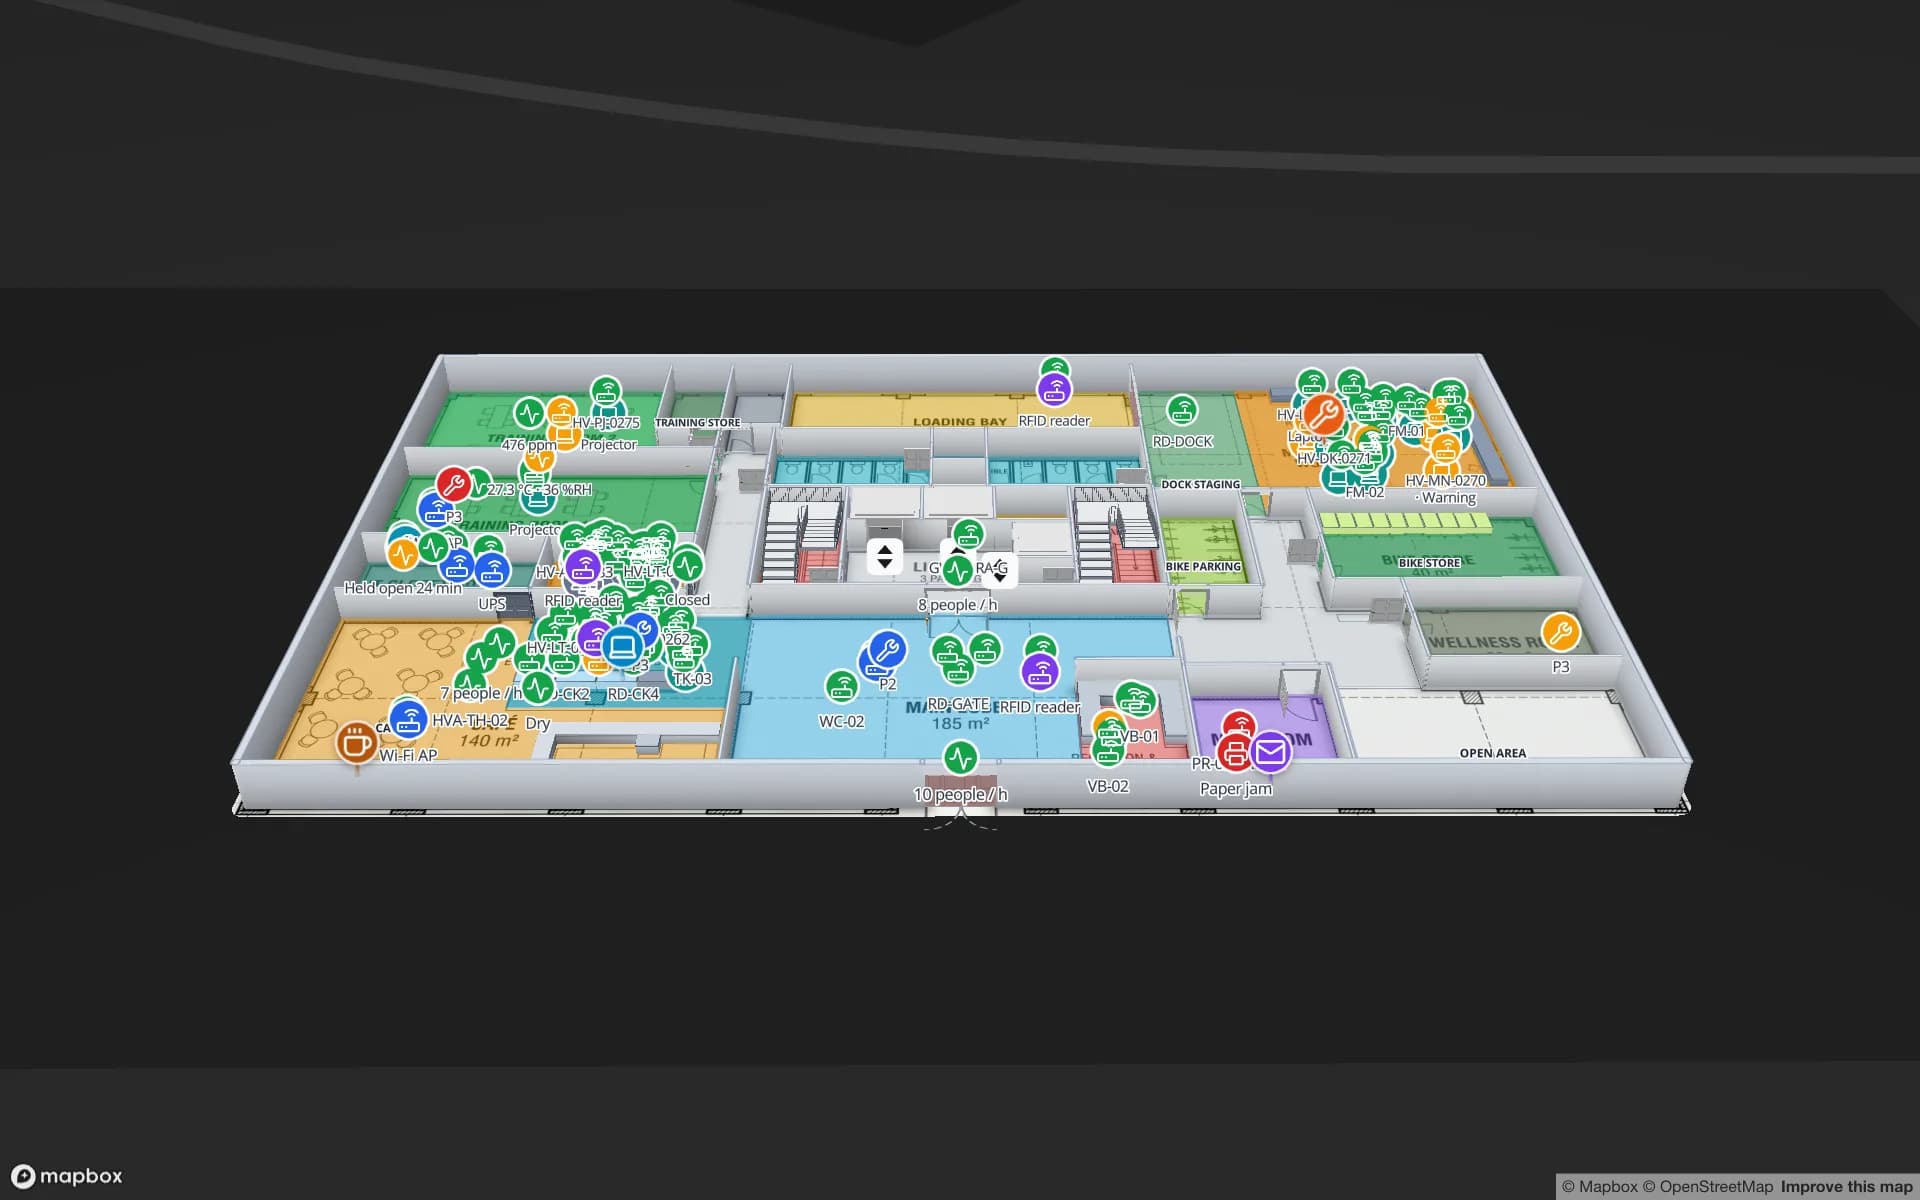
Harborview Corporate Campus — Building A, a corporate office building demo, in the Spatial Map 3D viewer with live device markers
Harborview Corporate Campus — Building A
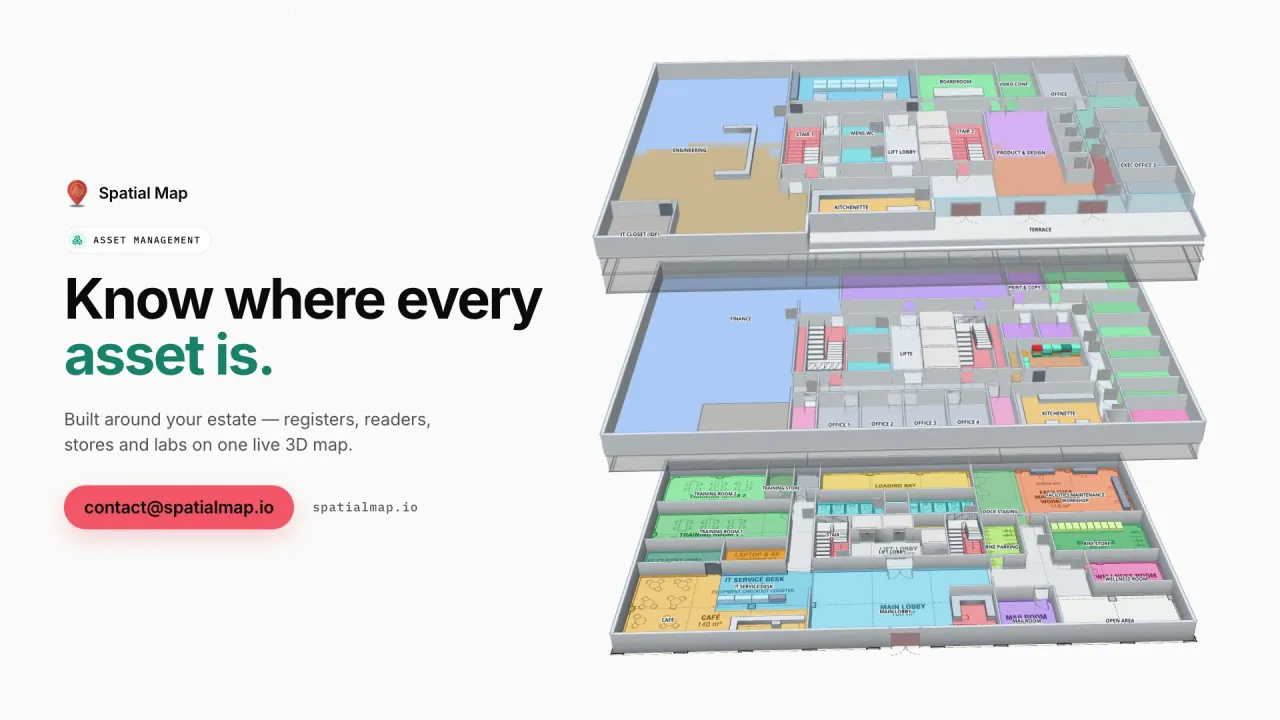
Harborview Corporate Campus, a demo office building: the asset register, equipment check-out, stores and spares, work orders and meeting rooms on three floors.
Floors in the Harborview asset-register demo
3
Tables in the Harborview demo, from the asset register to work orders
22
Rack locations in the Summit assembly-plant demo
867
Free trial, up to 5 facilities, no card
7 days

The Port of Oakland: a waterfront of boxes, rail and one airport

The Port of Oakland was established in 1927 as an independent department of the City of Oakland and oversees the seaport, the airport and nearly 20 miles of waterfront including Jack London Square. The seaport covers approximately 1,300 acres, about 780 of them marine terminals, with two intermodal rail facilities and 18 deep-water berths. In calendar 2023 approximately 2.07 million TEUs moved through it, about 92 percent of that international, and the port calls itself the principal ocean gateway for international containerized cargo to and from Northern California.

Buildings behind a gateway like that handle boxes and the things that move them: chassis, pallet jacks, forklifts, reusable cargo straps and tools. Tag the equipment, draw each warehouse door and yard zone as an area, and the map shows what is where and what has been out of its zone too long. The Eastport demo shows a cross-dock with gate lanes, yard slots and yard tractors, and real-time indoor asset tracking explains the options. Spatial Map does not connect to the port, shipping lines or terminal systems.


Laboratory equipment is the shared-asset problem

Lawrence Berkeley National Laboratory was founded in 1931, is operated by the University of California under contract with the U.S. Department of Energy and runs five scientific user facilities. Whatever the lab, the pattern around it is common across the Bay Area: instruments, sample carriers, vacuum parts and test fixtures used by several teams, booked by calendar, moved between rooms and serviced by someone else.

A register of those items with room, owner, booking state and calibration or service dates, drawn on the building plan, answers the daily question “which room is it in now?”. Tag handhelds read a room when you walk it, a reader at the store door catches what leaves, and BLE tags with gateways named after rooms give a last-seen room without a walk. Tag materials and mounting are worth testing on your own metal and plastic instruments first; RFID tags for metal, liquids and apparel lists what to check. The Harborview demo shows an asset register, equipment check-out and stores on three floors.

Silicon Valley’s toolrooms: tooling that follows the line

The name “Silicon Valley” was popularised by an article in the trade weekly Electronic News on 11 January 1971 about the semiconductor industry in the Santa Clara Valley. Half a century later the companies that build and service production equipment still keep consumable tooling, spares and test equipment in stores, benches and carts, and an idle hour on a tool costs far more than the tool.

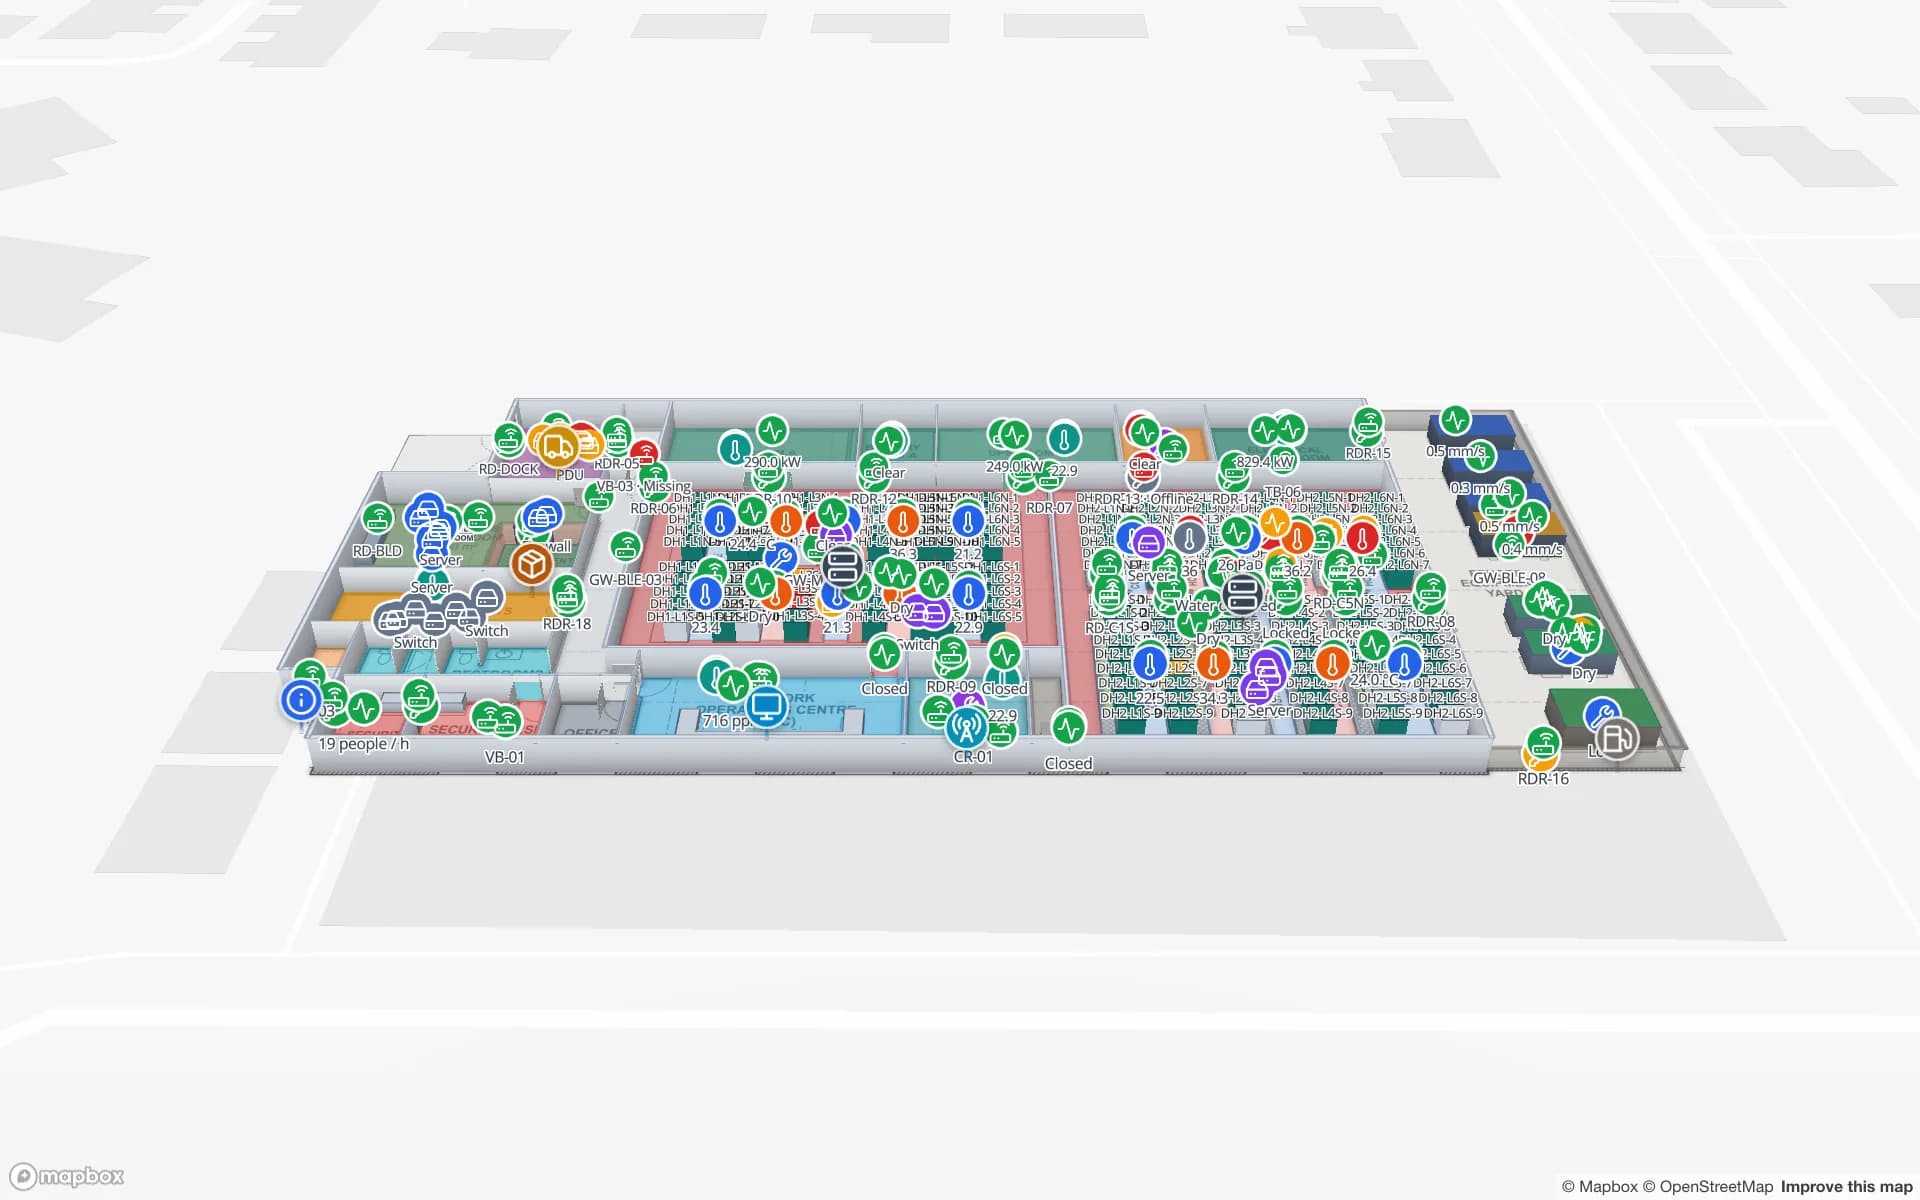
For that kind of building the useful map is the one with each store, bay and line as an area and each tagged item with its home, its current area and its status. A style rule colours items that are overdue for return; the History player replays where a fixture has been. Spatial Map does not model cleanroom rules, contamination or equipment control; it shows location and status from your tags and records. The Summit demo shows lines, workstations, tools and crews located on the shop floor, and RFID tool tracking covers the crib pattern.

Getting a Bay Area building onto the map

Offices, labs and plants here are often leased and re-fitted, so the drawing set may not match the floor. Upload what you have as a PDF, DWG (AutoCAD R2004–R2018, placed as a picture) or image, align it at real scale and let AI Map draft walls, doors and areas for a person to review. Or trace the plan yourself in the editor; how to trace a floor plan walks through it.

Then connect the register: a CSV or Excel export of your asset list is enough to start, and your own tools can post rows through the table write API (HTTPS, bearer API key, bulk upsert, 60 requests per minute per key). Asset-tracking teams here often have developers in-house, so the API is usually how it stays up to date.

Services for teams in the Bay Area

Bay Area teams usually start with the asset list and the building:

  • Labs, research buildings and offices start with asset tracking for shared instruments and IT equipment, often before buying any tag.
  • Plants and equipment suppliers add RFID tool tracking and inventory tracking for spares and consumables.
  • Port-side warehouses and yards add dock-door reads and yard slots; see RFID warehouse management.
  • RTLS and UWB is for the few floors where people or carts must be located continuously; a BlueIOT server connects directly and other engines through the write API.
  • If you have no tags, gateways or readers yet, our team can source RFID, BLE and UWB devices on request, quoted per project, with warranty and device support from the manufacturer: see hardware and demo kits on request.
  • Asset back offices, handheld apps and integrations are built as client projects, for example an asset management system. The product runs as cloud or on-premises.

Also served nearby

The same approach covers Berkeley, Alameda, San Leandro, Hayward and Fremont on the east side of the bay, San Francisco and the peninsula, and the Santa Clara Valley towns around San Jose. Nothing needs to be installed on site: the map opens in a browser.

How Spatial Map does it

From an asset list to a live Bay Area map

  1. 01

    Start with the register

    Export the asset list with room, owner and status; that table is the map’s first data layer.

  2. 02

    Draw the building

    Align the plan, let AI Map draft it, then name rooms and stores the way the register does.

  3. 03

    Read the tags

    RFID reads at doors and store gates, or BLE gateways named after rooms, post last-seen areas through the write API or a polled endpoint.

  4. 04

    Add return rules

    In-app alerts for items out of their area too long and readers that stopped reporting.

What Bay Area teams track

Shared lab and IT equipment

An asset register by room with check-out and a History player.

Tooling and fixtures

Tools and carts with their home store, current line and status.

Yard and dock equipment

Yard tractors, trailers and pallets by yard slot and dock door.

Server rooms and spares

Cabinets, IT assets and spares tied to the cabinet they belong to.

See it on real demo facilities

Fictional names, real floor plans, live sensors, RFID, BLE tags and gateways — open any of them in the browser.

All 13 demo facilities

Asset tracking in the Bay Area — questions we get

No. It has no link to port, terminal or shipping-line systems. It shows what happens inside your own building from your own tag reads, records and sensors.

No. Spatial Map is a location and status map. It does not model cleanroom rules or contamination and does not control equipment. Whether a given tag or reader is suitable for your environment is a question for the hardware vendor and your own engineers.

RFID suits “which room did it pass through?” at doors and stores and is cheap per tag; BLE tags with gateways suit a last-seen room without a walk-through but cost more per item. Many labs begin with RFID check-out at the store and a handheld room scan. See RFID versus BLE for asset tracking.

Yes. Upload the CSV or Excel file, give each row a room, and the map shows each asset in place. Later your own systems can post updates through the table write API.

No. Spatial Map is sold online and our team works with customers in the United States remotely, by video call and through the contact form. There are no local resellers or partners.

In US dollars, the same worldwide: a 7-day free trial for up to 5 facilities with no card, then Pro at $60 a month or $600 a year for up to 4 facilities. Larger estates are quoted as custom services, and devices we source are quoted per project.

Put your shared equipment on a map this week.

Start the free trial and open the Harborview demo, or send us an asset list and the plan of one lab, tool room or warehouse through the contact form.