Tracking · Asset tracking software

Asset tracking software for every tagged thing in the building

Spatial Map is asset tracking software that puts RFID, BLE, UWB, barcode and sensor data for your equipment on one multi-floor 3D map. Your tags, readers and positioning systems decide where an asset is; Spatial Map shows it in the right room on the right floor, with last seen, history, heatmaps, in-app alerts and reports. You choose the tag technology that fits the asset, and the map stays the same.

Last updated:

No credit card. Runs in the browser. Pro is $60/month for up to 4 facilities. Book a demo

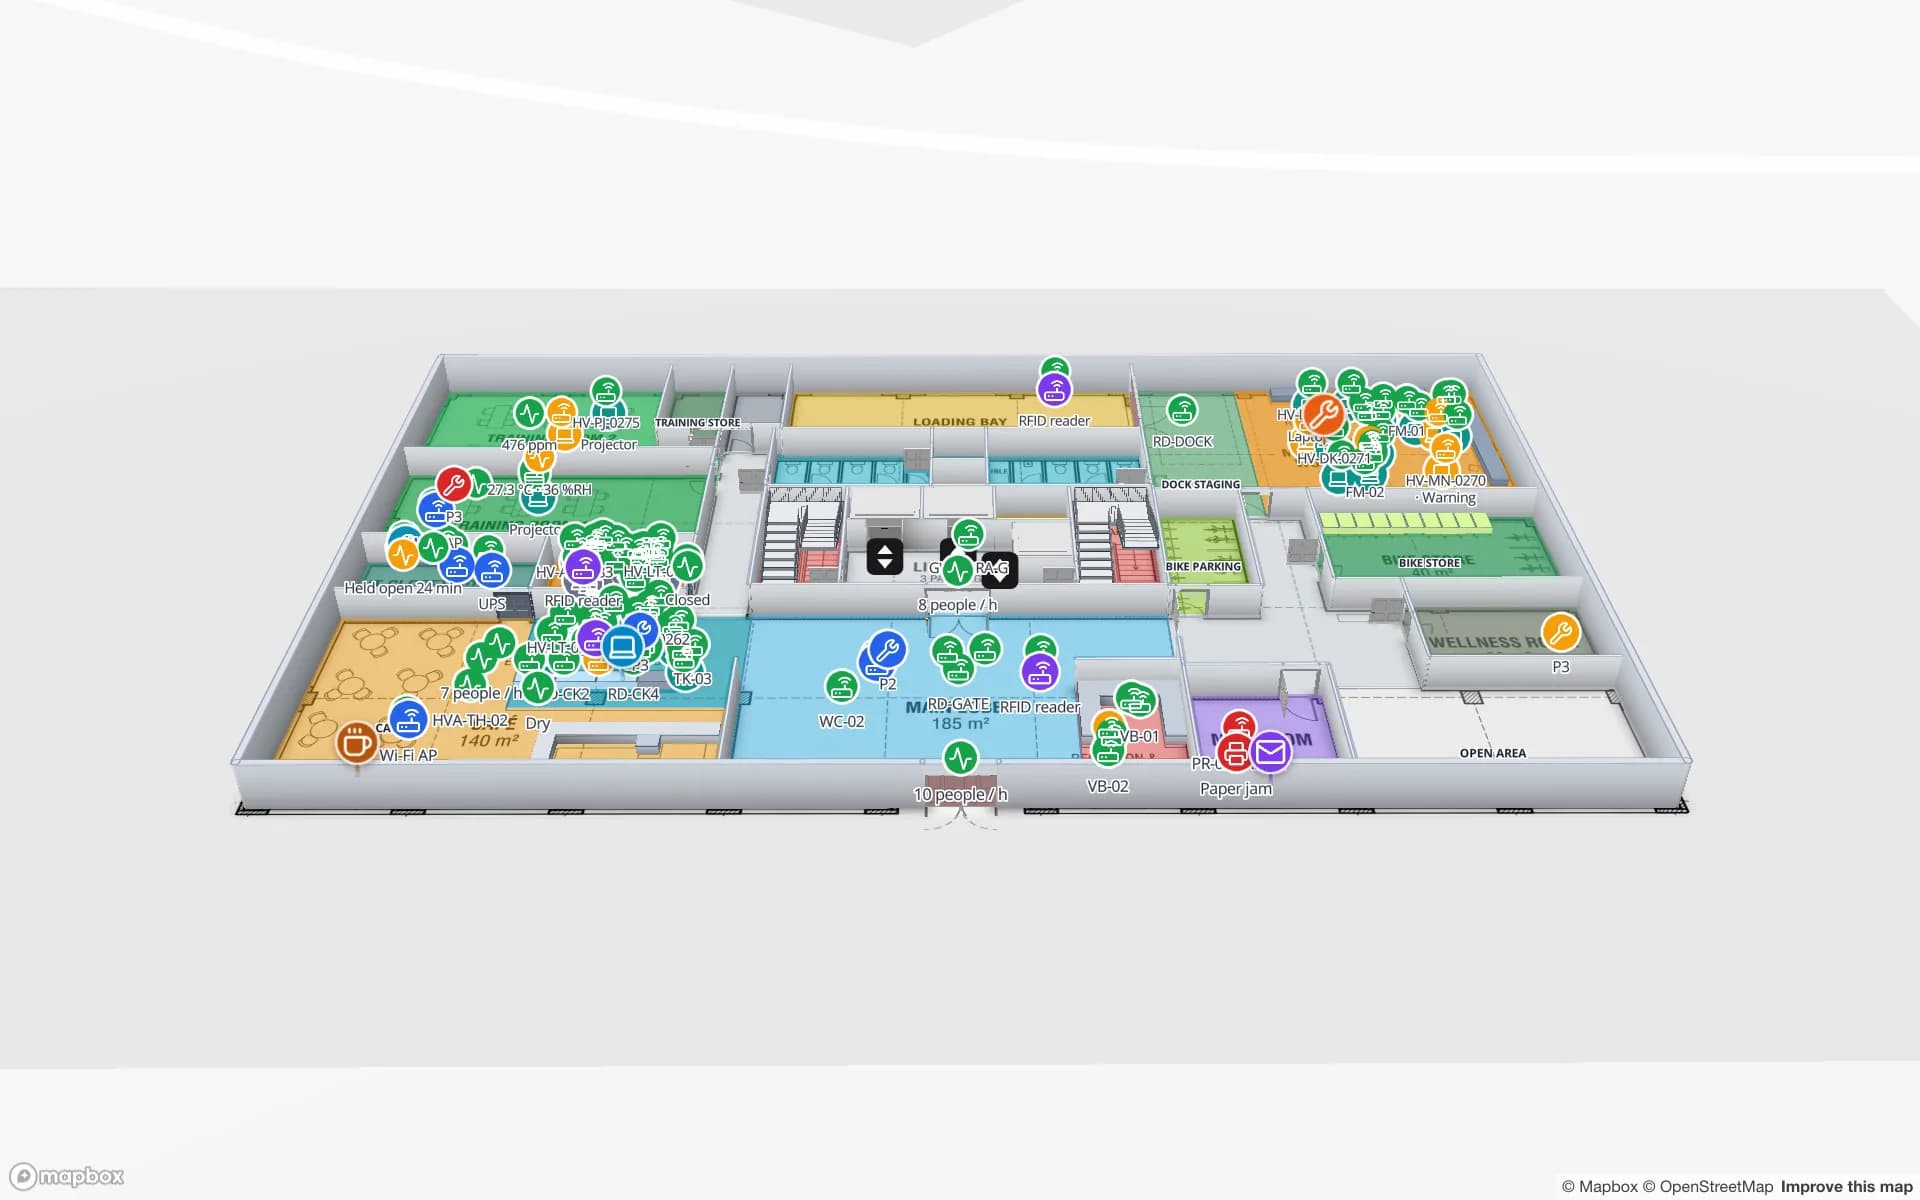
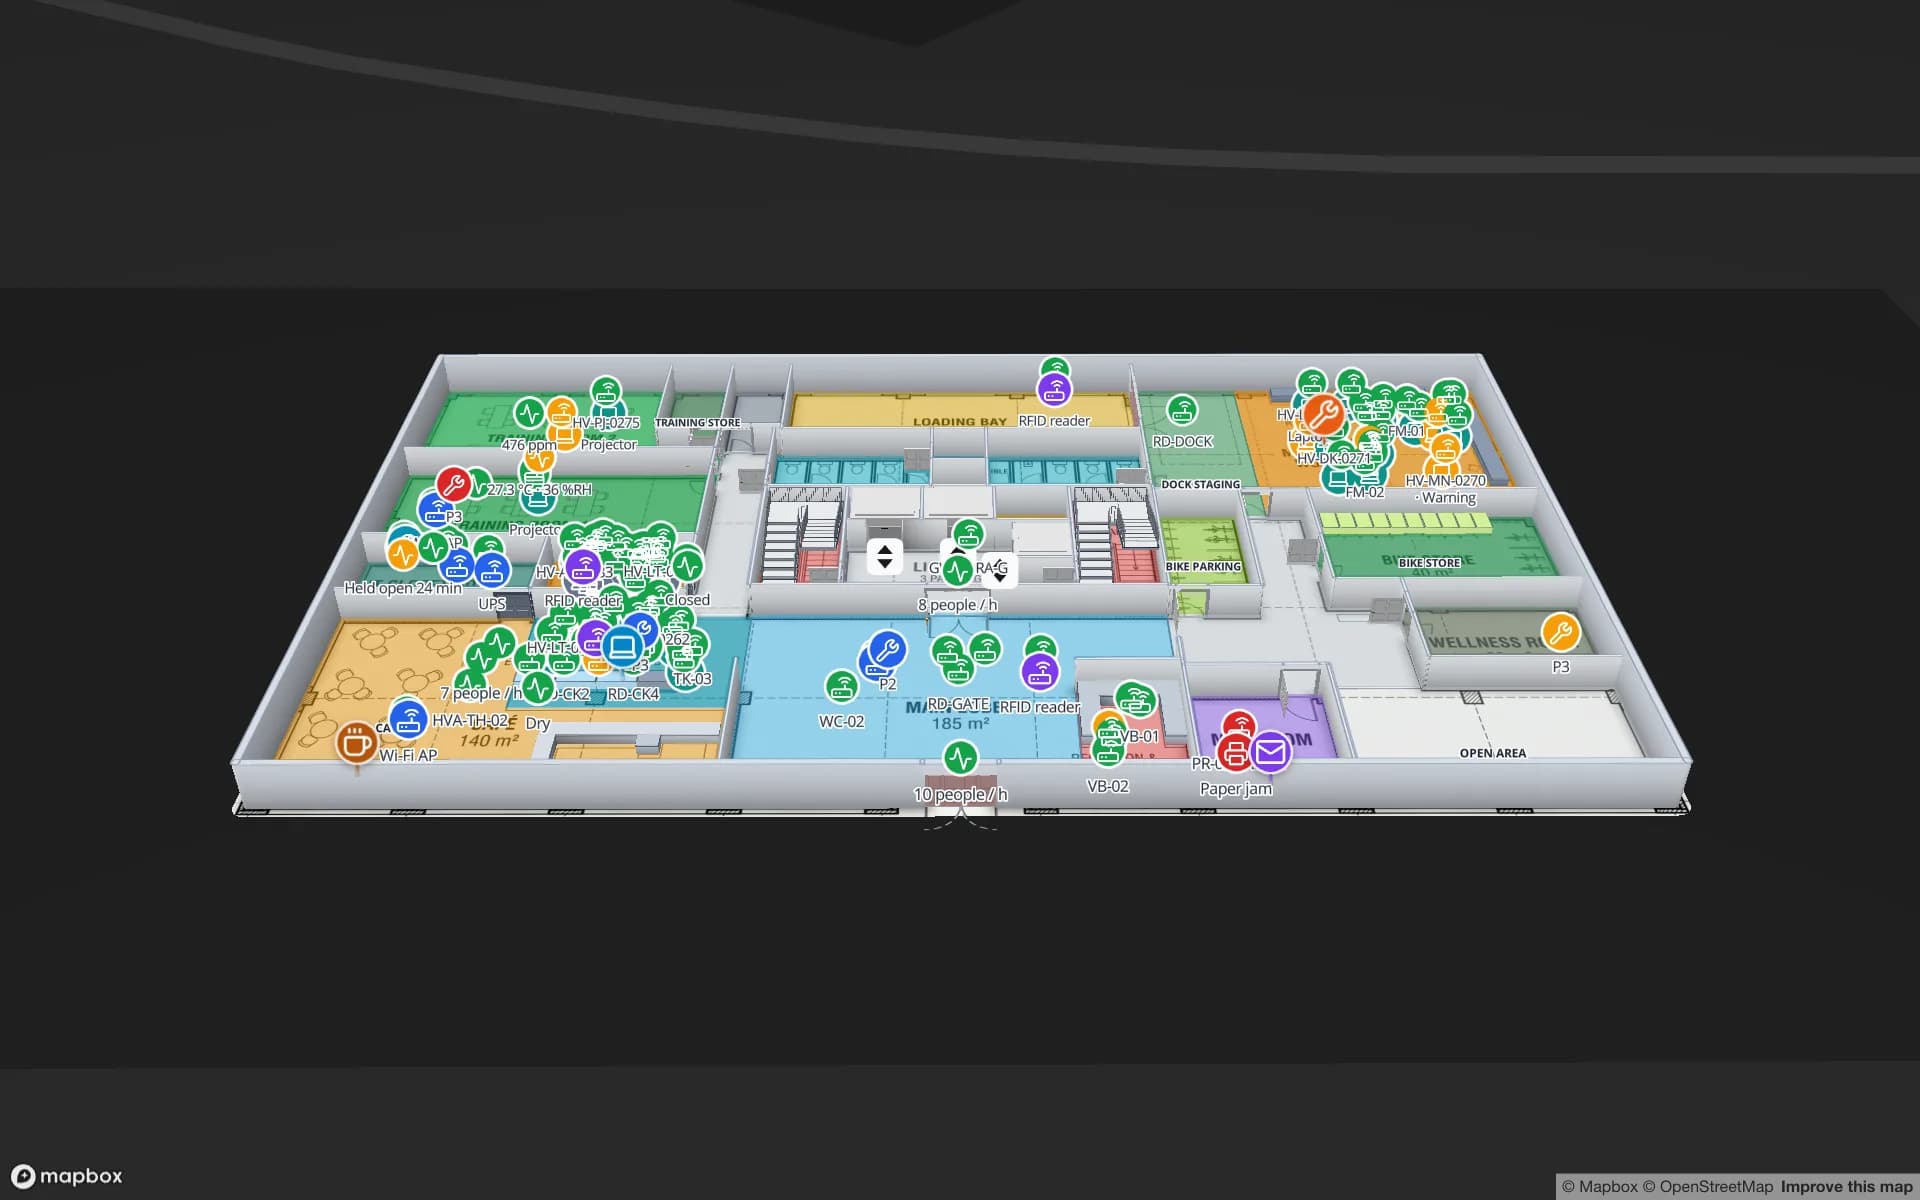
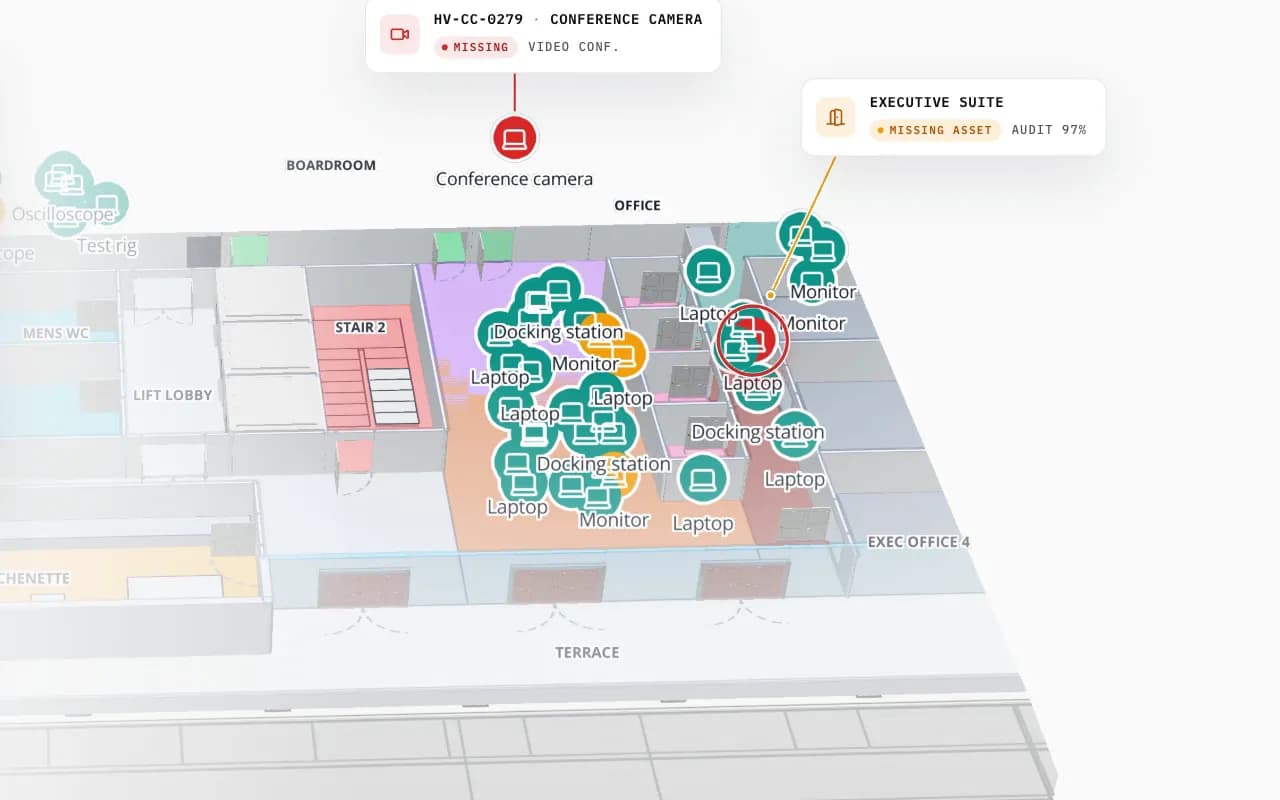
Harborview Corporate Campus in 3D: tagged office equipment by room, then the view zooms to the boardroom where a missing conference camera is marked
Harborview Corporate Campus — Building A
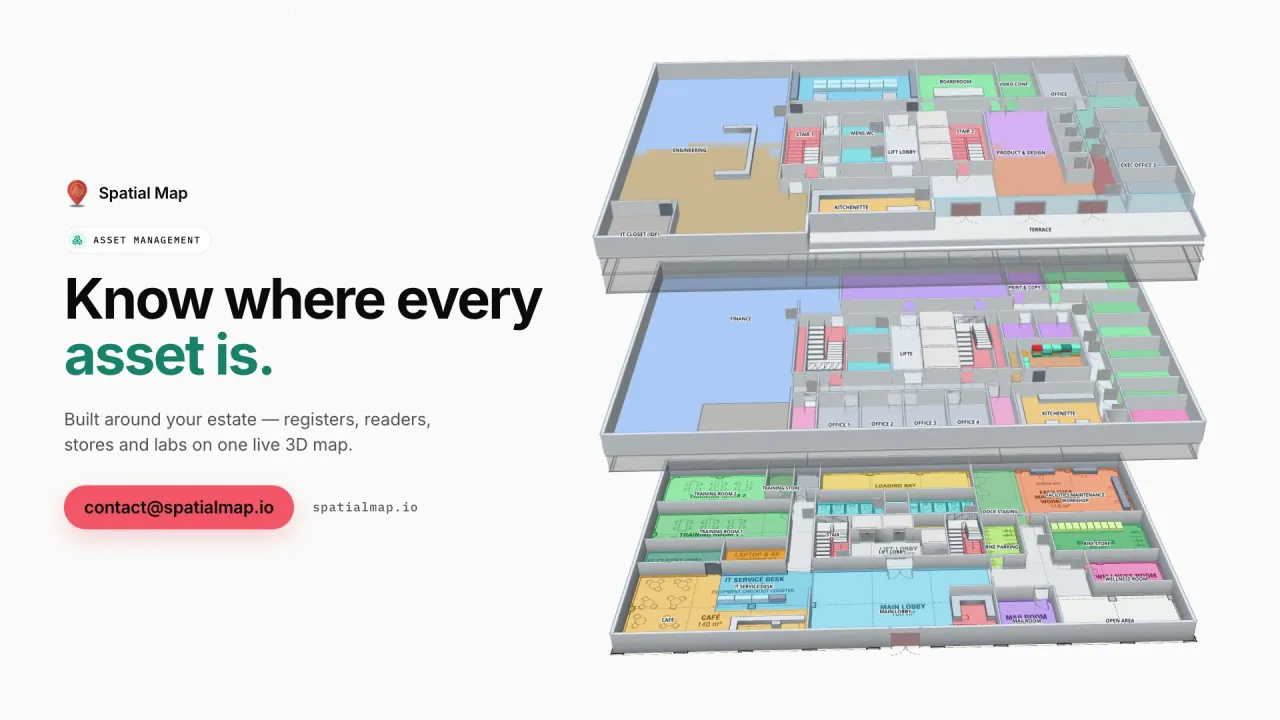
Harborview Corporate Campus (demo): the view moves into the second floor, where tagged laptops, monitors and docking stations sit in their rooms and a missing conference camera is pinpointed.
Demo facilities with RFID, BLE, sensor and gateway data
13
How often alert rules are checked
15 s
App languages, including Arabic (right to left)
6
Free trial, no credit card
7 days

What asset tracking software has to do

Tracking an asset means answering four questions without a phone call: what is it, where is it now, where has it been, and is something wrong. The answers come from two different sources. A register holds the identity: serial number, owner, cost centre, service date. A tag, reader or location system holds the position. Asset tracking software joins the two and shows the result on a plan people recognise.

In Spatial Map the register is a table and the position is a column or a second table. A data link binds the rows to the map as markers, value badges, coloured areas or heatmaps, so a laptop, a pallet jack and a spare part can sit on the same floor, each from the system that knows it best. Facility managers get the room, finance gets the register, operations gets the alert.
Which tag technology: RFID, BLE, UWB, barcode or sensors

There is no best technology, only the cheapest one that answers your question reliably. Ask what decision the position supports. “Did the server leave the data hall?” needs a read at a door. “Which ward is the pump in?” needs a room. “Is the forklift in its lane?” needs a position inside an aisle. The table below sets out the general characteristics as they are widely published; your vendor, tags and building change the real result, so pilot before you commit.

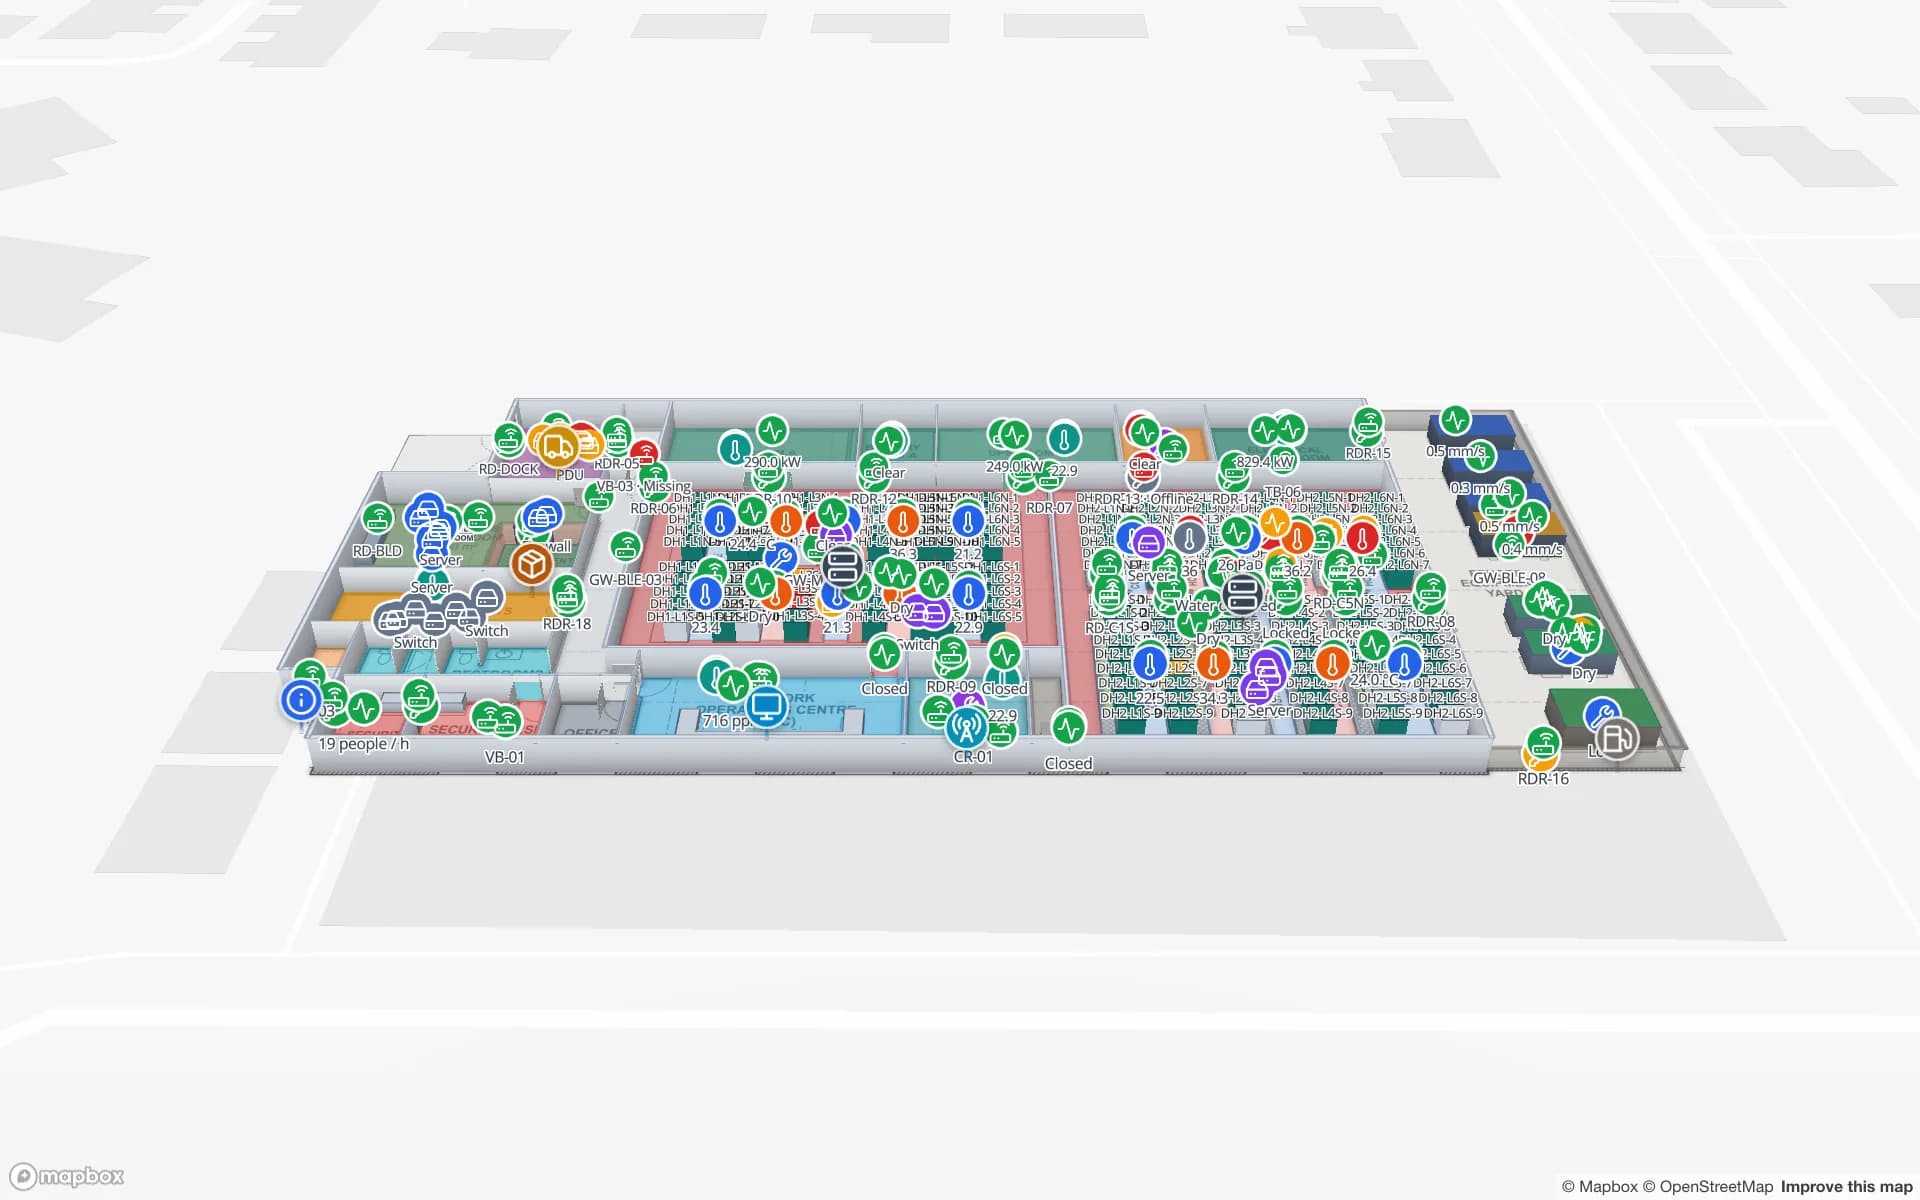
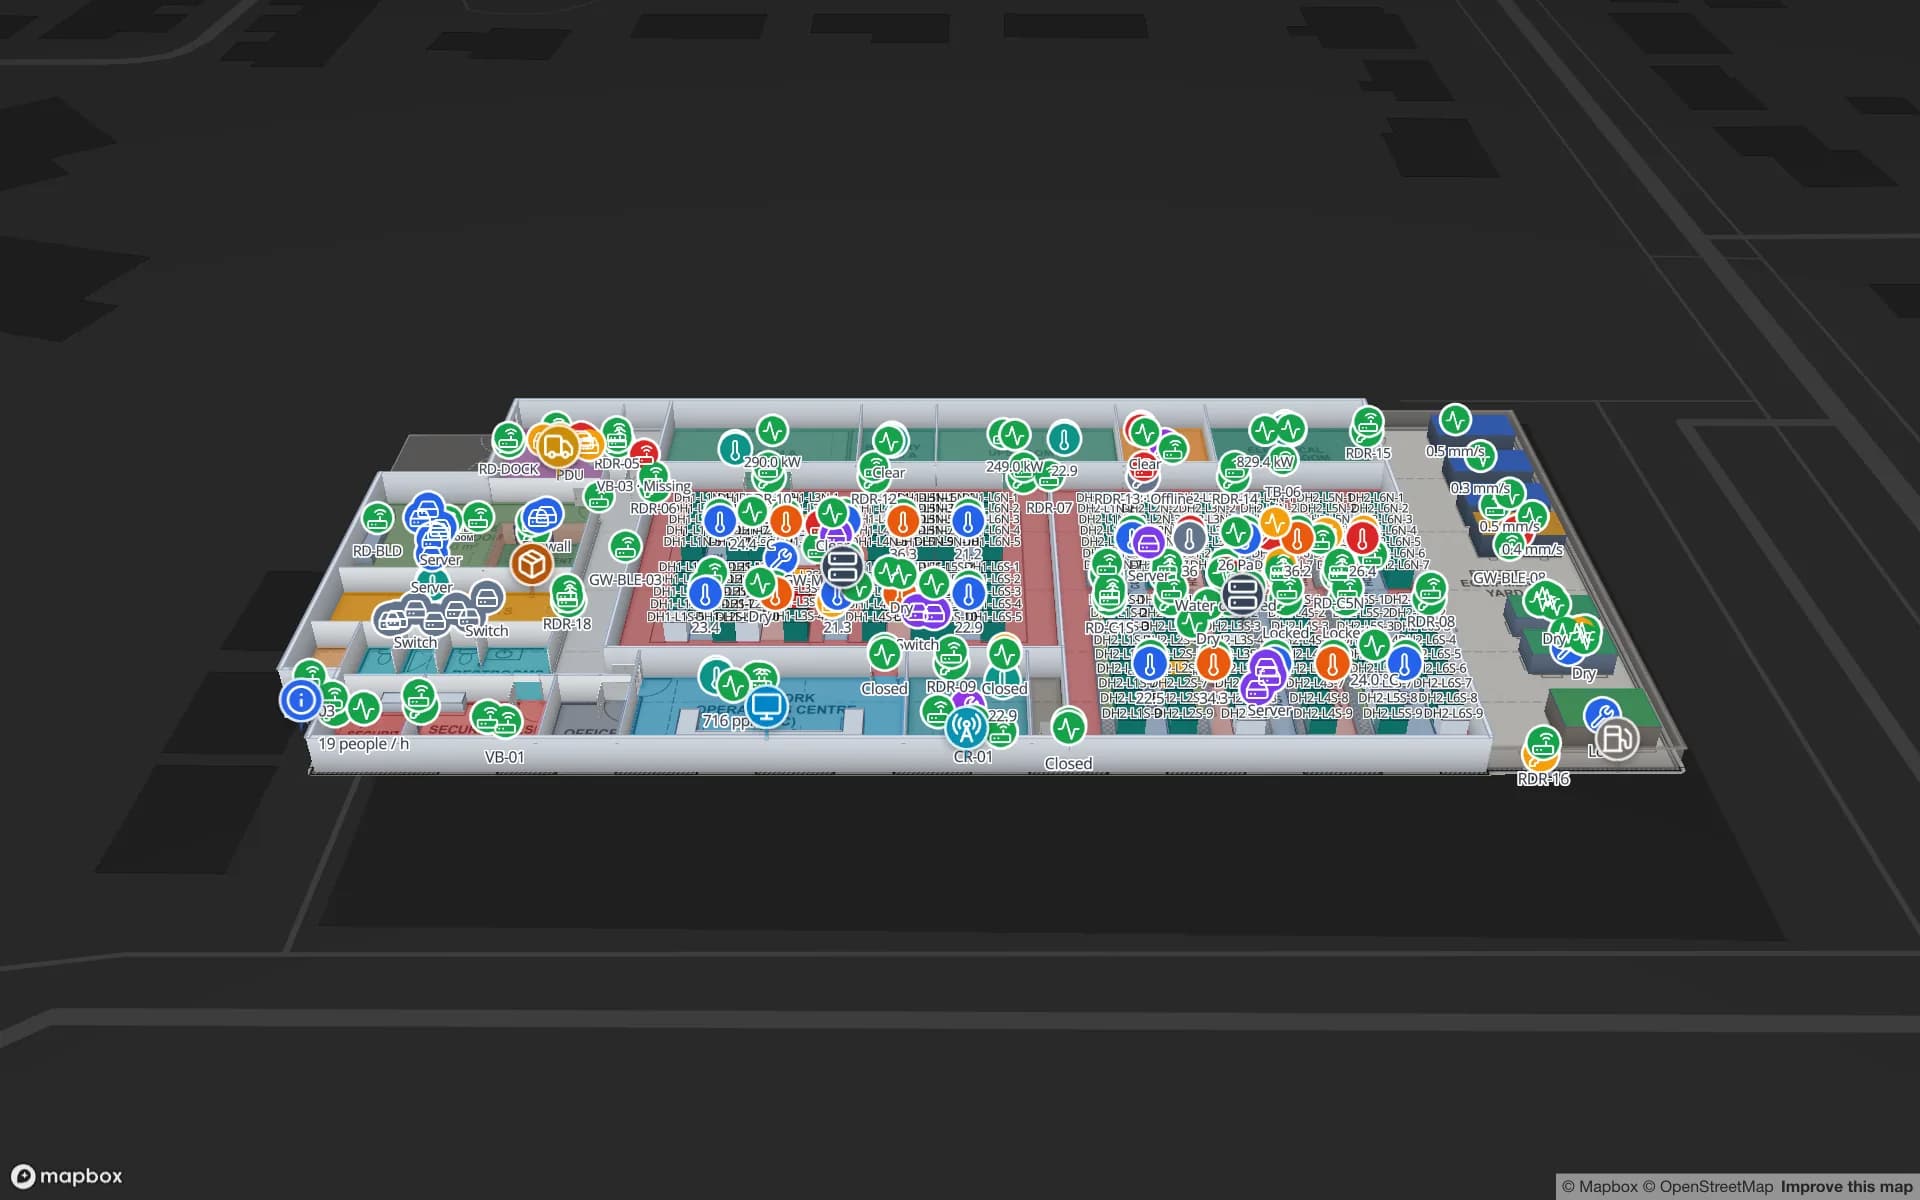
Ridgeline Data Center, a data center demo, in the Spatial Map 3D viewer with live device markers
Ridgeline Data Center
Ridgeline Data Center (demo): data halls and rows of cabinets drawn as racks, with environment sensors and tagged IT assets in place.

Fixed and mobile assets

Treat the two kinds differently, because the cost of knowing their location is different.

  • Fixed assets — cabinets, machines, printers, fire equipment, fridges. They rarely move, so their position is drawn once on the plan and the data that changes is status: calibration due, work order open, temperature, last audit. A barcode or RFID label and a periodic count are usually enough.
  • Mobile assets — wheelchairs, pumps, laptops, tools, carts, pallets, forklifts. The position is the point. RFID at doors and gates tells you which zone an item crossed into, BLE gives room or zone presence, UWB gives positions inside the room.
  • Mixed estates — most buildings. Spatial Map shows each feed as its own layer, so a supervisor switches RFID reads, BLE tags and sensors on and off without leaving the map.

What Spatial Map shows and what your hardware computes

The split matters when you compare vendors. Your hardware and location engine read tags, filter noise and work out a zone or a coordinate. Spatial Map takes that result, shows it on a 3D map of your building and adds history, heatmaps, alerts, reports, Ask AI (beta) and read-only share links.

Spatial Map does not compute positions from signal strength, does not talk to tags or readers directly, and writes nothing back to your ERP or asset register. It shows what your system reports, a few seconds behind it. Alerts appear in the app only (bell, toast and Alerts page), with no email, SMS or push. If you do not have a location system yet, we can source RFID, BLE or UWB hardware and demo kits for a project, quoted per project, with warranty and device support from the manufacturer.

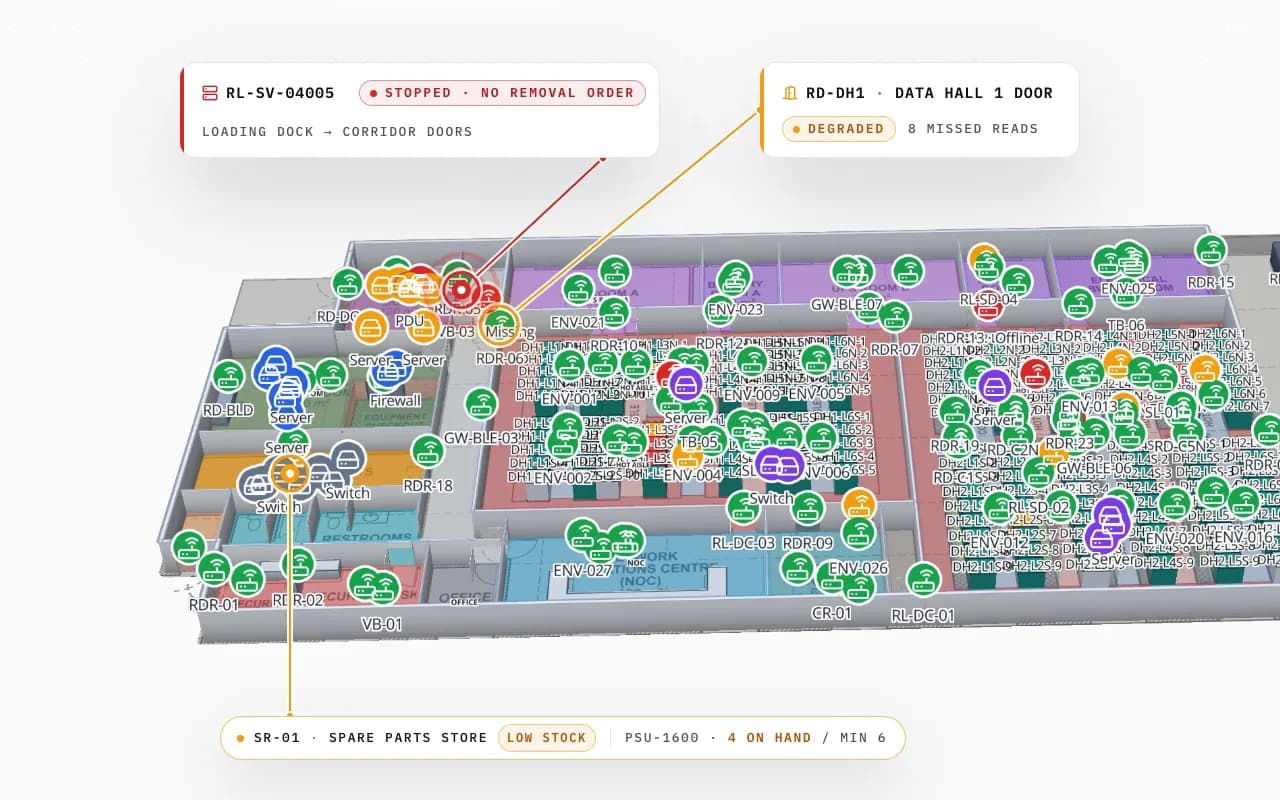
Ridgeline Data Center in 3D with hundreds of tagged servers and devices; a server read at the loading-dock door without a removal order is called out, with a degraded door reader and a low-stock spare-parts store
Ridgeline Data Center
Ridgeline Data Center (demo): a server read at the loading-dock door without a removal order, and a data-hall door reader with missed reads.

How to choose the tag technology

General characteristics, widely published. Treat every figure as a starting point for your own pilot.

Barcode / QRPassive UHF RFIDBLEUWBSensors
What your system reportsA scan by a person at a place and timeA read at a reader, portal or antenna zoneRoom or zone presence; x/y with a positioning enginex/y, often with height, from an anchor networkA reading per sensor: temperature, door, occupancy, count
PowerNoneNone on the tag; the reader powers itBattery in the tagBattery in the tagBattery or mains
Detail you can expectWhere it was last scannedPresence at a read point, not a continuous trackRoom or zone; a few metres in a well-planned setupOften quoted below a metre with dense, surveyed anchorsThe location of the sensor, not of an asset
InfrastructureScanners and a habitReaders and antennas at doors, choke points and on handheldsPowered gatewaysDense powered anchors and a site surveyGateways or a monitoring platform
Cost per tagLowestCents to a few currency units, more on metalHigher than RFIDUsually the highestA device, not a tag
Good fitFixed assets, periodic auditsPallets, cartons, tools, IT equipment passing doorsWheelchairs, carts, instruments, staff badgesForklifts and vehicles where lane position mattersConditions around assets: cold rooms, data halls

More on choosing in RFID vs BLE for asset tracking and real-time indoor asset tracking. Spatial Map shows all of them the same way: an ID and a position or read point per row.

How Spatial Map does it

From tagged assets to a live map in four steps

  1. 01

    Map the building

    Import PDF, DWG or image floor plans and draw rooms, racks, doors, stairs and lifts, or let AI Map draft them for you to review.

  2. 02

    Pick the technology per asset class

    Use the table above: barcode or RFID for fixed assets, RFID at doors for items that cross zones, BLE or UWB where the room or the aisle matters.

  3. 03

    Connect the feed

    Post rows with the write API, let Spatial Map poll a REST endpoint, upload a CSV, or connect a BlueIOT system through device connections.

  4. 04

    Link, alert, report

    Bind each table to the map, add rules such as “not updated for 30 minutes”, and share a read-only view with a client or auditor.

Asset tracking in the demos

Office and campus equipment

Laptops, monitors and shared equipment located room by room across three floors, with a missing camera pinpointed.

Data center IT assets

Cabinets drawn as racks, IT assets and spares tied to the cabinet they belong to, and removals read at the door.

Campus lab equipment

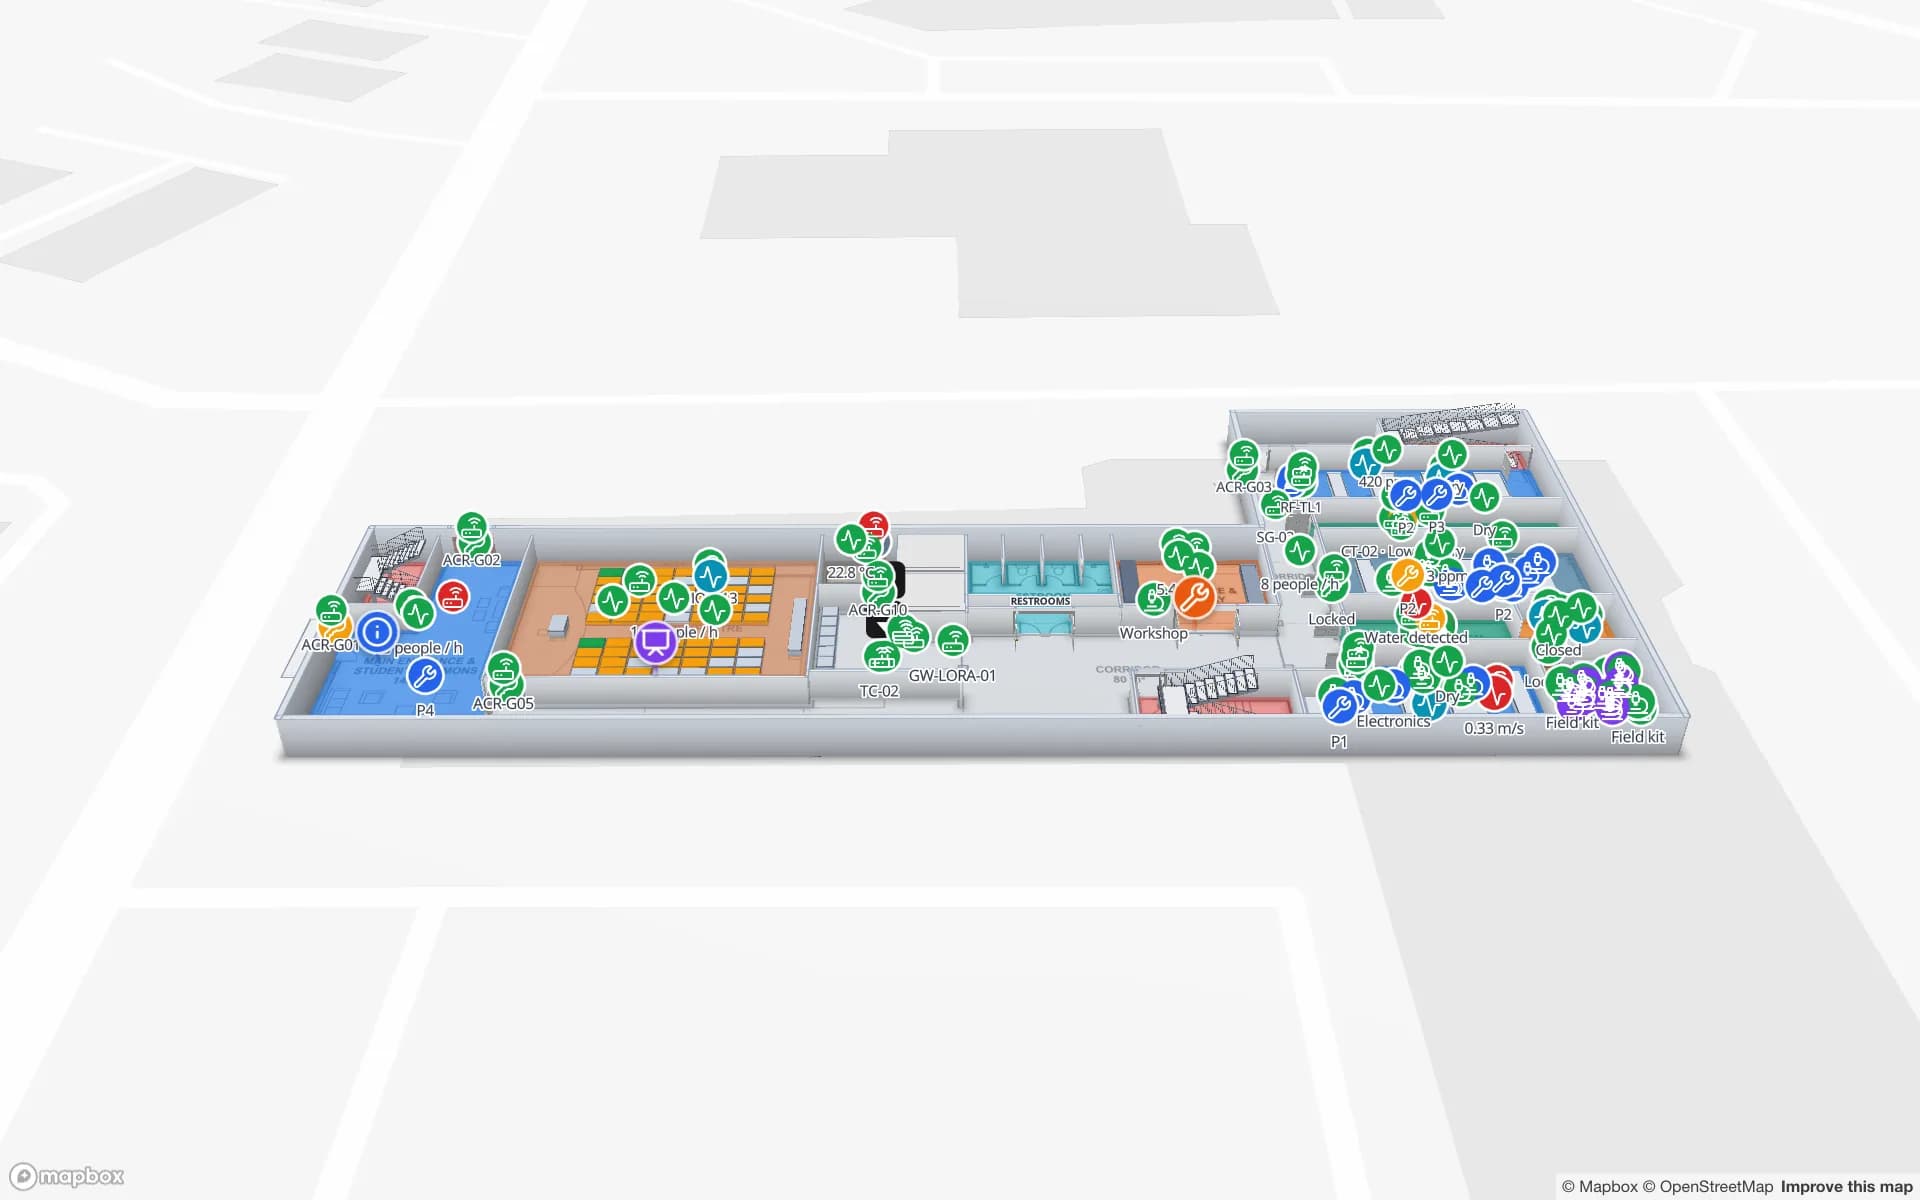
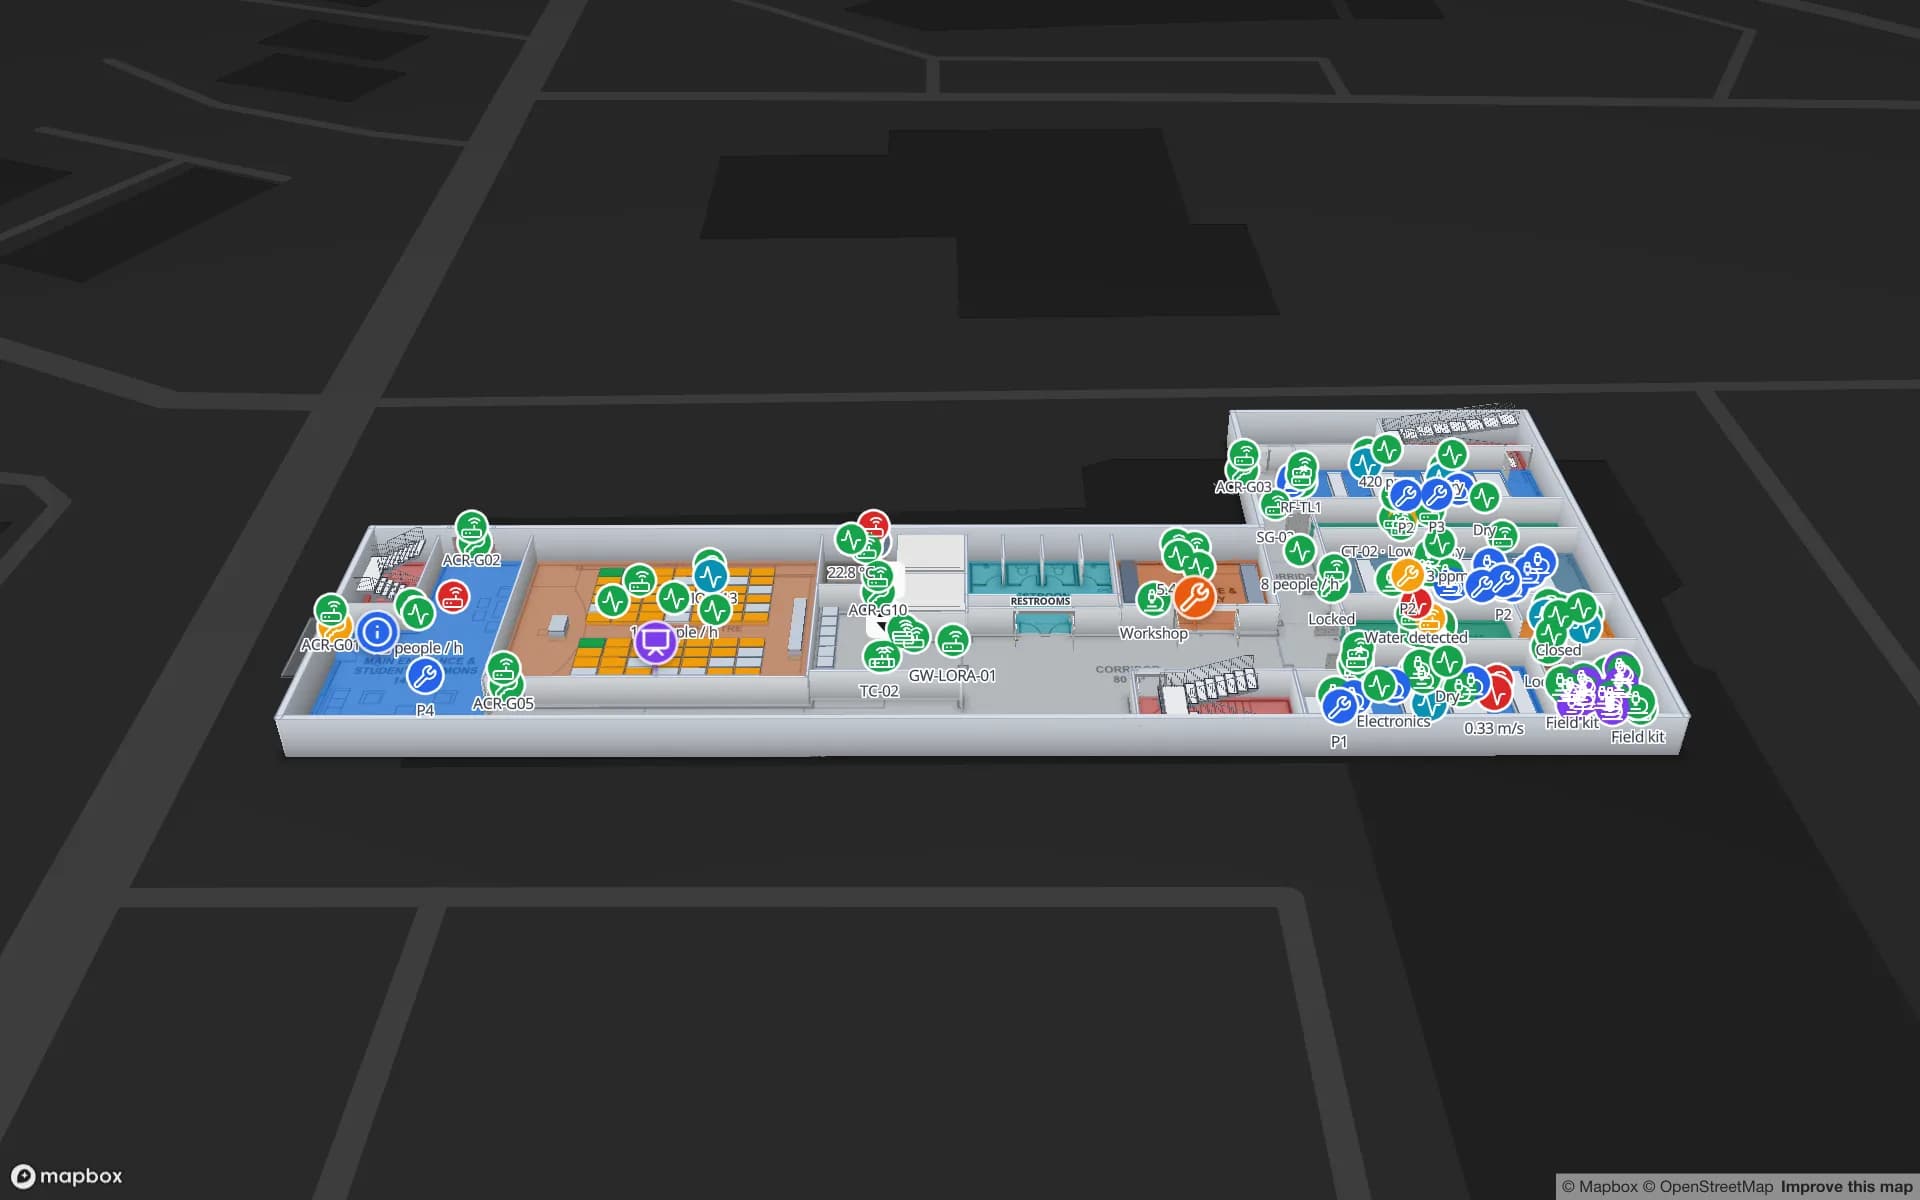
A microscope out of service and an instrument overdue for calibration, shown in the rooms where they stand.

Airport equipment

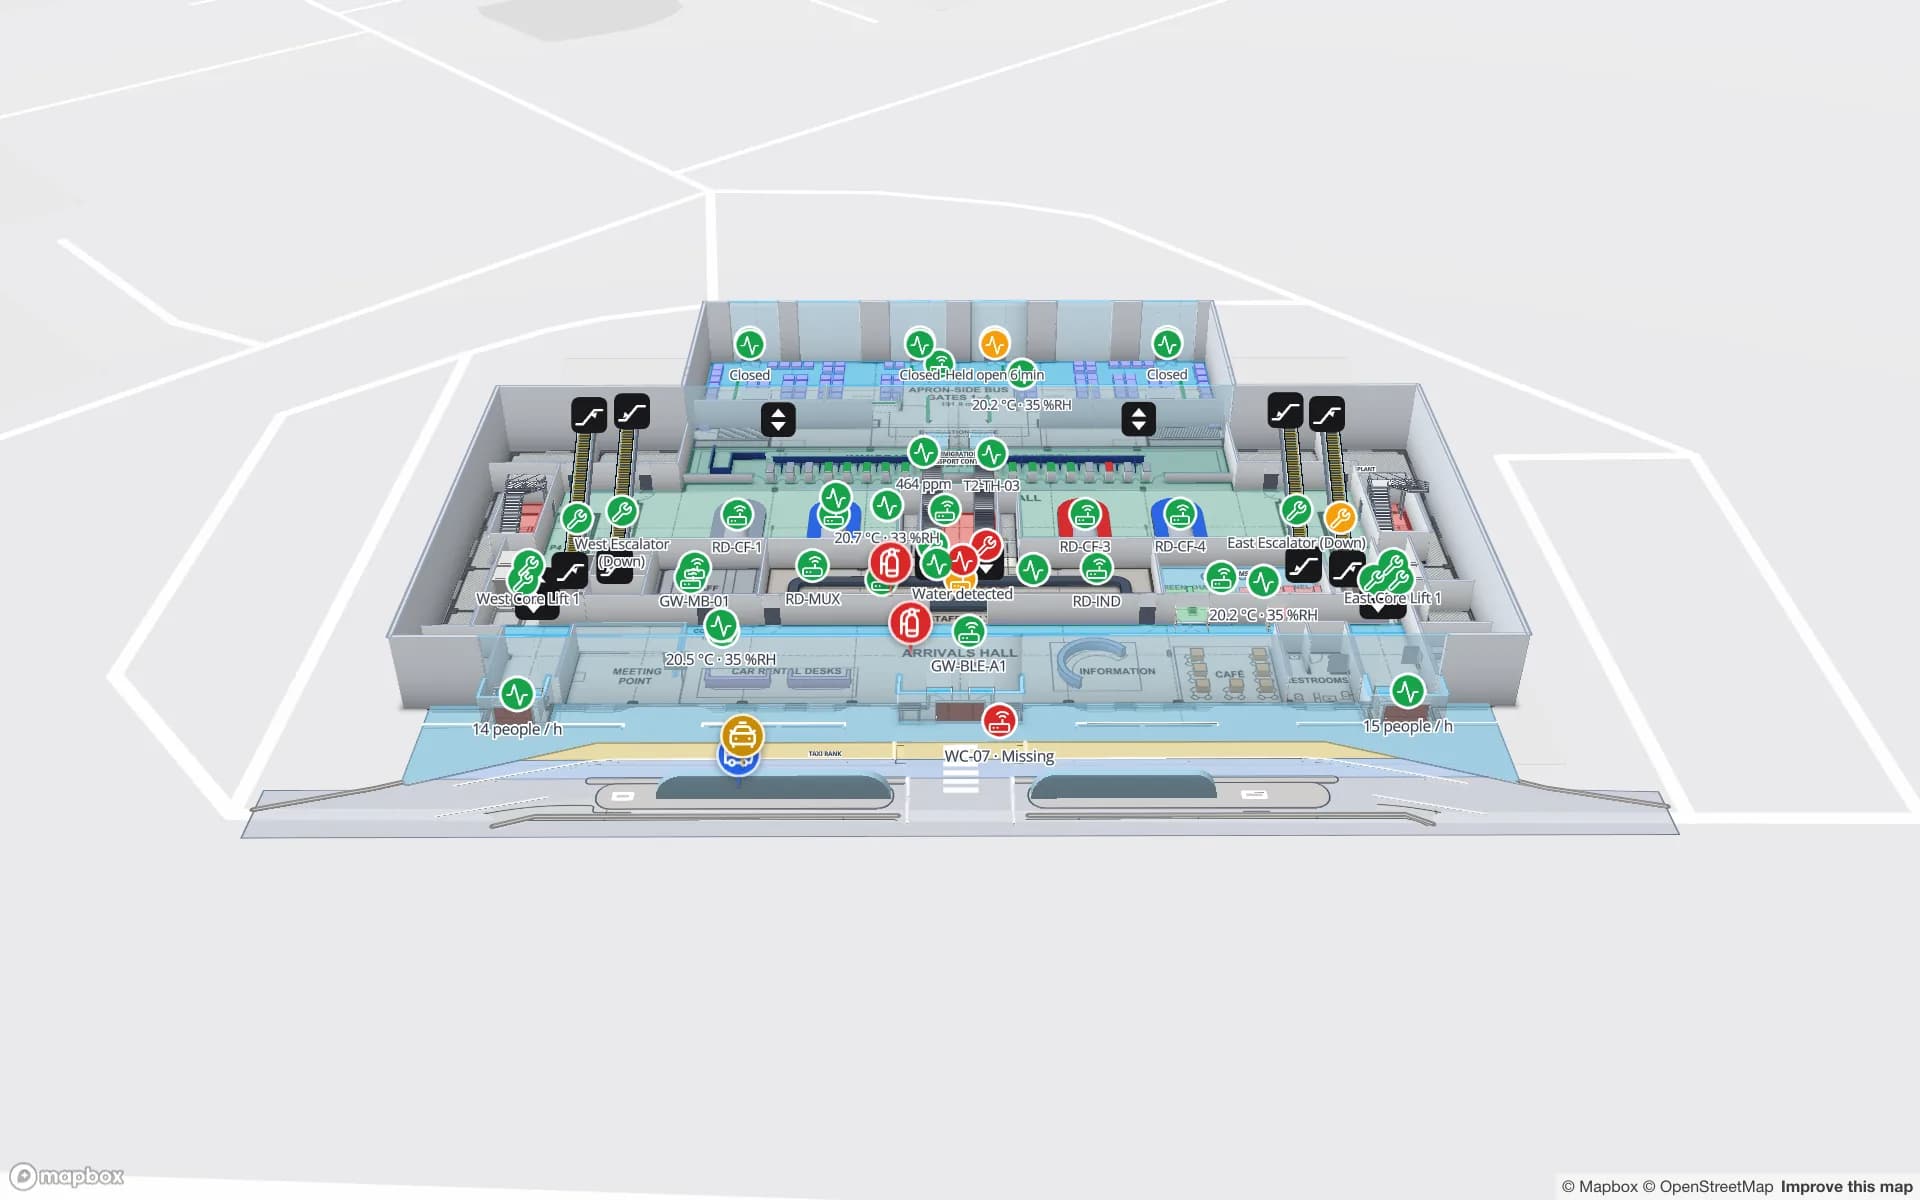
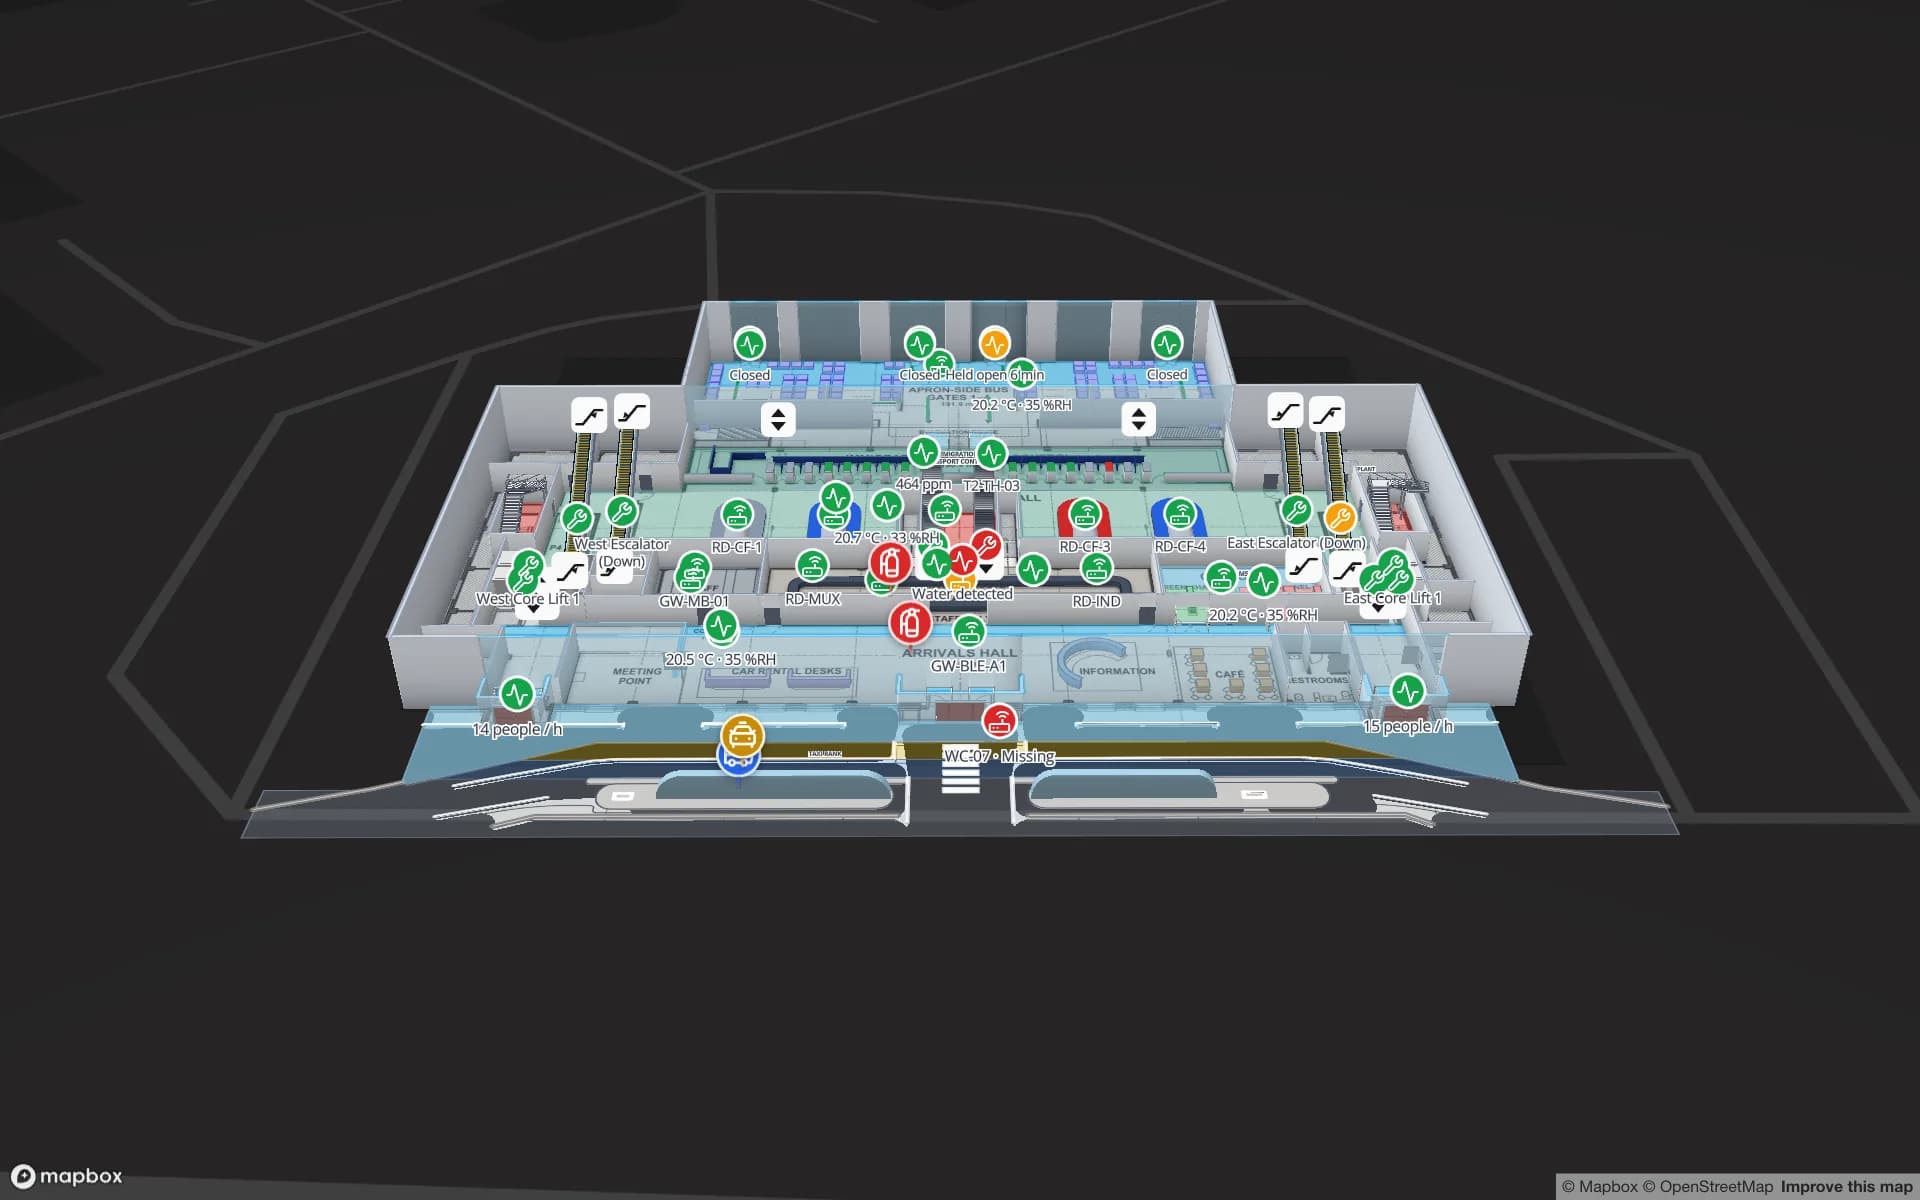
Loan wheelchairs and staff across a terminal, with a count per hall.

See it on real demo facilities

Fictional names, real floor plans, live sensors, RFID, BLE tags and gateways — open any of them in the browser.

All 13 demo facilities

Asset tracking software — frequently asked questions

The cheapest one that answers your question reliably. Barcode or passive RFID suit fixed assets and items crossing doors, BLE suits room-level tracking of mobile equipment, and UWB suits positions inside an aisle. Many sites mix two or three, and Spatial Map shows them on one map.

No. Your readers, gateways or anchors and their positioning engine compute a zone or coordinates. Spatial Map shows what they report on a multi-floor 3D map. It never works out positions from Bluetooth signal strength itself.

Yes. Each system writes to its own table and gets its own data link and layer, so they appear together or one at a time. Barcode scans arrive as rows from your scanner app or a file upload.

Four ways: tables with a write API over HTTPS, REST polling, CSV, Excel, JSON or GeoJSON upload, and a built-in BlueIOT connection for UWB systems. Other RTLS vendors connect through the write API or REST polling. There are no other built-in drivers and no MQTT yet.

In the app, yes. A rule such as “not updated for 30 minutes” is checked every 15 seconds and shows in the bell, as a toast and on the Alerts page, with Show on map. There is no email, SMS or push, and nothing is written back to other systems.

On request we source RFID, BLE and UWB hardware and demo kits for a project, quoted per project. There is no online shop. Warranty and device support come from the manufacturer. See demo kits.

A 7-day free trial covers up to 5 facilities with no credit card. Pro is $60 a month or $600 a year for up to 4 facilities. Hardware, relays and larger estates are quoted per project as custom services or custom development.

See your assets on your own floor plan.

Start a free trial and open the Harborview, Ridgeline and Westbrook demos, or send us a floor plan and an asset list and we will show you your own building.