Phoenix · Chip fabs, data centers, extreme heat and the West Valley

Asset tracking in Phoenix, for fab tools, server rooms and desert warehouses

Spatial Map shows where tagged equipment, tools and spares are on a live 3D map of each building, using the reads and positions your RFID and BLE systems already produce. Asset tracking in Phoenix covers three kinds of building: semiconductor fabs and their suppliers in Chandler and the East Valley, data centers across the metro, and new distribution parks in the West Valley, all in a climate that is hard on people and on hardware. Each building is its own facility, and all of them can sit in one workspace.

No credit card. Runs in the browser. Pro is $60/month for up to 4 facilities. Book a demo

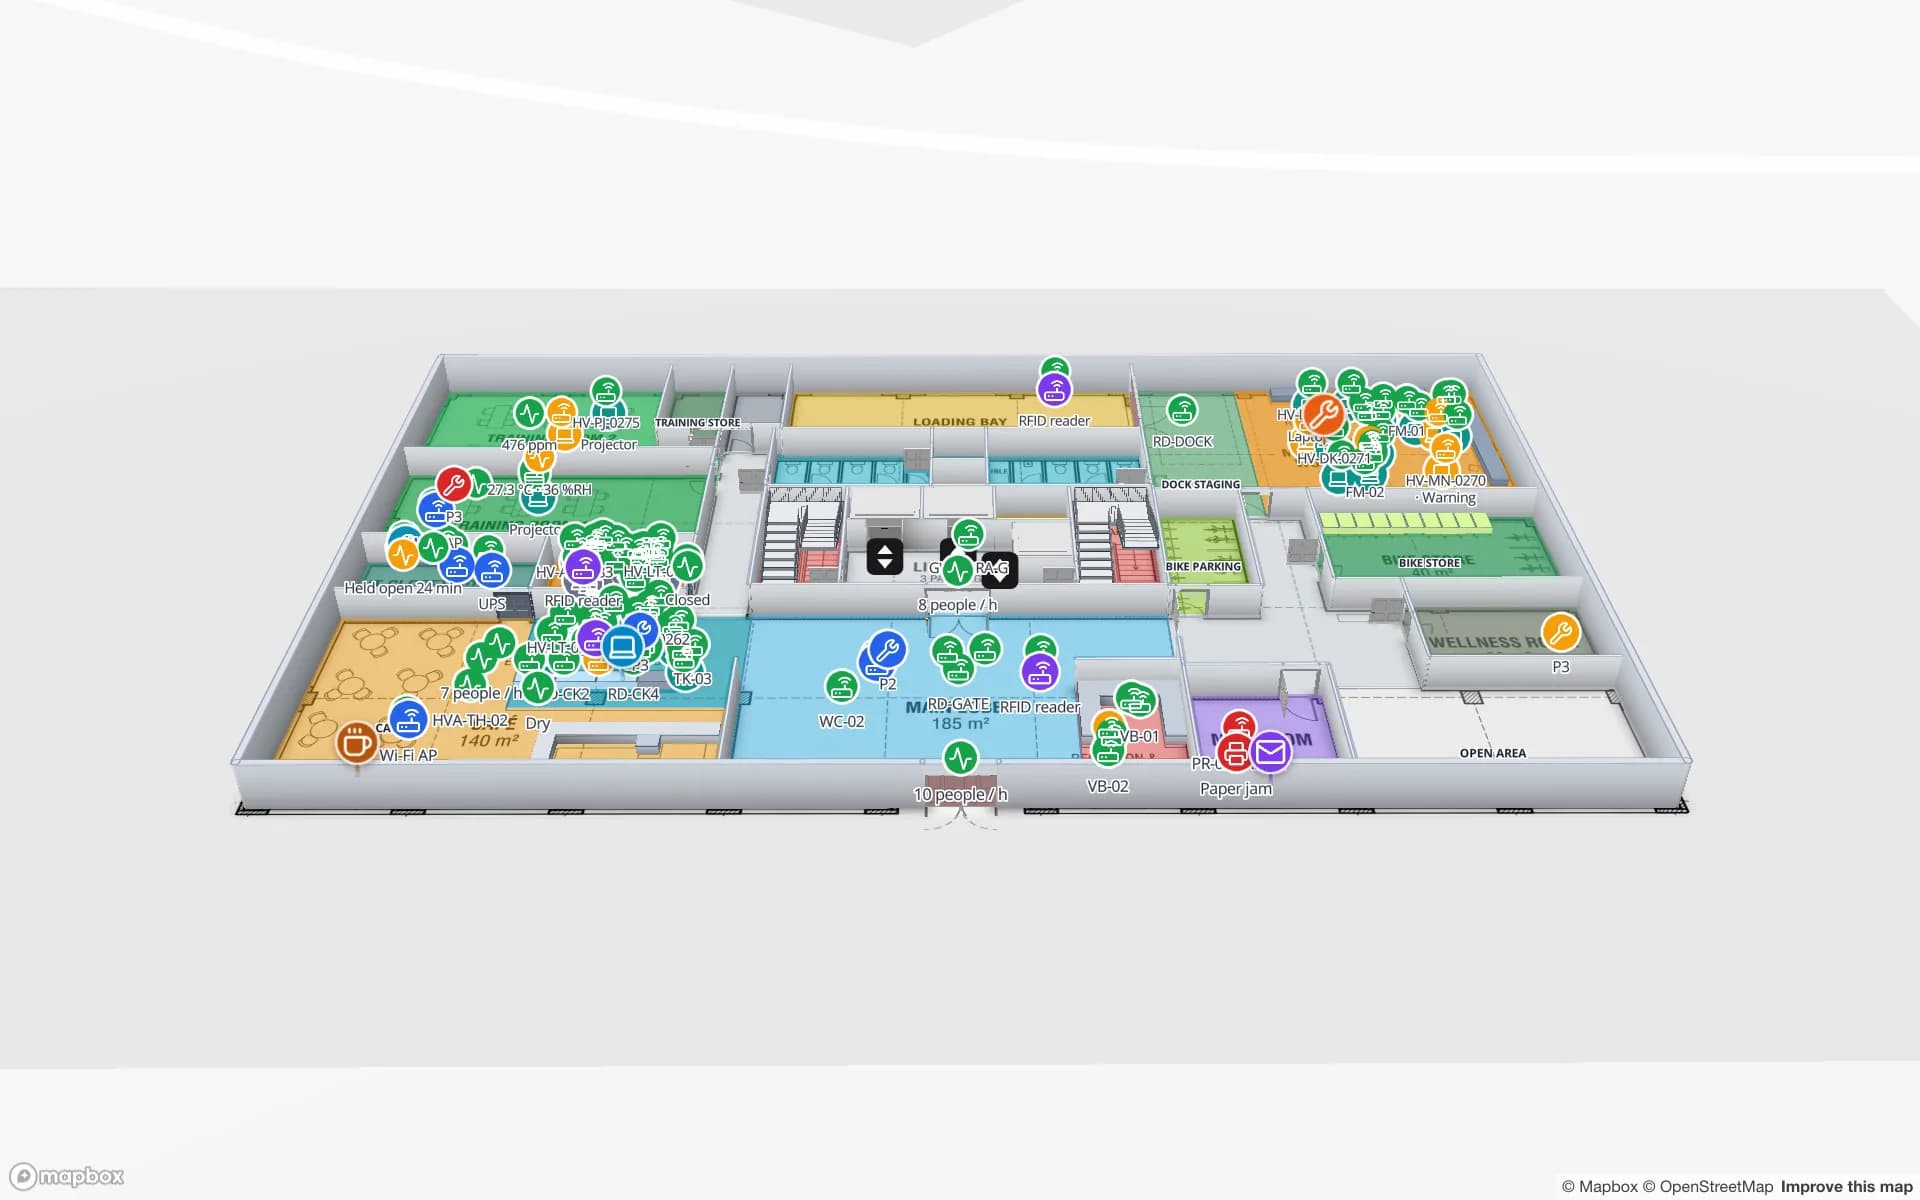
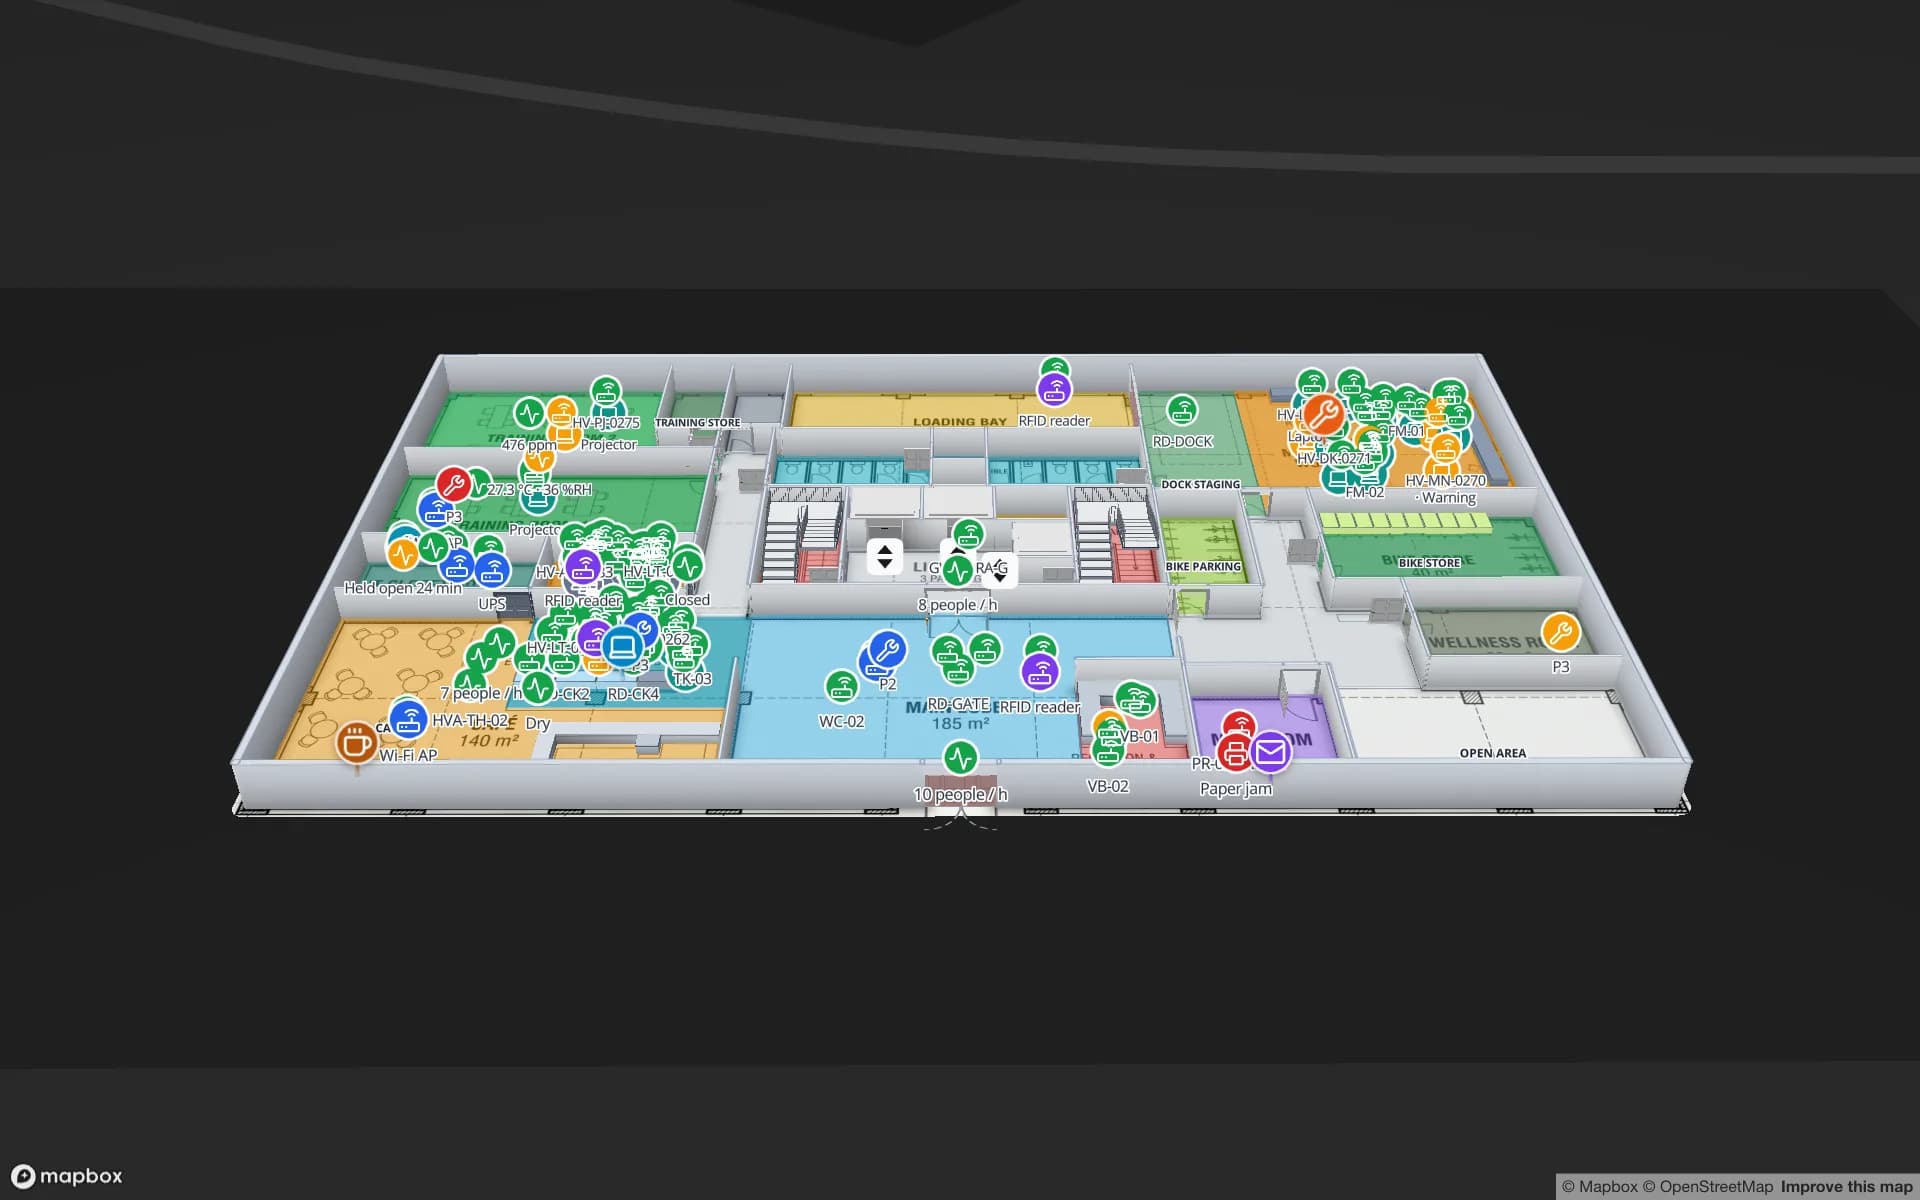
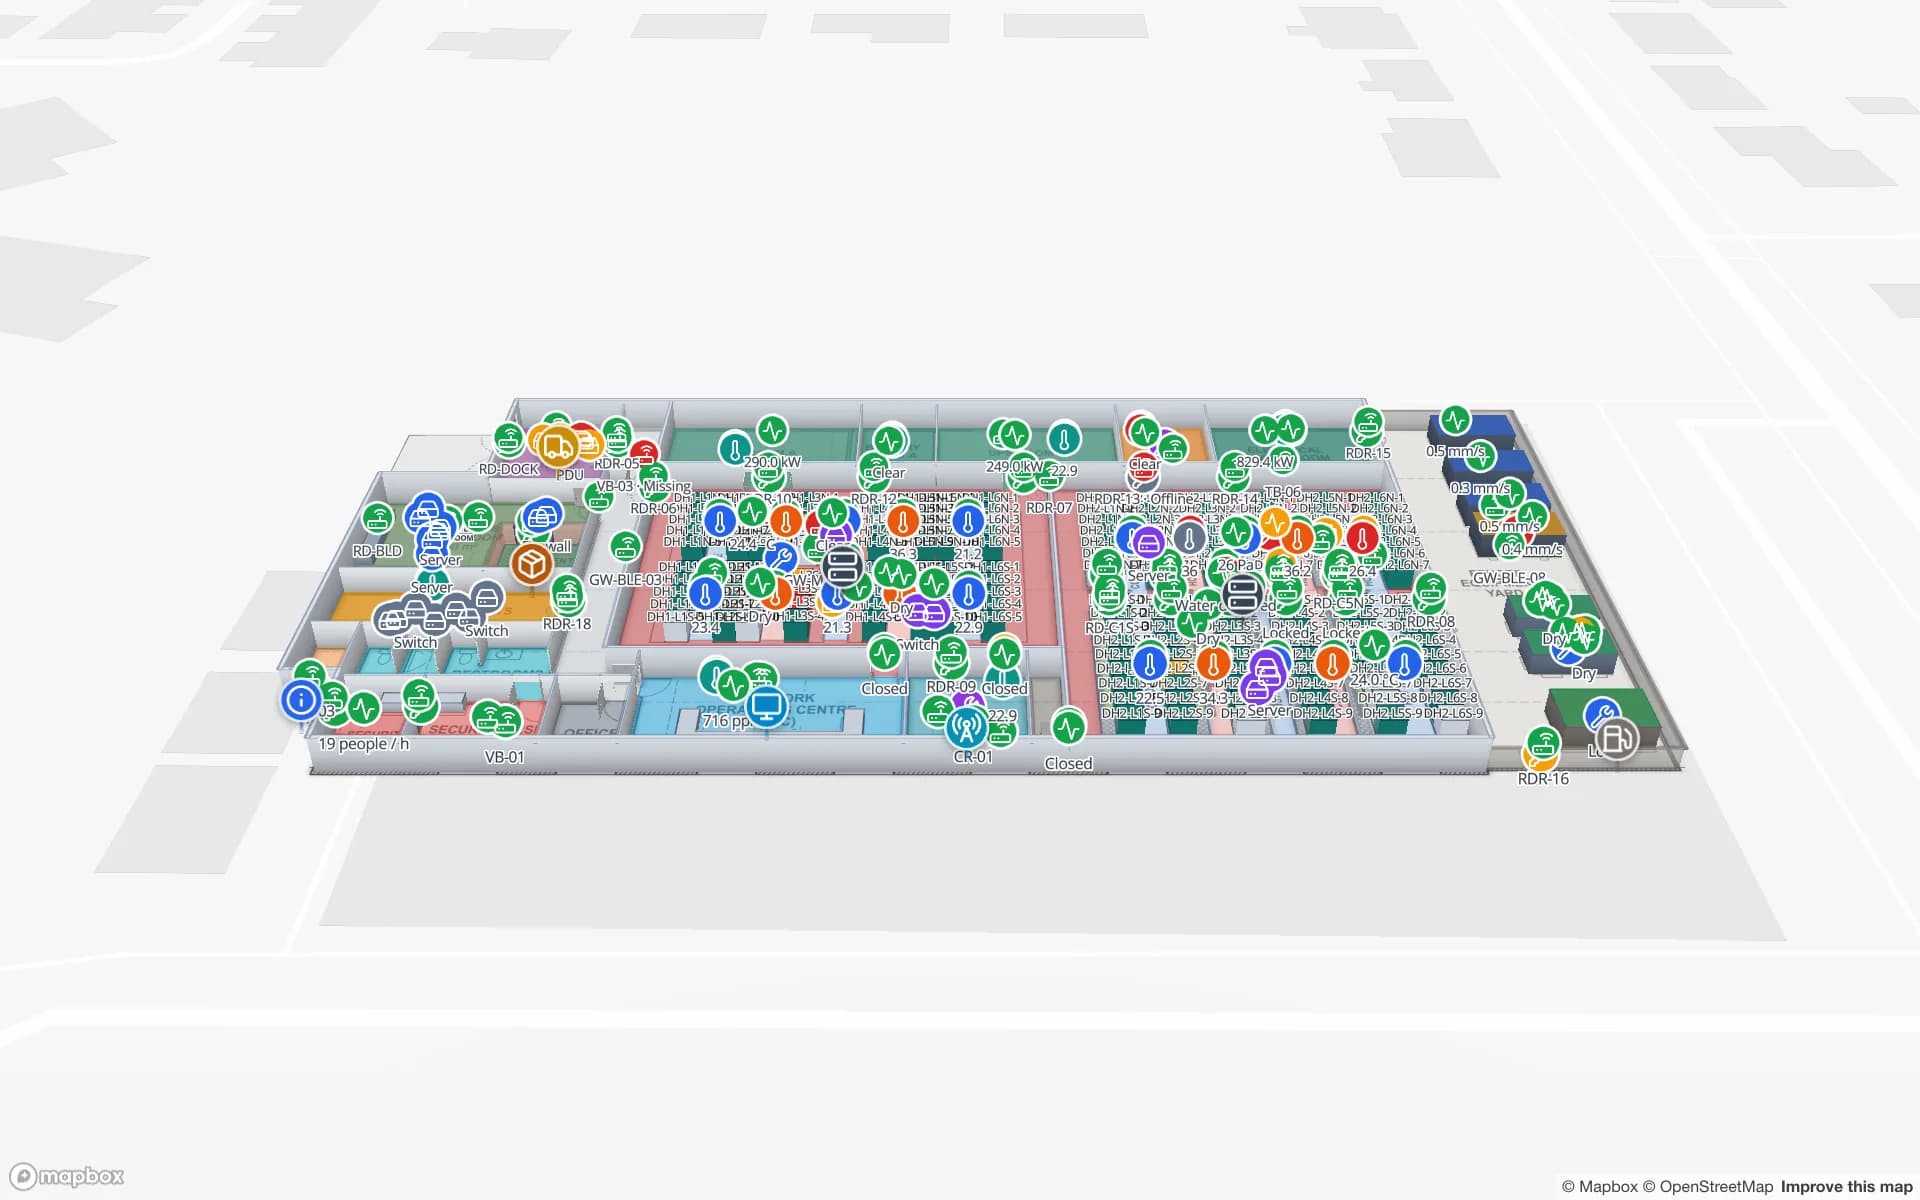
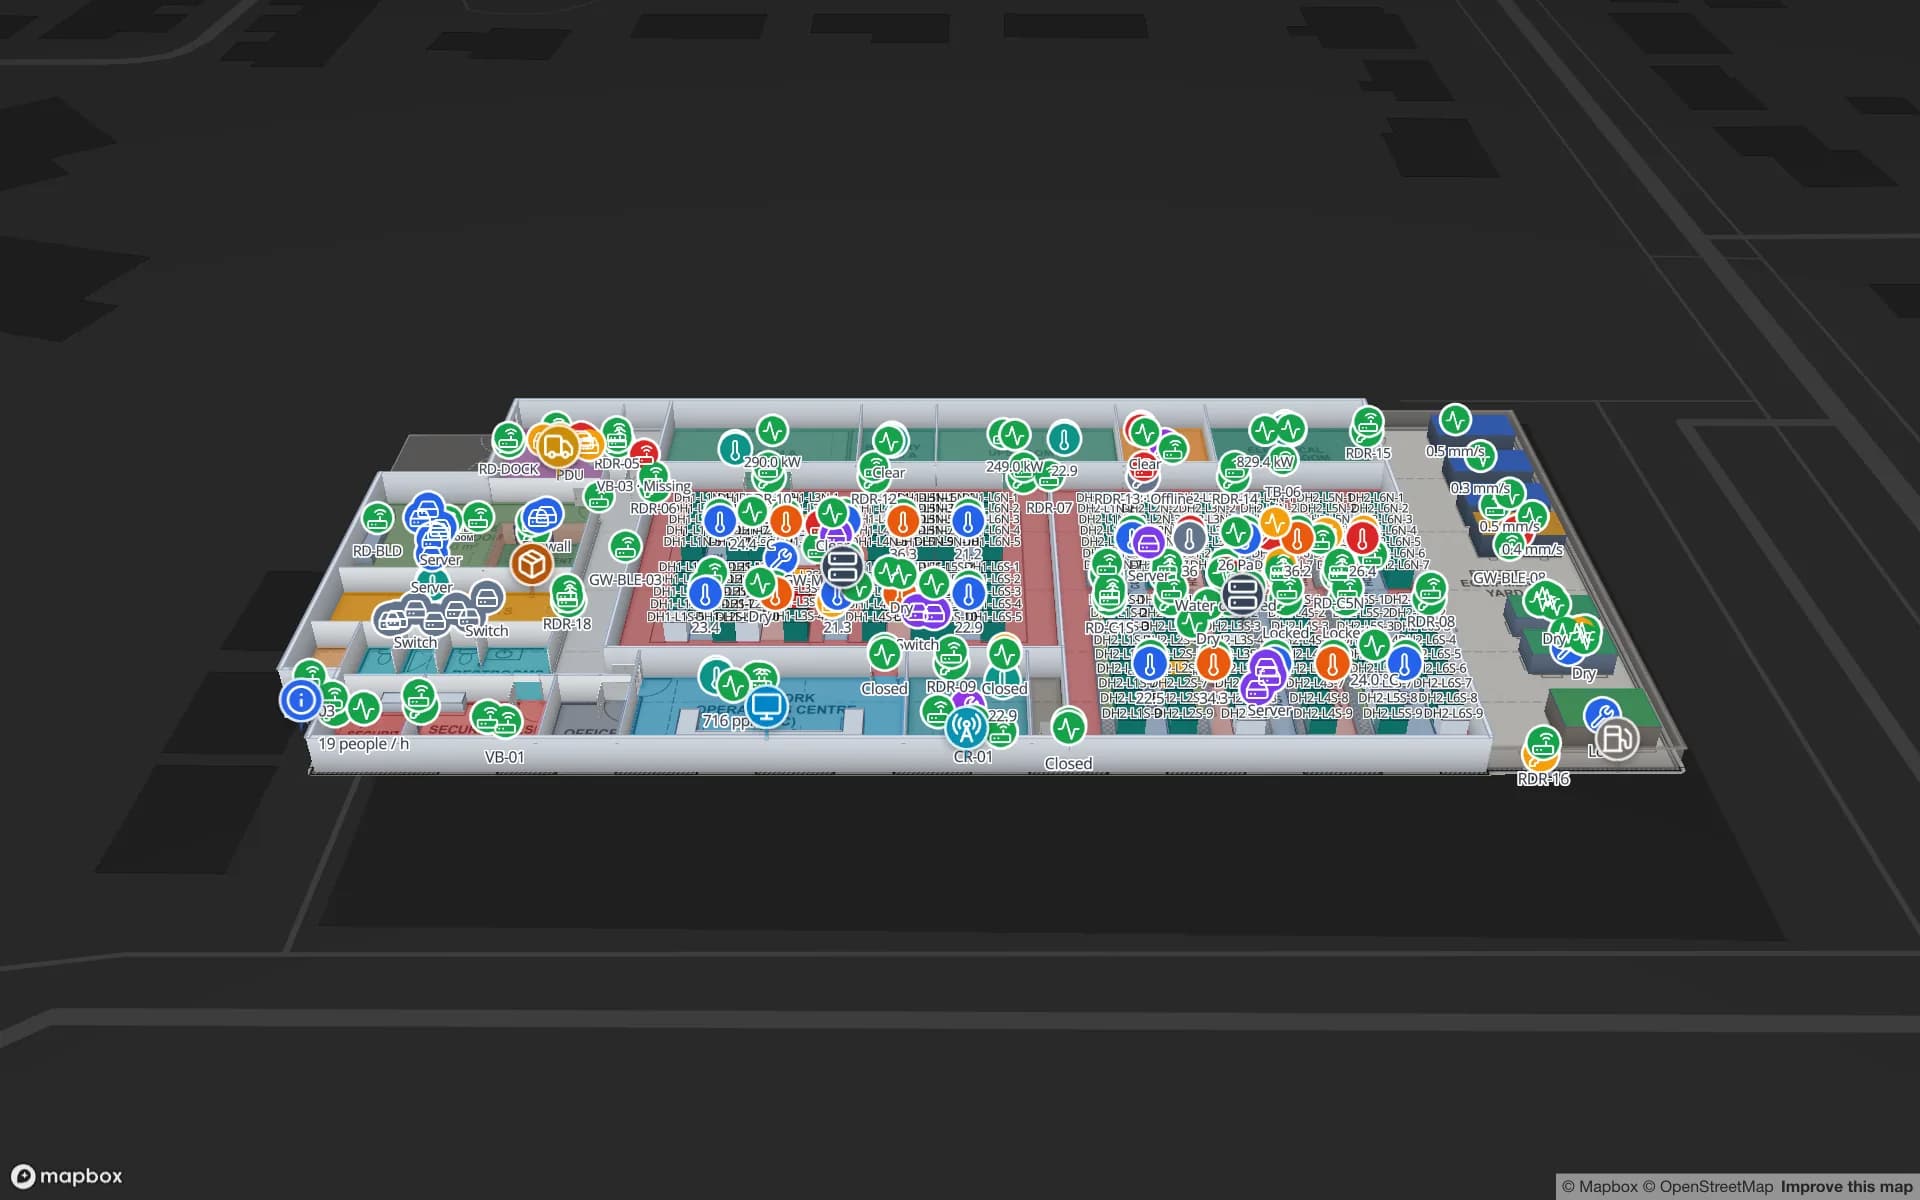
Ridgeline Data Center, a data center demo, in the Spatial Map 3D viewer with live device markers
Ridgeline Data Center
Ridgeline Data Center, a demo data hall: 24 cabinet rows drawn as racks, plant rooms, IT asset checkout, spares and environment sensors.
Cabinet rows in the Ridgeline data center demo
24
Languages in the app, including Spanish for bilingual teams
6
How often alert rules are checked, with alerts shown in the app
15 s
Free trial, up to 5 facilities, no card
7 days

Chip fabs: tools, spares and construction crews

A City of Chandler news release of September 2021 reports the groundbreaking of two new fabs that take one Chandler campus to a total of six, and gives more than 22,000 as the number of people then employed in Arizona semiconductor manufacturing. Fabs and their suppliers are asset-dense in a particular way: process spares, carts, gas and chemical cylinders, calibration kit and tools, all moving between stores, tool bays and the floor, and during construction the same is true of contractors’ equipment.

Draw each store and bay as an area, tag the items that move, and the map shows where each one was last read; an overdue-for-return rule colours items that stayed away too long. Cleanroom rules for RFID and BLE devices are set by your fab and hardware vendors, so check those before you tag anything. Spatial Map is not a manufacturing execution system and it makes no claim about cleanroom suitability. RFID tool tracking covers the crib pattern, and the Summit demo shows lines, workstations and 867 rack locations on one plant map.


Data centers: cabinets, servers and spares

CBRE reported that at the end of 2024 Phoenix’s data center inventory stood at 602.8 MW, fourth largest among the North American primary data center markets, with 176.0 MW under construction. In a data hall the assets are servers, switches, spares and the tools to change them, and each has a cabinet and a U position as an address.

The Ridgeline demo maps a data hall cabinet by cabinet, with checkout of IT assets, spares and change records. An RFID handheld walk updates the register room by room, a reader at the spares-store door catches what leaves, and the map shows each hall with its assets by cabinet. See data center RFID asset tracking and the indoor map for data centers. Your DCIM or ticketing system stays the system of record; Spatial Map shows its rows in place.

Heat is a hardware question, and the map can notice it

The National Weather Service recorded 31 consecutive days at or above 110 °F in Phoenix from 30 June to 30 July 2023, breaking a record of 18 days set in 1974. Its 2024 year in review calls 2024 the warmest year recorded in the history of the city, with 70 days at or above 110 °F, 143 days at or above 100 °F and 39 days when the temperature never fell below 90 °F.

Outdoor yards, loading bays and uncooled sheds are where tags, batteries, readers and enclosures suffer, so choose and mount hardware against its stated operating range and test it in your own site; that is a decision for your device vendor, not something Spatial Map can verify. What the map can do is notice: an alert rule set to “not updated for N minutes” raises an in-app alert when a reader or tag goes quiet, and a temperature sensor on the same plan colours the hottest bay. Warehouse temperature mapping shows the pattern.

The West Valley: new distribution parks, many forklifts

A broker release from April 2026 describes a three-building, 572,282-square-foot industrial project on 36.8 acres in the Loop 303 corridor of West Valley Phoenix, with access to Loop 303 and from there to I-10, I-17 and Northern Parkway. Buildings like that are leased in parts and run by several operators.

Assets that matter there are mobile ones: forklifts, battery chargers, trailers, floor scrubbers and returnable pallets. Asset tracking by BLE tags and gateways named after areas shows each item’s last-seen zone, and a count rule alerts when a bay has fewer forklifts than planned; the BLE gateway asset tracking post explains the design. The Crestline demo shows forklifts, racks and dock doors in a distribution building.

Services for teams in Phoenix

Phoenix teams tend to follow three starting points:

Also served nearby

The same page covers Chandler, Mesa, Tempe and Gilbert in the East Valley, and Glendale, Goodyear, Surprise and Buckeye in the West Valley.

How Spatial Map does it

Building a Phoenix asset map

  1. 01

    Load the asset register

    Upload a CSV or Excel list of assets with tag IDs, owners and home locations as a table.

  2. 02

    Map the buildings

    Import each plan, align it and draw stores, bays, halls and cabinets as areas named like your readers and gateways.

  3. 03

    Connect reads and positions

    RFID middleware, BLE gateways and your own systems post rows through the write API or a polled REST endpoint.

  4. 04

    Add overdue and silence rules

    In-app alerts for assets overdue at a borrower, bays short of equipment and tags or readers that stop reporting.

What Phoenix teams track

Data hall IT assets

Servers and spares by cabinet, with checkout and an environment overlay.

Fab and plant tooling

Tools, carts and spares by store and bay, with overdue returns coloured.

Forklifts and trailers

Mobile equipment with last-seen zones in distribution buildings and yards.

Campus and office equipment

Shared equipment and check-out across floors.

See it on real demo facilities

Fictional names, real floor plans, live sensors, RFID, BLE tags and gateways — open any of them in the browser.

All 13 demo facilities

Asset tracking in Phoenix — questions we get

That depends on the hardware and how it is mounted, so check each product’s operating range and test it on your site, especially outdoors and in uncooled buildings. Spatial Map does not make hardware; it shows an in-app alert when a reader or tag stops reporting.

Spatial Map is software in a browser, so it does not touch the cleanroom. Whether a tag or reader may be used inside is decided by your fab and the device vendor, and the software makes no claim about it.

No. It shows rows from your DCIM, CMDB or asset register on the building, by hall and cabinet. Data comes in through uploads, a polled REST endpoint or the table write API, and nothing is written back.

With BLE gateways it shows each tag’s last-seen area, which is zone-level, not exact coordinates. For continuous positions you need an RTLS; a BlueIOT server connects directly, and Spatial Map never computes positions from BLE signal strength itself.

No. Spatial Map is sold online and our team works with customers in the United States remotely, by video call and through the contact form. There are no local resellers or partners.

In US dollars, the same worldwide: a 7-day free trial for up to 5 facilities with no card, then Pro at $60 a month or $600 a year for up to 4 facilities. Tags and gateways we source are quoted per project.

Map one Phoenix building before the next summer.

Start the free trial and open the Ridgeline demo, or send us a floor plan and your asset register through the contact form.