Features · Heatmaps

Indoor heatmap software that keeps the heat inside the room

Spatial Map is indoor heatmap software that turns any point layer on a facility map — RFID reads, BLE tag positions, footfall counters, stock rows — into a heatmap on the floor plan. The heat spreads along open floor and stops at walls and closed doors, so a busy room never bleeds into the quiet one next to it. Switch it on in the facility viewer or on a report map; nothing extra to set up.

Last updated:

No credit card. Runs in the browser. Pro is $60/month for up to 4 facilities. Book a demo

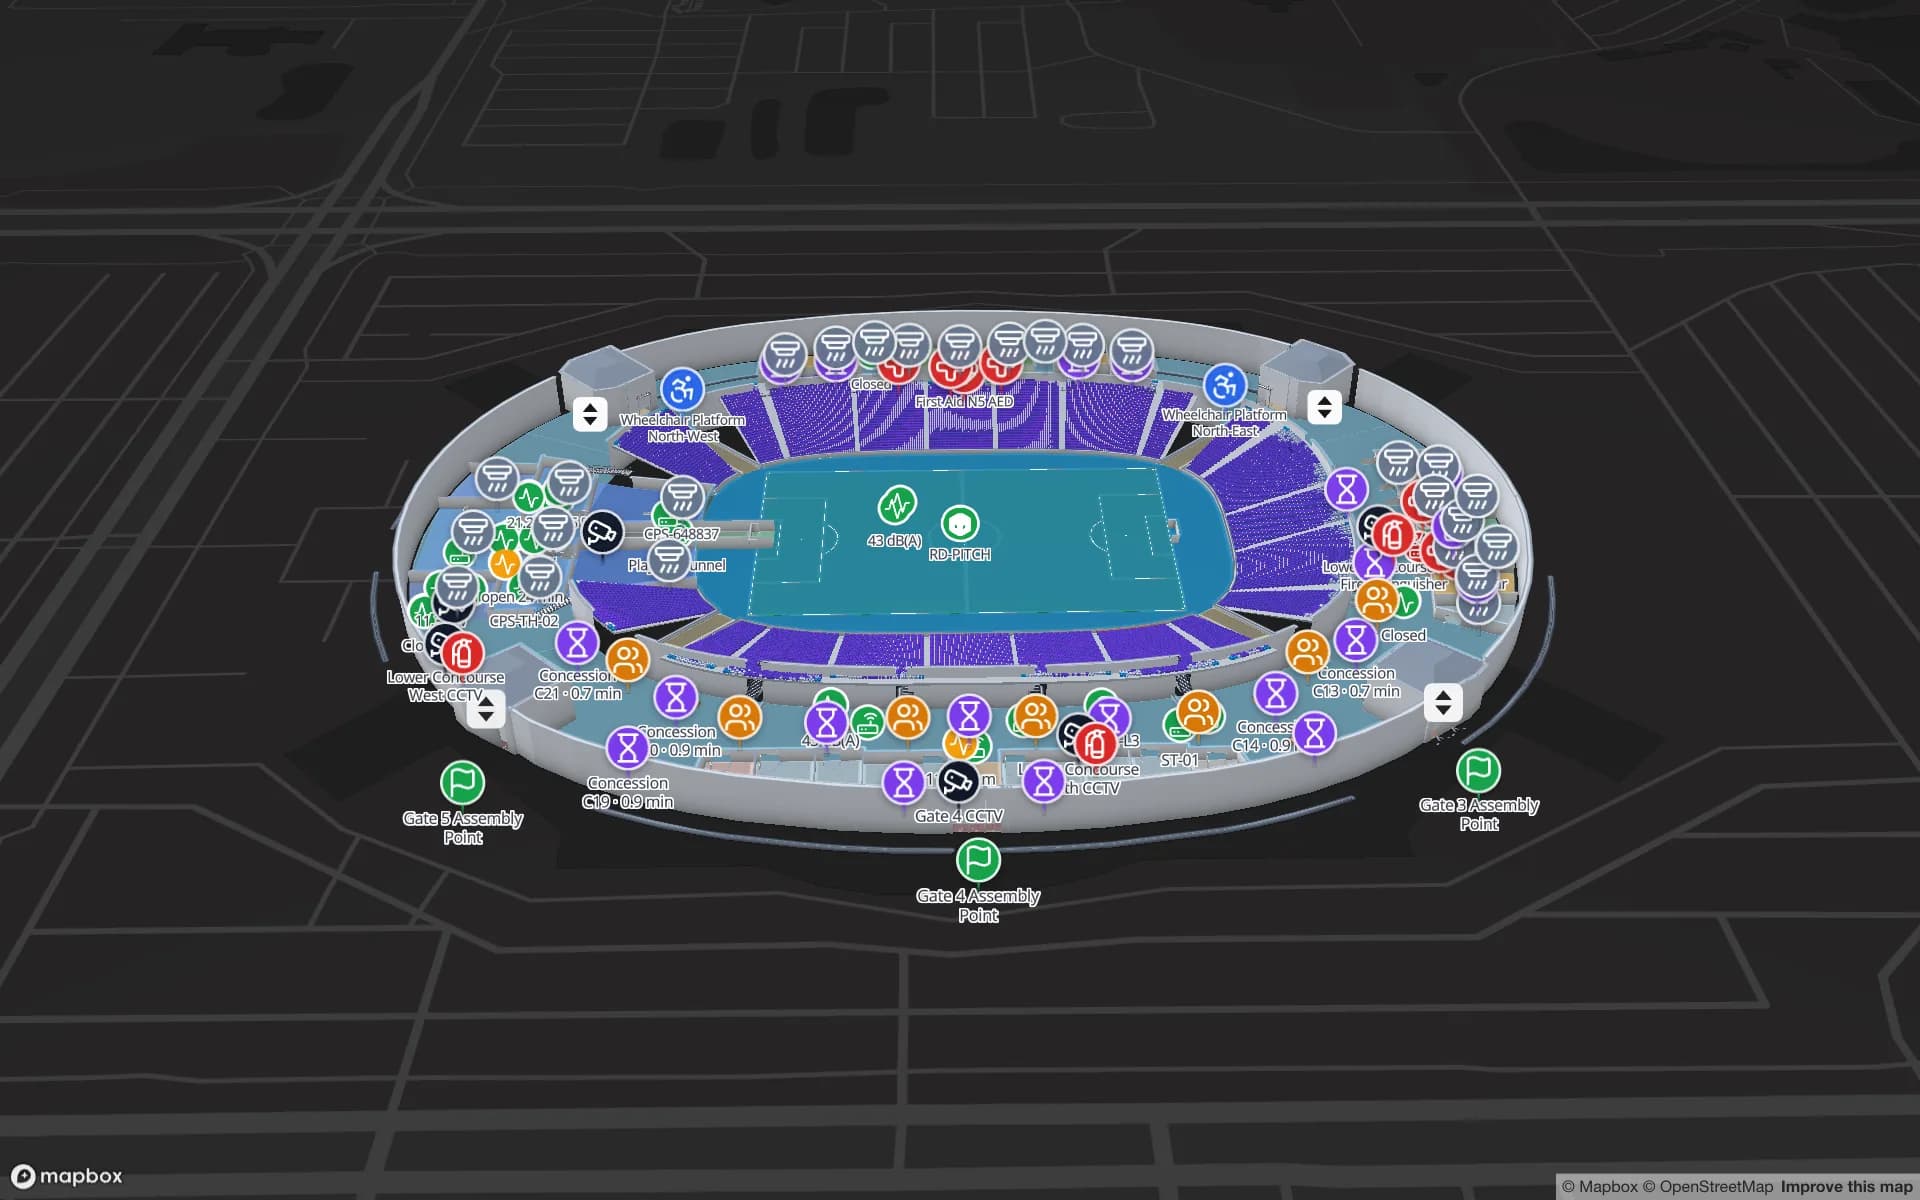
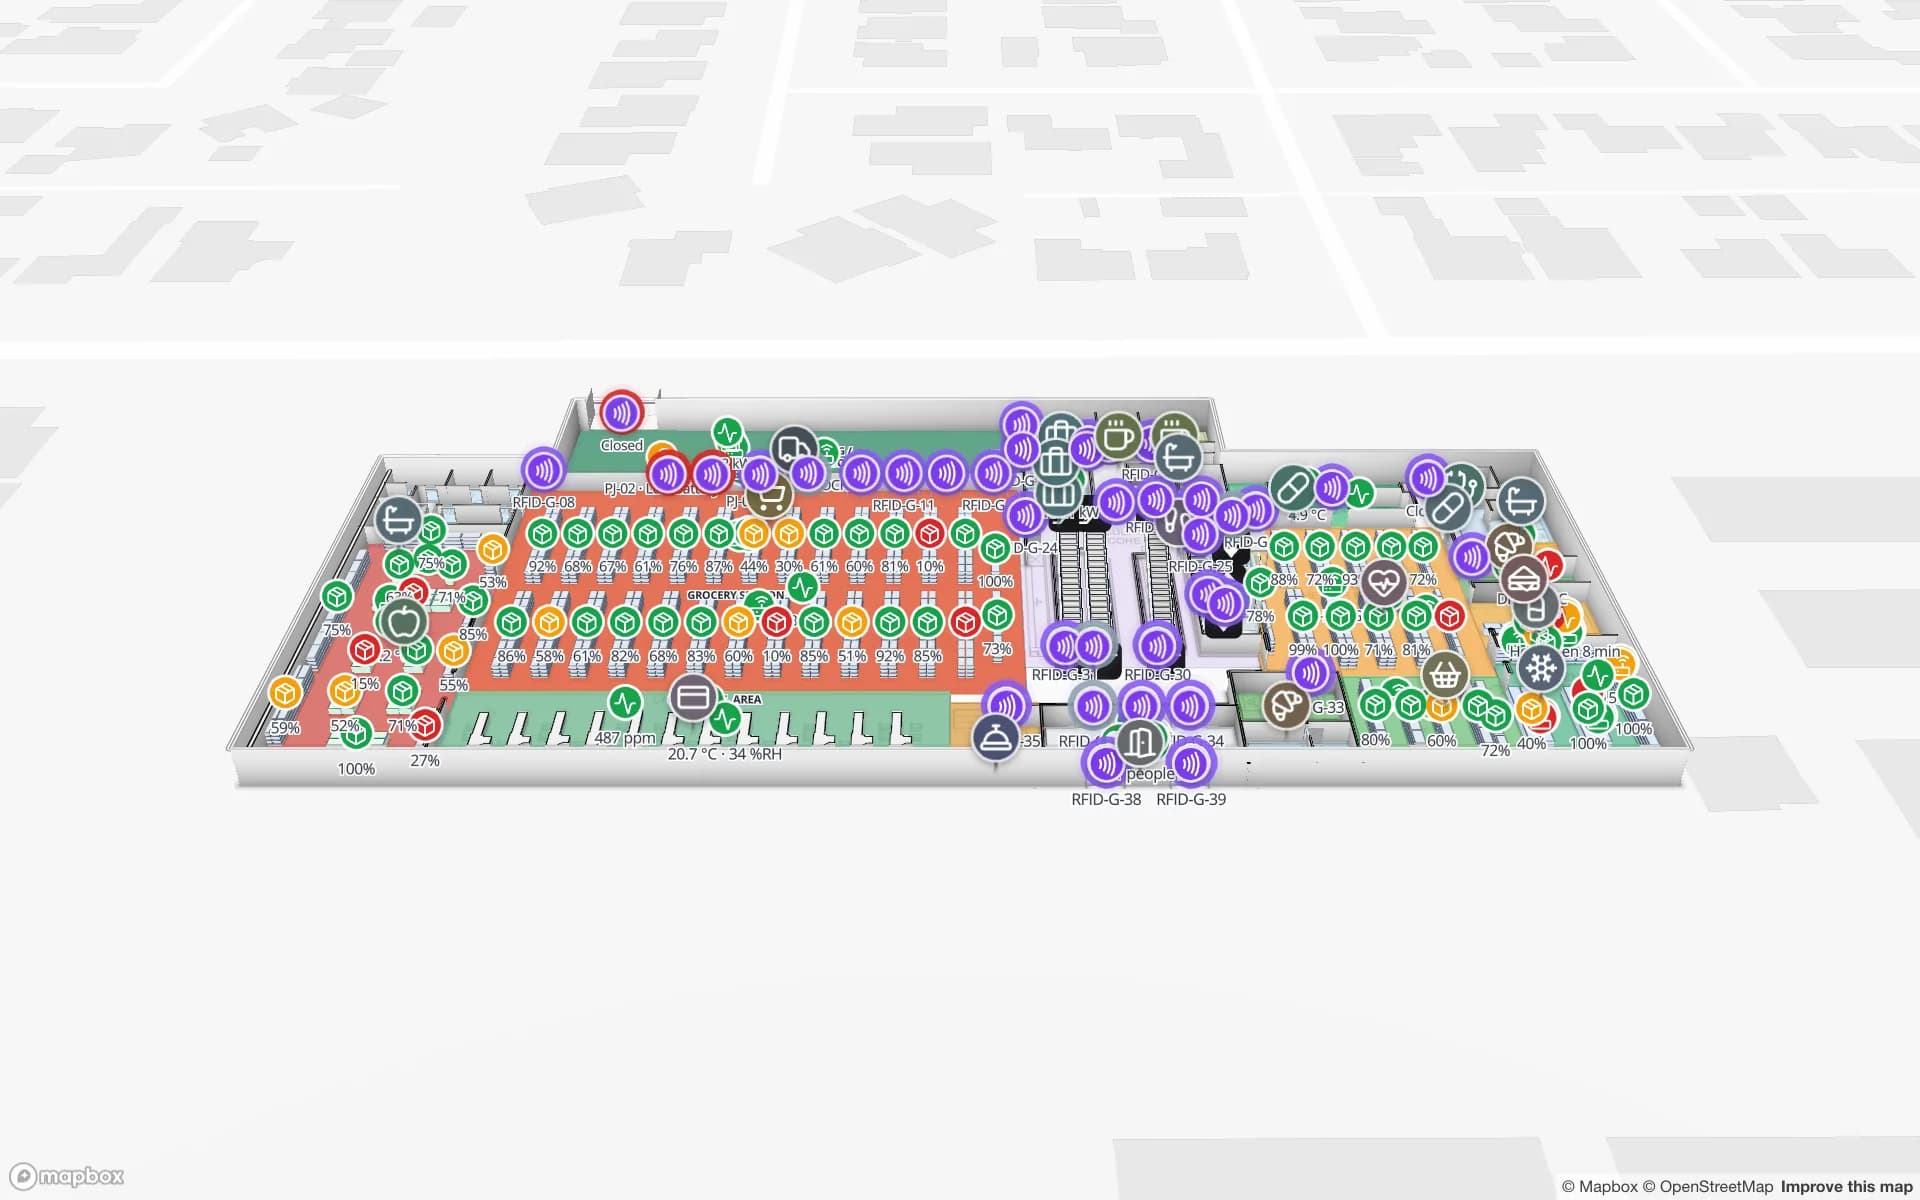
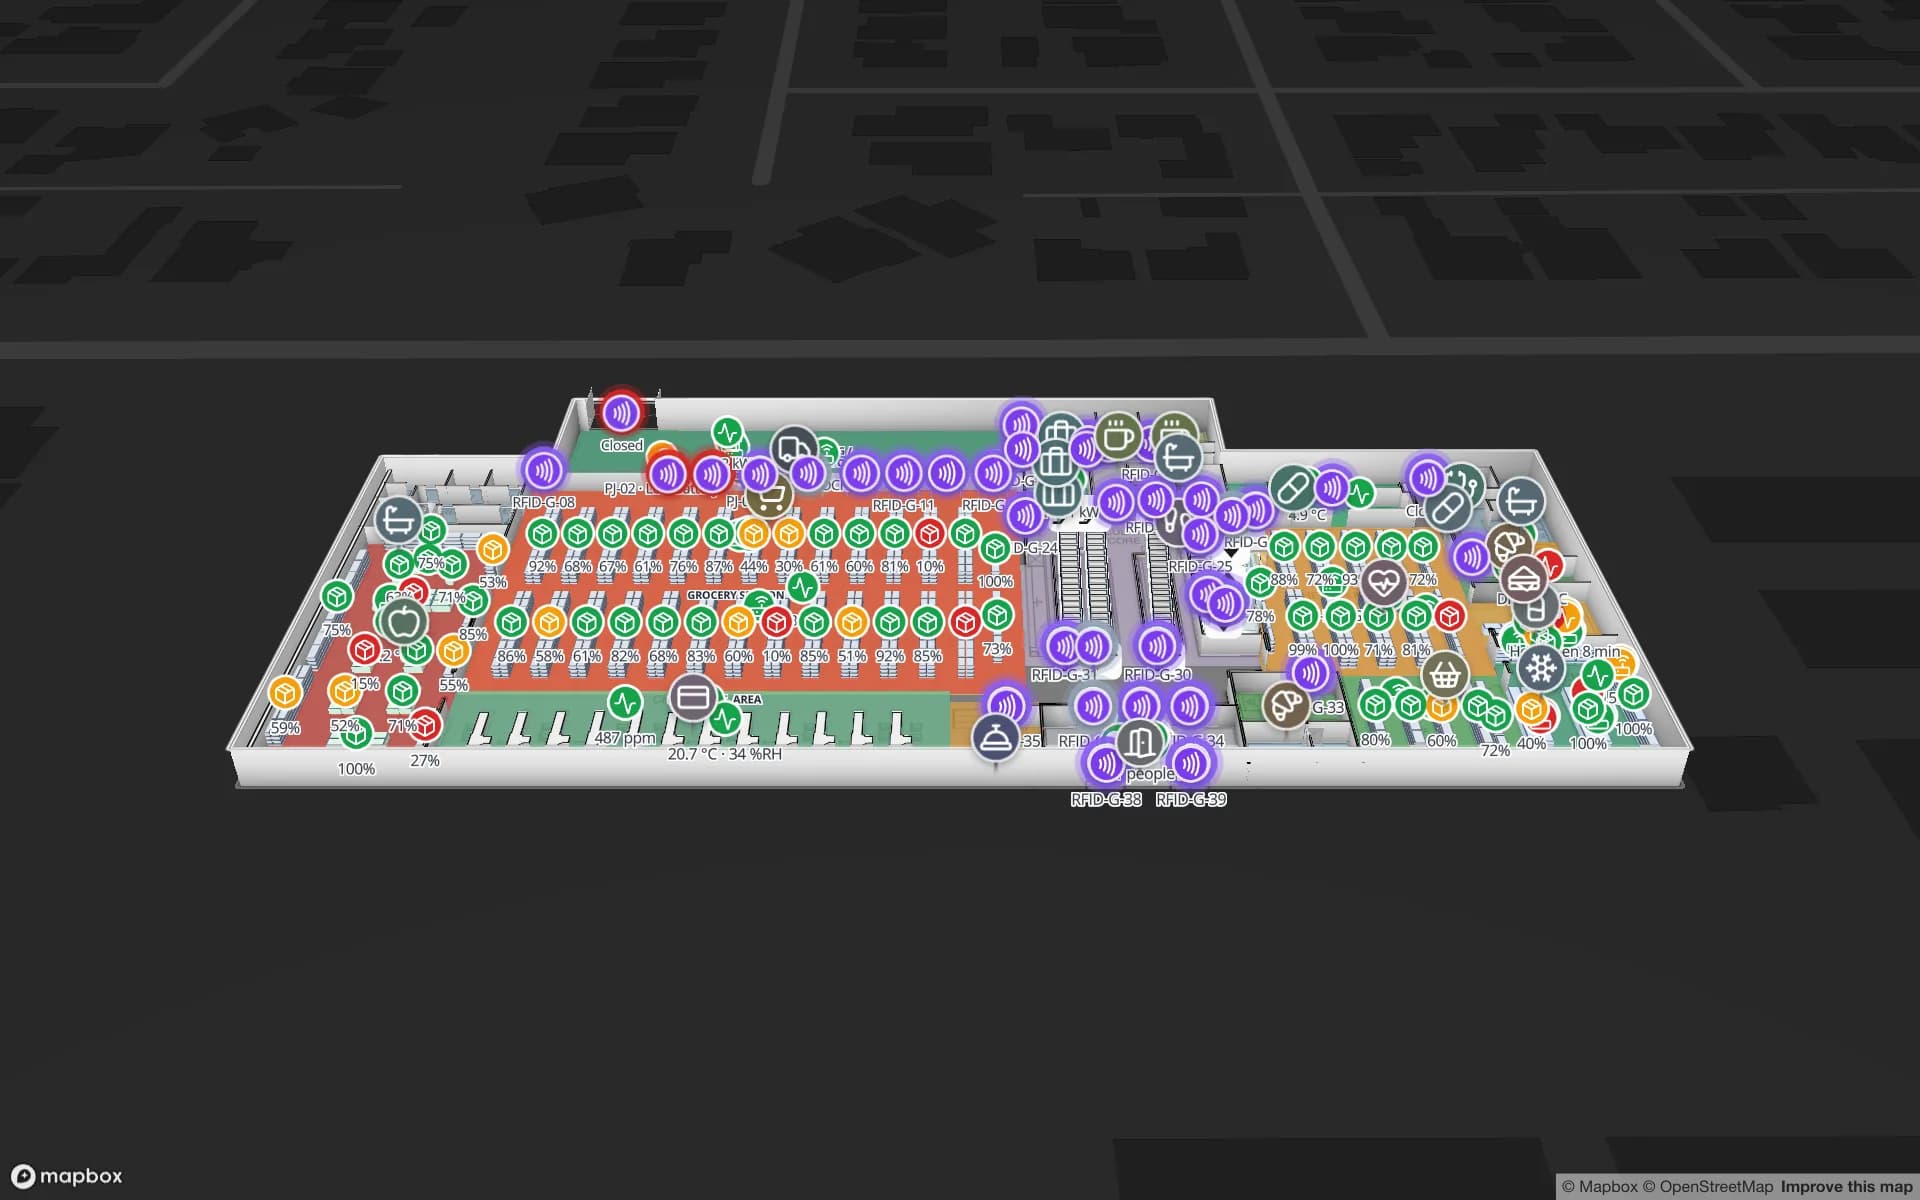
Retail Mart Store, a three-floor retail store demo, in the Spatial Map 3D viewer with live device markers
Retail Mart Store
Retail Mart (demo): three floors with RFID readers at every door — a reads layer like this one can be drawn as a heatmap, one floor at a time.
Modes: heatmap and items, or heatmap only
2
Floor at a time, so stacked floors never blur
1
Demo facilities to explore
13
Free trial, no credit card
7 days

Any point layer becomes a heatmap

If a layer puts dots on the map, it can be a heatmap. Open the Heatmap menu in the viewer or on a report map and choose a mode:

  • Heatmap and items — where items gather glows, and the markers stay on top so you can still click one.
  • Heatmap only — just the density; the markers are hidden.
  • Off — items are drawn as markers again.
Several layers, each in its own colour

Under Layers, tick the point layers you want: each ticked layer glows in its own colour, and ticking one never recolours another. Pickers and forklifts, or staff badges and visitor counts, can sit on the same floor and still be told apart.

With one layer ticked you can also set the Weight: by Number of items, or by any number field of the layer’s table — quantity on hand, people counted, minutes waited. Weighting by a number works with one layer at a time.

Heat that respects walls and doors

A plain heatmap draws circles on a picture, so a crowded aisle smears through the wall into the office behind it. Spatial Map spreads the heat along the floor you drew: it stops at walls, racks and other solid objects, passes through open doorways and is shut out by closed doors. The heat is where the items are, room by room.

Tilt the map into 3D and the heat stays honest there too: parts of it behind a wall, a rack or a floor slab are hidden from that angle, like the markers are. A heatmap shows one floor at a time — with several floors stacked, the viewer asks you to pick one.

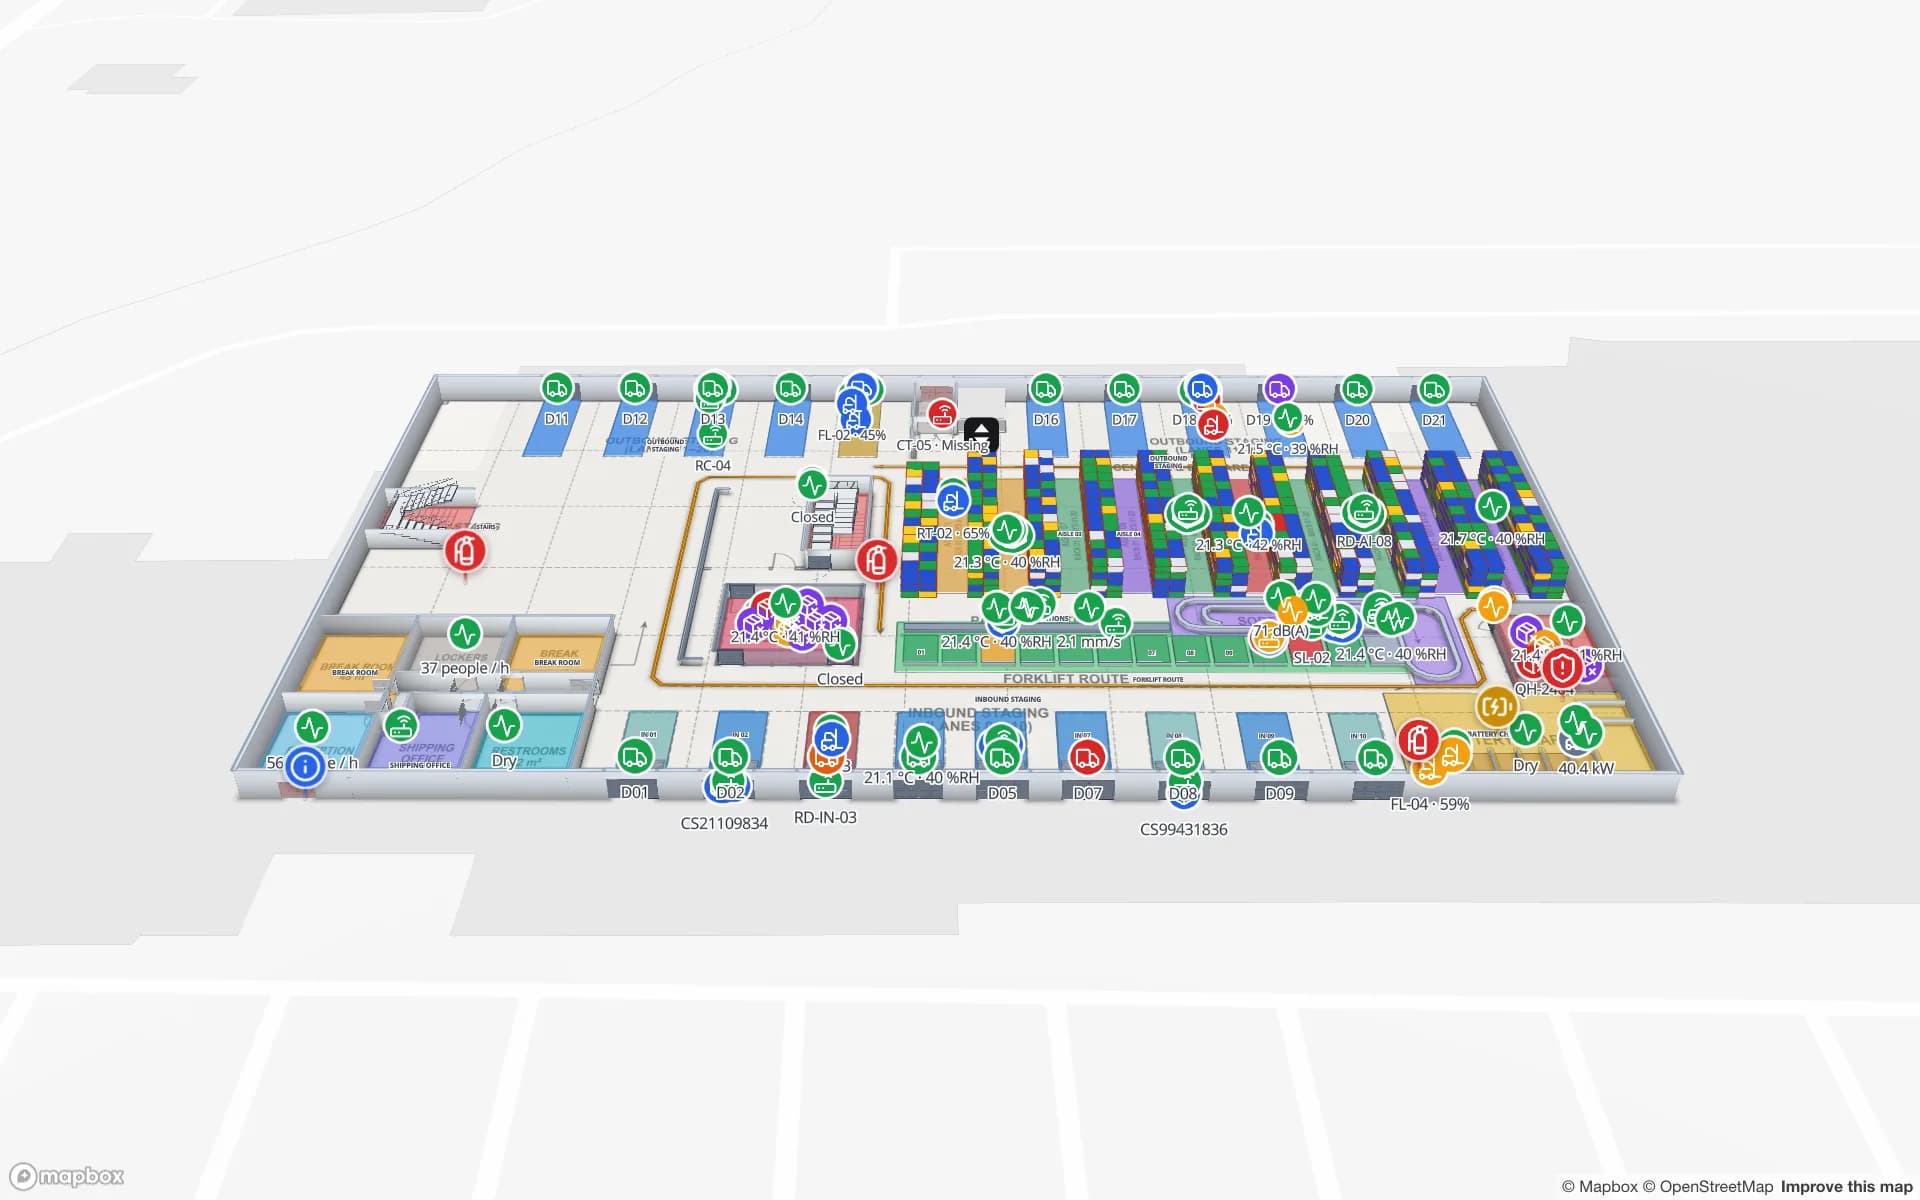
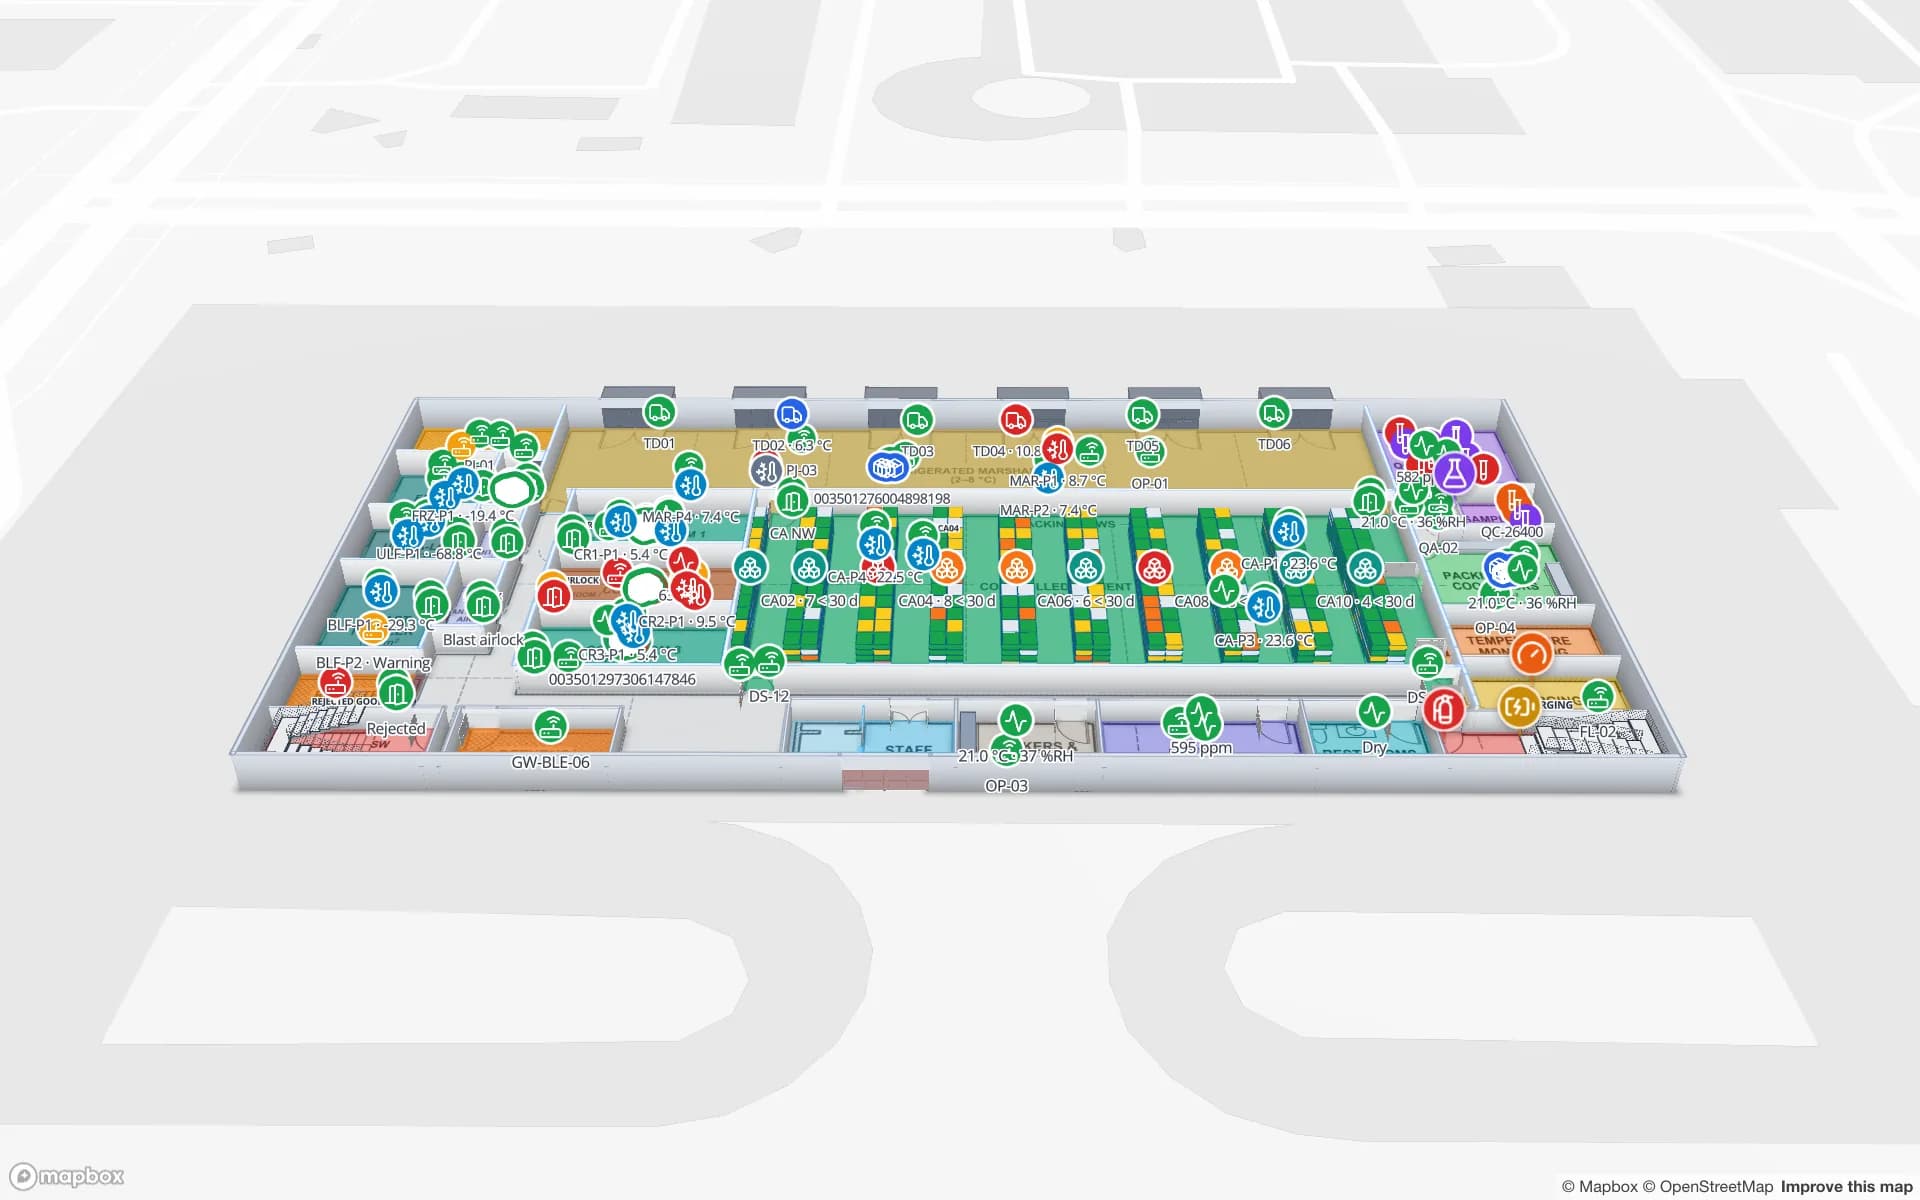
Crestline Fulfillment Center in 3D with every rack location coloured full, OK, low, empty or blocked, and a blocked location highlighted in red
Crestline Fulfillment Center
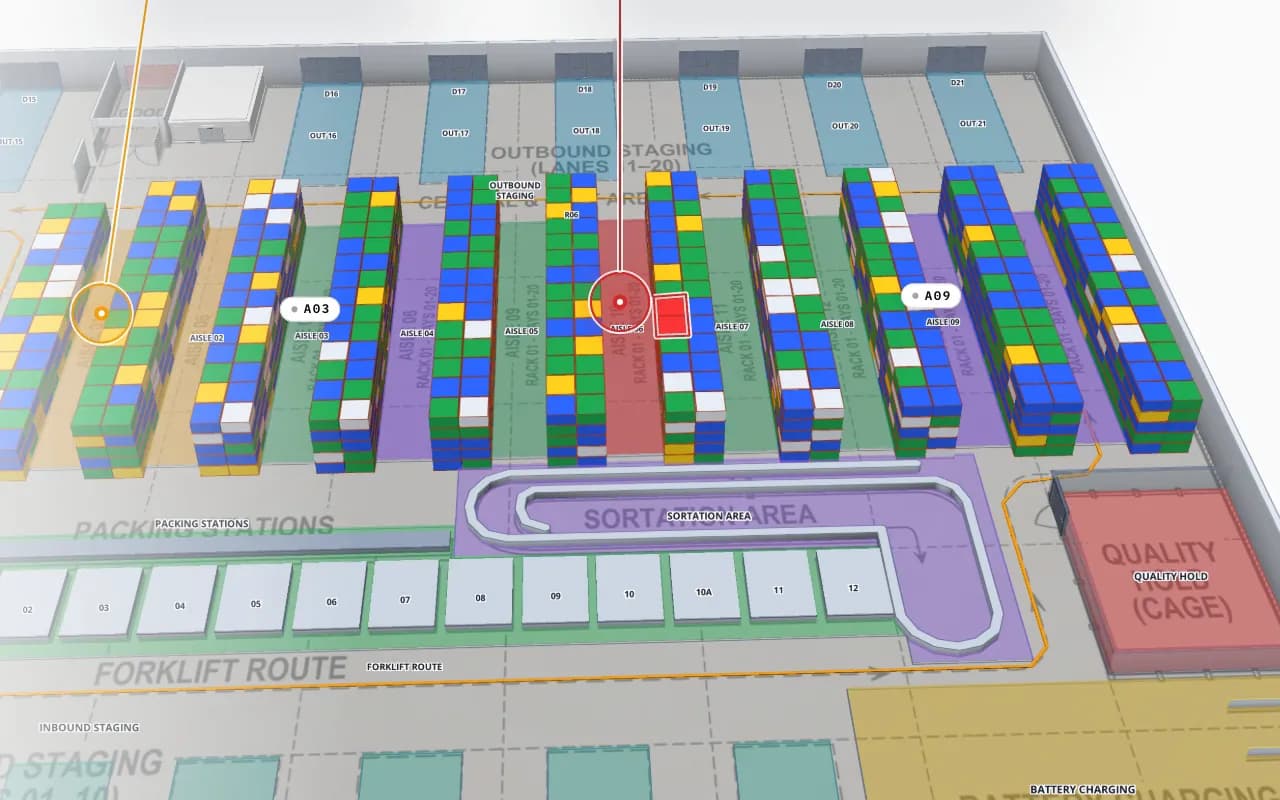
Crestline Fulfillment Center (demo): racks and aisles drawn as solid shapes — the walls and racks a heatmap of picks or reads stays between.

In the viewer and in reports

The heatmap is in the read-only facility viewer, next to the Live and Cluster views, and on every report map — the facility map & list and full-map reports. The setting is kept in the page address, so a copied link opens with the same heatmap, layers and weight.

For a heatmap that is always on, a data link can use the Heatmap of activity mode instead, with density from live rows or from change history over the last hour up to the last 30 days (heatmap density).

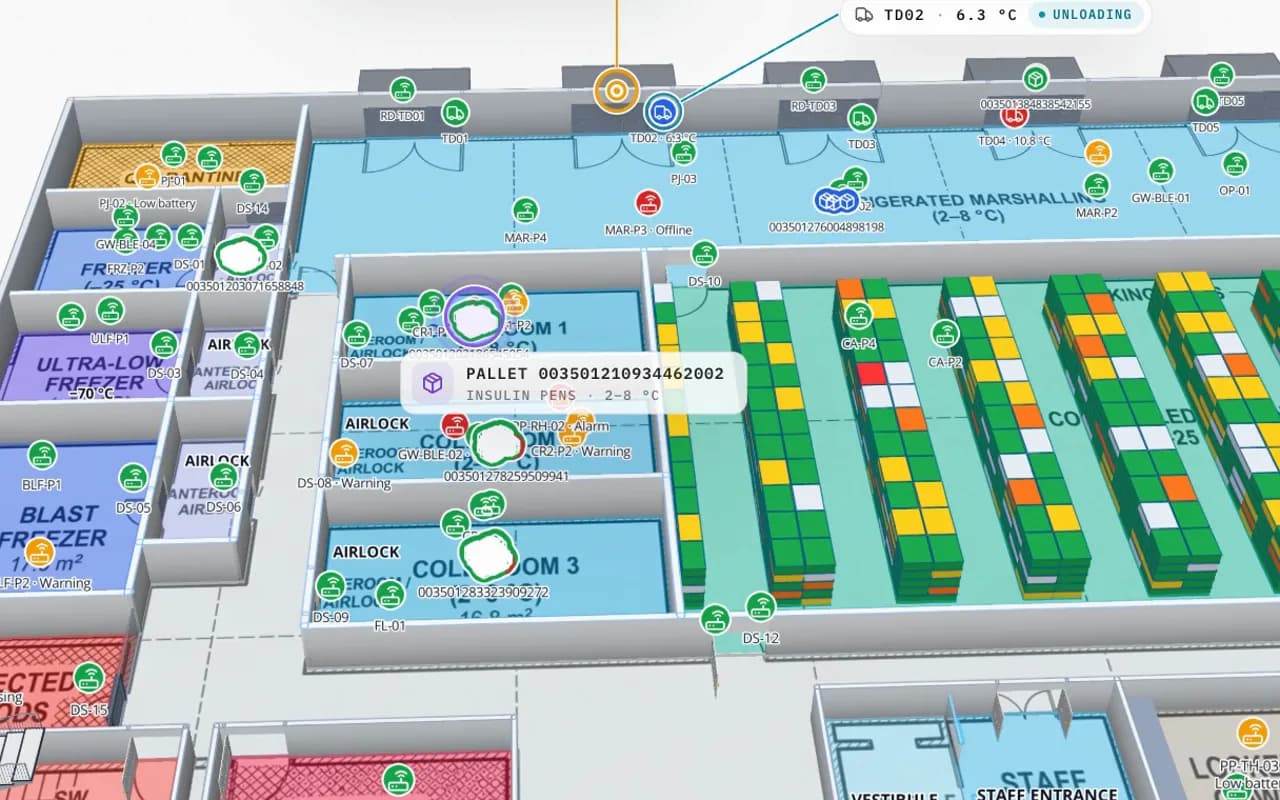
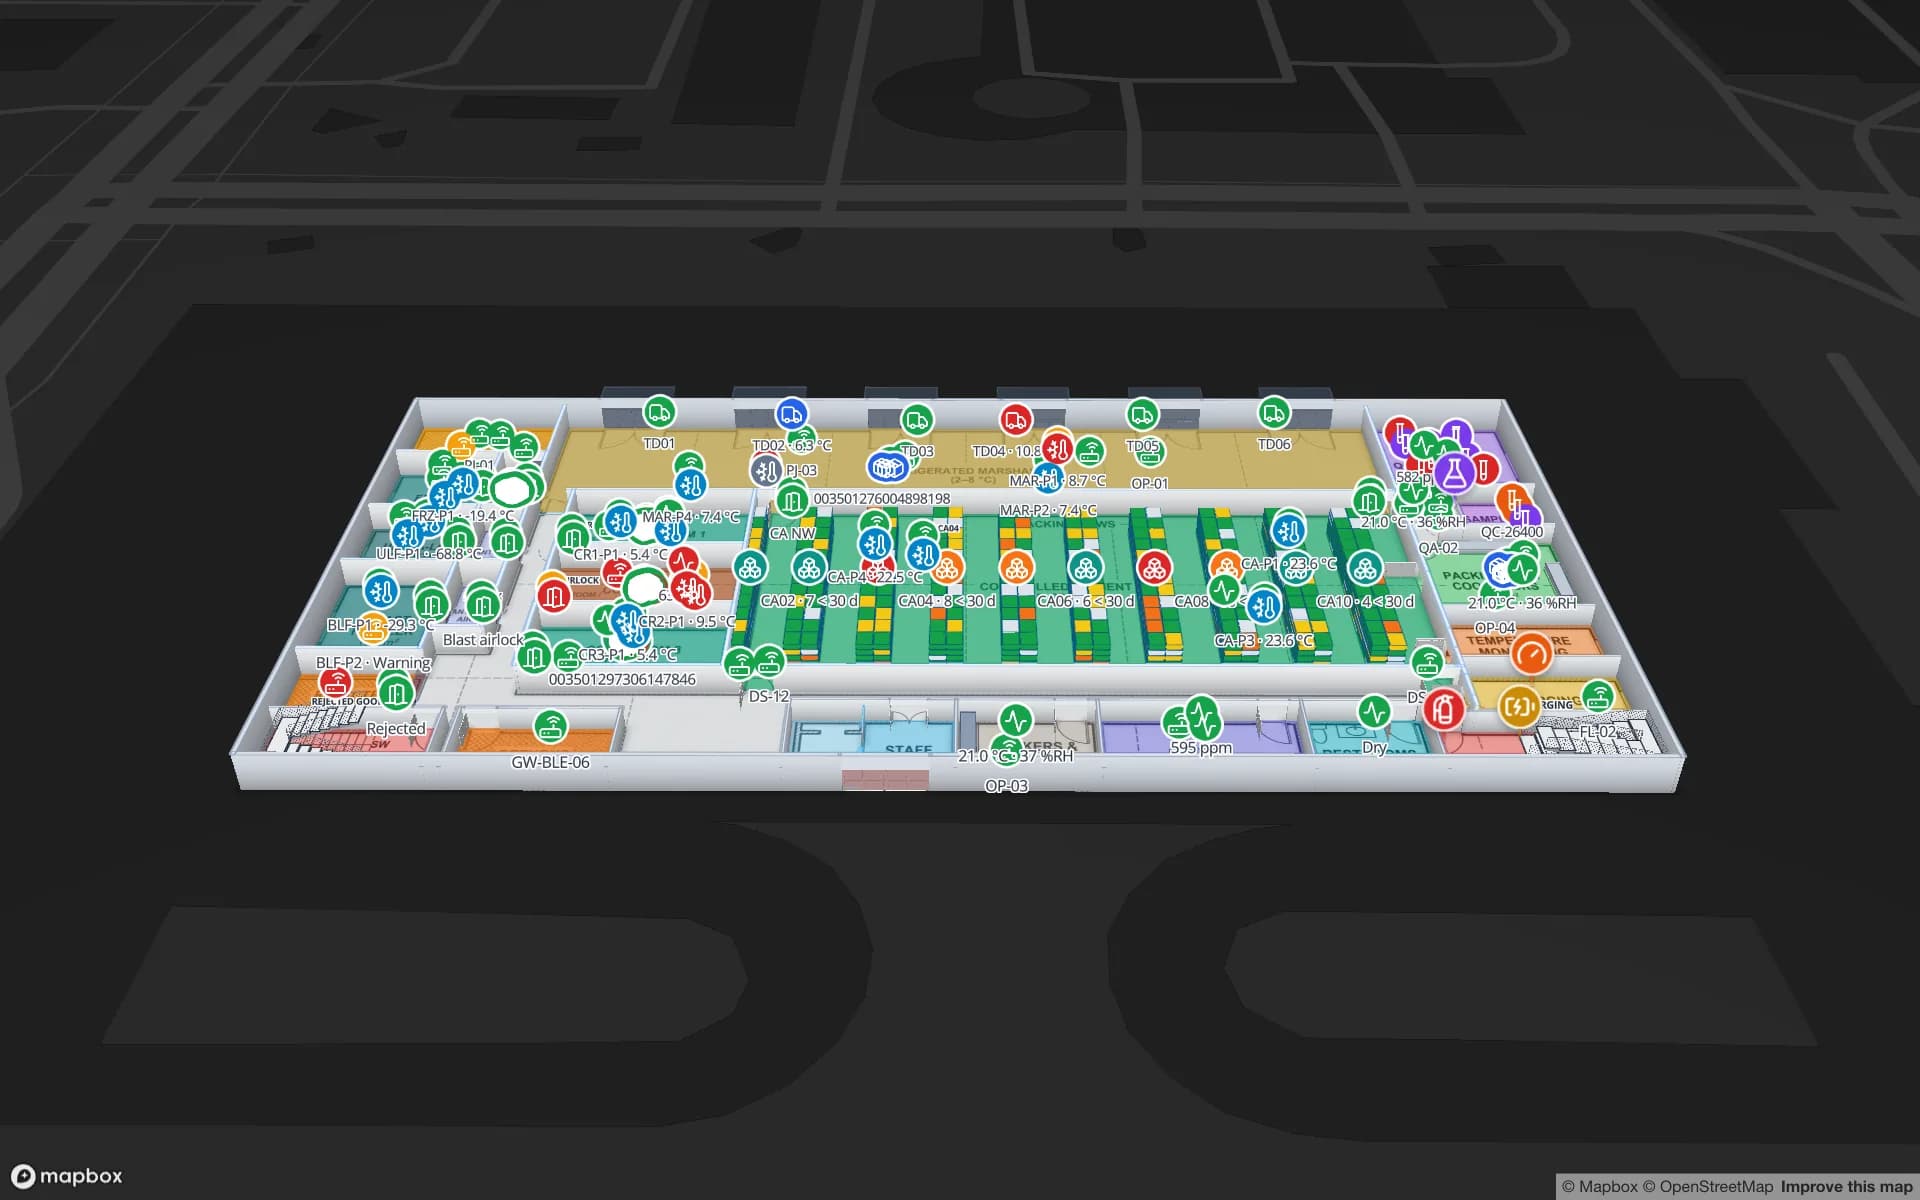
Polar Pharma cold store in 3D: cold rooms, freezers and pallet locations coloured by status, with an insulin pallet and a dock-door reading called out
Polar Pharma — Cold Storage & QC Facility
Polar Pharma (demo): cold rooms and freezers with temperature probes and pallet reads — point layers that work as a heatmap per room.

Where the dots come from

Spatial Map draws what your systems report; it does not count people or compute positions itself. RFID reads land at the reader that saw them, BLE positions come from your RTLS or gateway software, footfall comes from your people counters, and stock rows sit on their rack cells. Each arrives in a table through a REST source, a file upload or the table write API. See RTLS software for how position data gets onto the map.

How Spatial Map does it

A heatmap on your floor plan in four steps

  1. 01

    Map the floor

    Import the floor plan and draw walls, doors and racks — they are what the heat stops at.

  2. 02

    Bring in a point layer

    Link a table of reads, tag positions, counts or stock to the map with a data link.

  3. 03

    Open the Heatmap menu

    In the viewer or on a report map, pick Heatmap and items or Heatmap only, then tick the layers.

  4. 04

    Weight and share

    Weight one layer by a number field, pick the floor and copy the link — it opens with the same heatmap.

What teams use heatmaps for

Warehouse pick density

Pick or read rows weighted by quantity show which aisles work hardest, rack by rack.

Footfall and crowds

People-counter rows by entrance or zone show where visitors gather and which gates back up.

Temperature and occupancy

Probe or occupancy readings weighted by value show warm corners and busy rooms without bleeding through walls.

Dwell

A table with a minutes-waited field, used as the weight, shows where pallets or trailers sit longest.

See it on real demo facilities

Fictional names, real floor plans, live sensors, RFID, BLE tags and gateways — open any of them in the browser.

All 13 demo facilities

Indoor heatmaps — frequently asked questions

Any point layer on a Spatial Map facility map: RFID reads, BLE tag positions, people-counter rows, sensor readings or stock rows on rack cells. If a layer draws dots, the Heatmap menu can turn it into density.

Yes. The heat spreads along open floor and stops at walls, racks and other solid objects. It passes through open doorways and is blocked by doors marked closed, so a busy room does not colour the room behind its wall.

Yes. Tick several layers under Layers in the Heatmap menu and each glows in its own colour. Weighting by a number field works when one layer is ticked.

No. A heatmap shows one floor at a time, because stacked floors would blur together. With several floors stacked, the viewer asks you to pick one.

No. It draws the counts and positions your people counters, RFID middleware or RTLS software report. Those systems write rows to a table; the heatmap is drawn from the rows.

A 7-day free trial covers up to 5 facilities with no credit card. Pro is $60 a month or $600 a year for up to 4 facilities. Mapping, integrations and custom features are quoted as custom services.

See where things gather, room by room.

Start a free trial and open a demo facility’s viewer, or send us your floor plans and data and we will set up the layers for you.