Europe · EU

Indoor mapping and RFID tracking software for Europe

Europe’s plants, distribution centres and cold stores sit on some of the densest supply networks in the world, and many of them already run RFID, BLE or sensor hardware that nobody sees on one screen. Spatial Map turns their floor plans into live 3D maps in the browser — in English, German, French or Spanish — fed by the devices and systems you already have.

No credit card. Runs in the browser. Pro is $60/month for up to 4 facilities. Book a demo

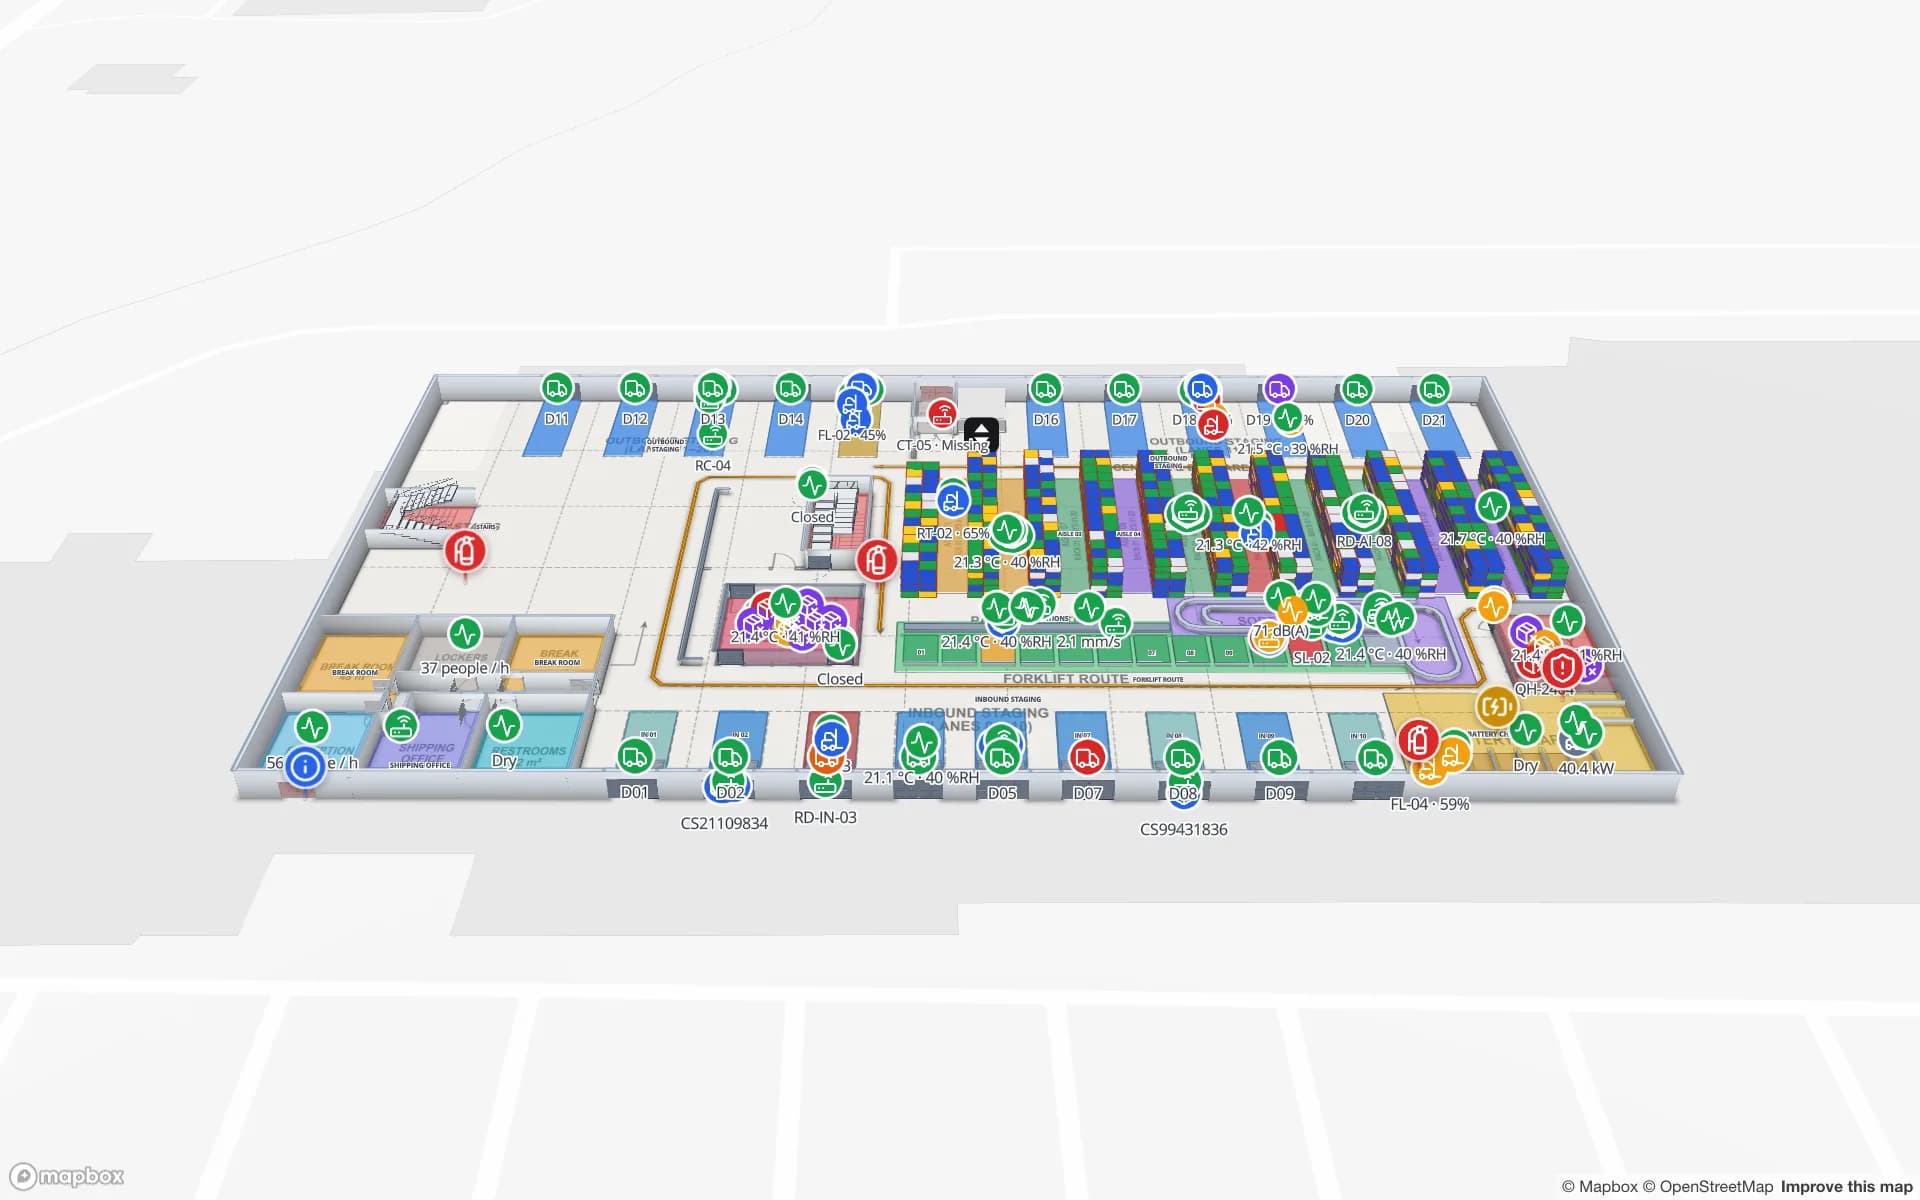
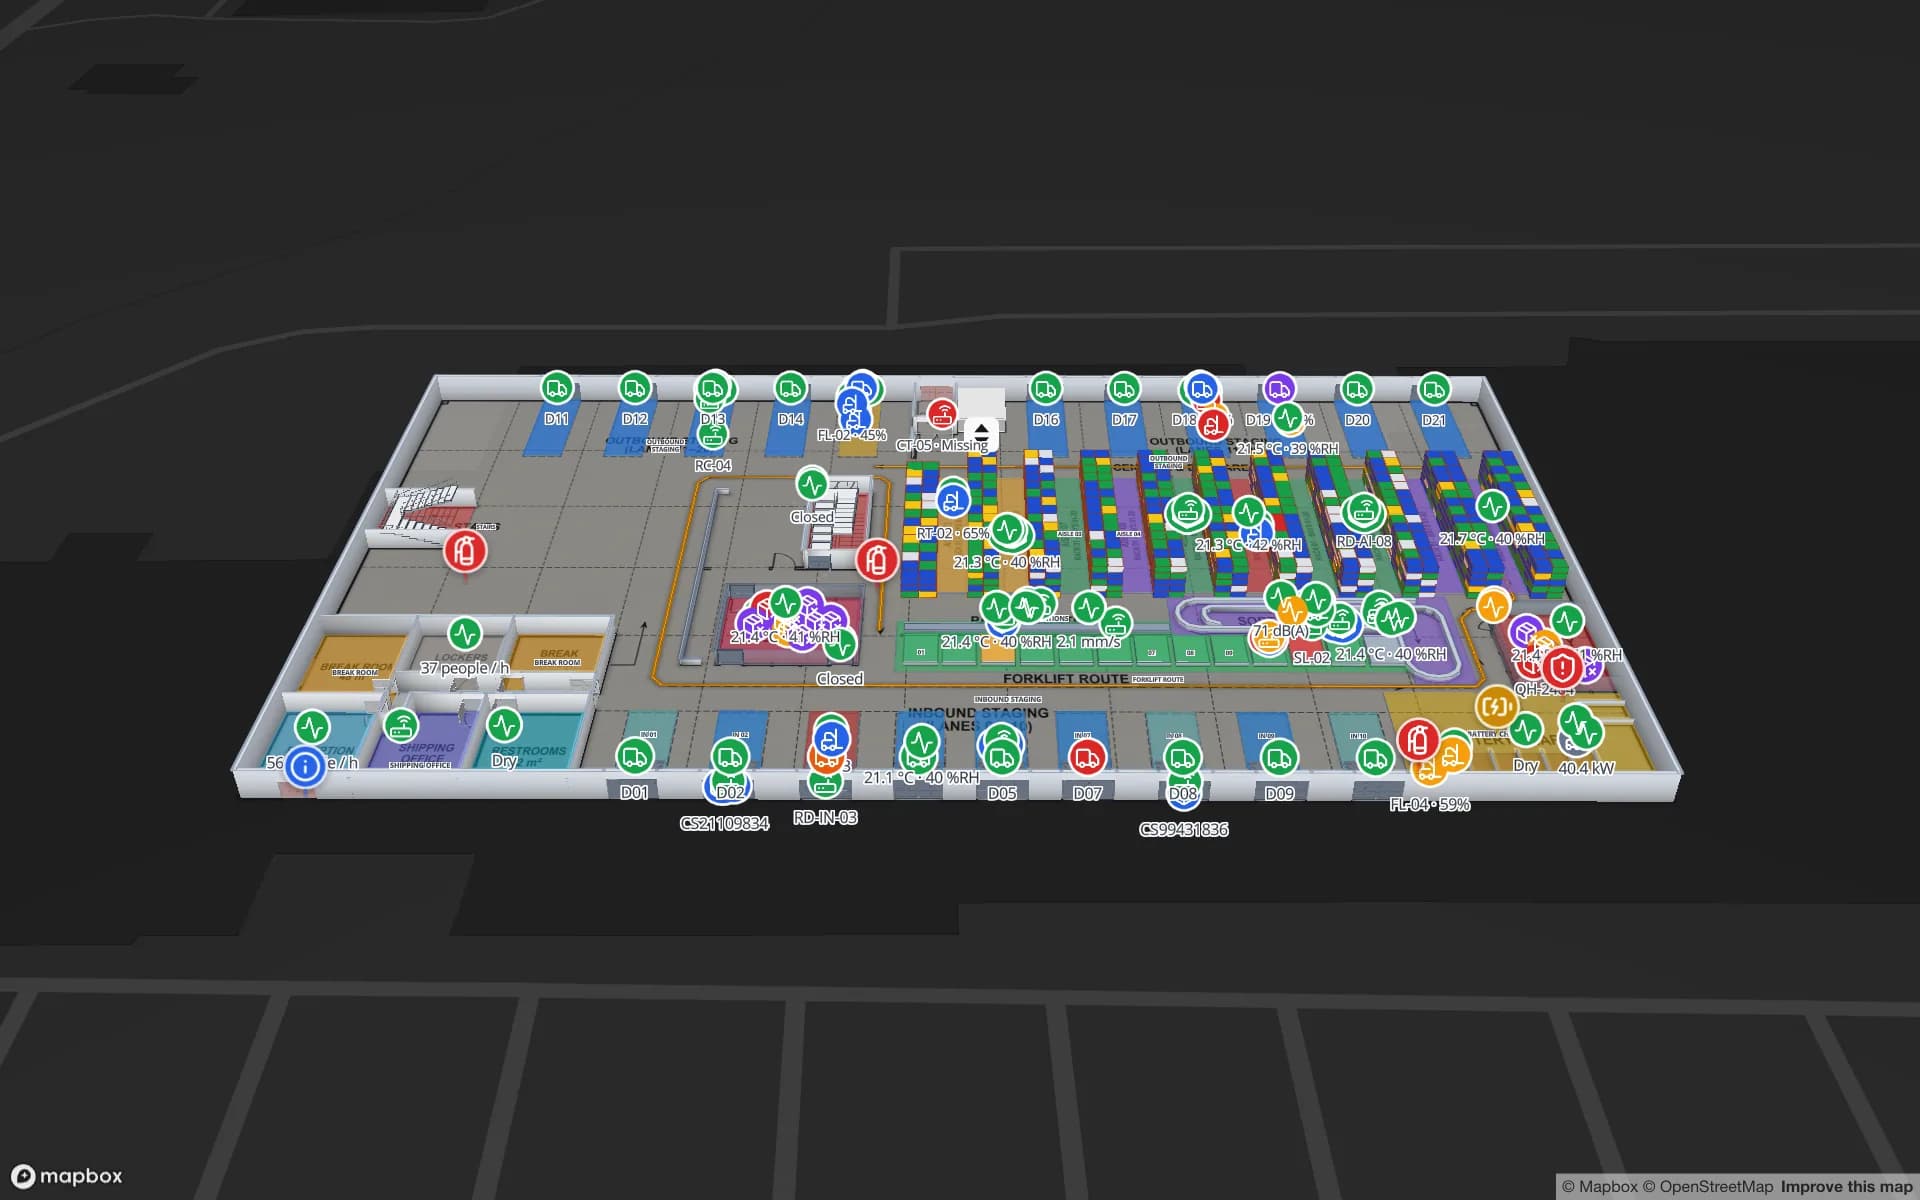
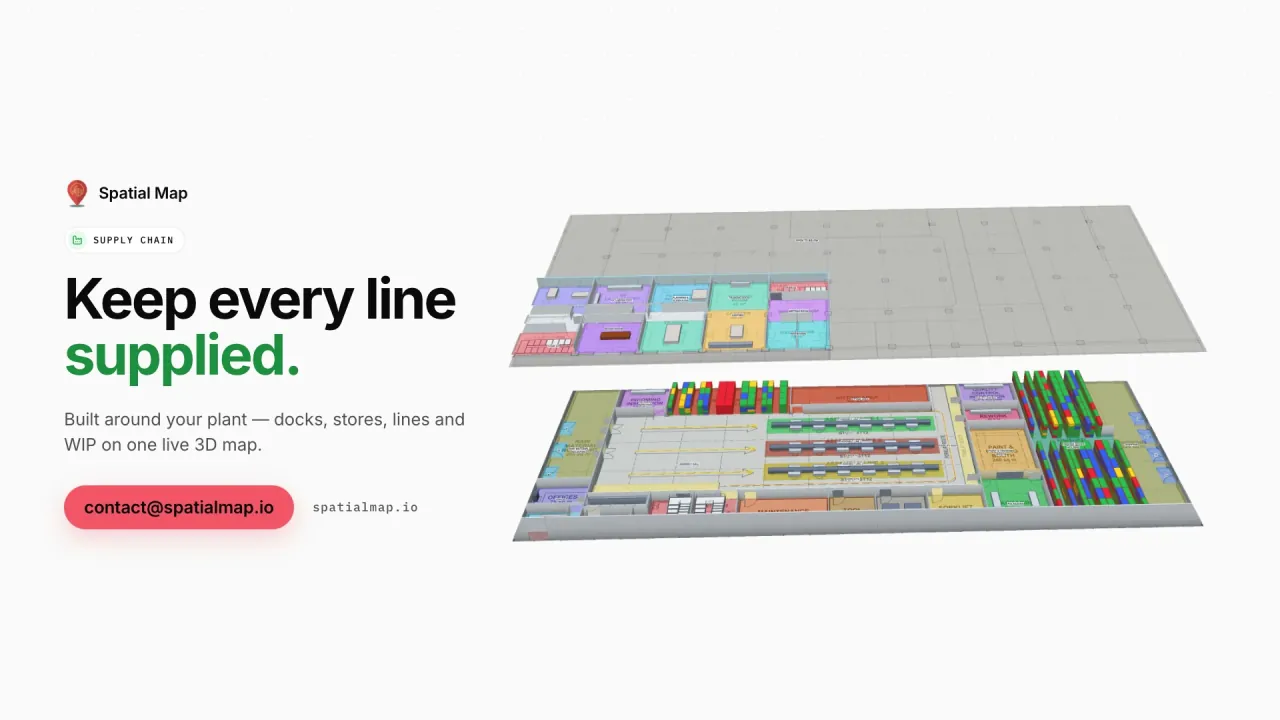
Supply Chain film: “Keep every line supplied” beside the floors of Summit Assembly Plant in 3D
The Supply Chain film: Summit Assembly Plant with 3 assembly lines, 7 docks and 351 RFID WIP carriers, and a held lot traced to the line it starves.
European interface languages, plus Arabic and Chinese
EN · DE · FR · ES
Demo facilities to explore in the browser
13
Software to install — runs in any modern browser
0
Free trial, up to 5 facilities
7 days

Industry 4.0 on the shop floor, not just in the strategy deck

Industrie 4.0 began as a German initiative and has become the shared European vocabulary for connected production: machines, carriers and materials that report their state, and planners who can see it. In practice many plants already have the data — RFID on WIP carriers, BLE tags on tools and forklifts, MES and WMS tables — but it lives in separate systems with no picture of the building.

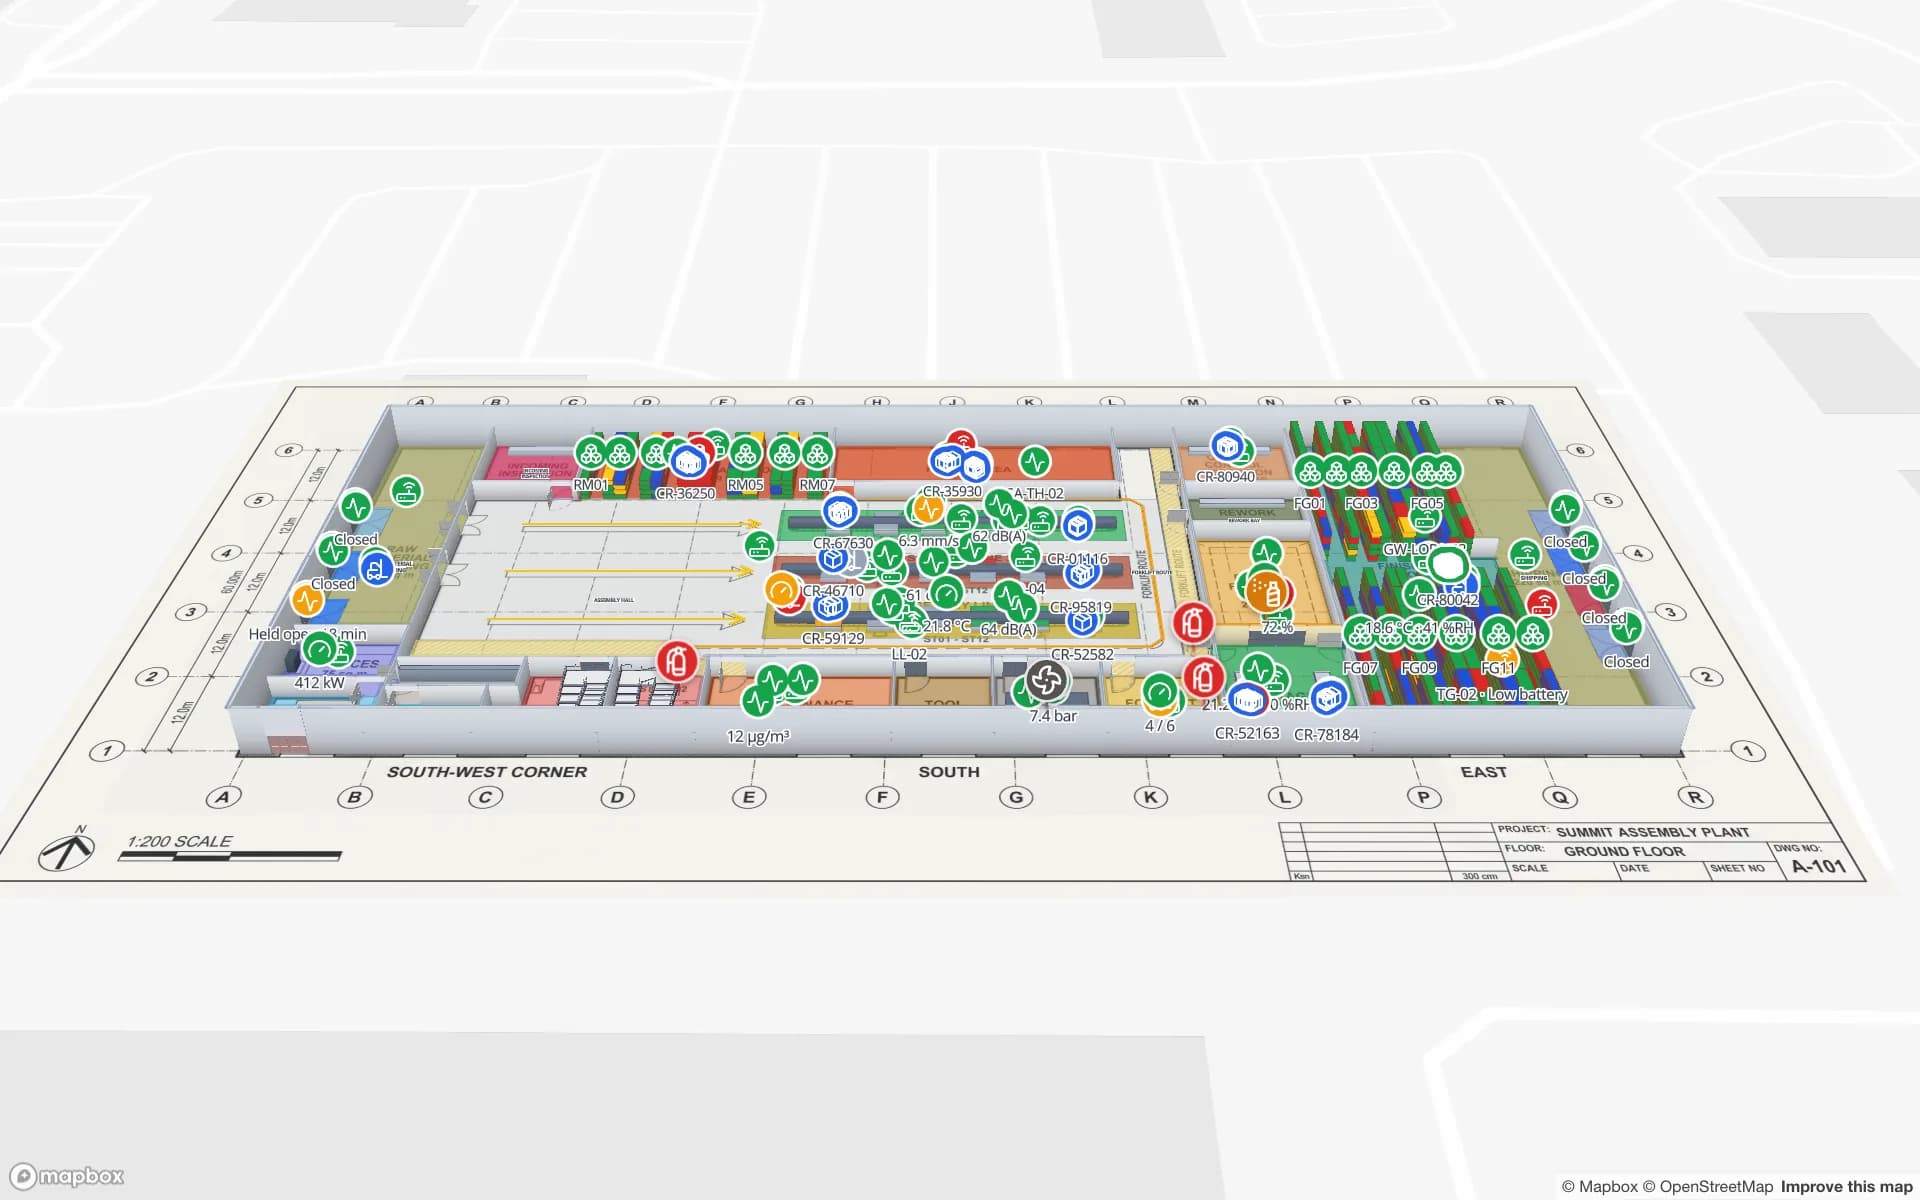
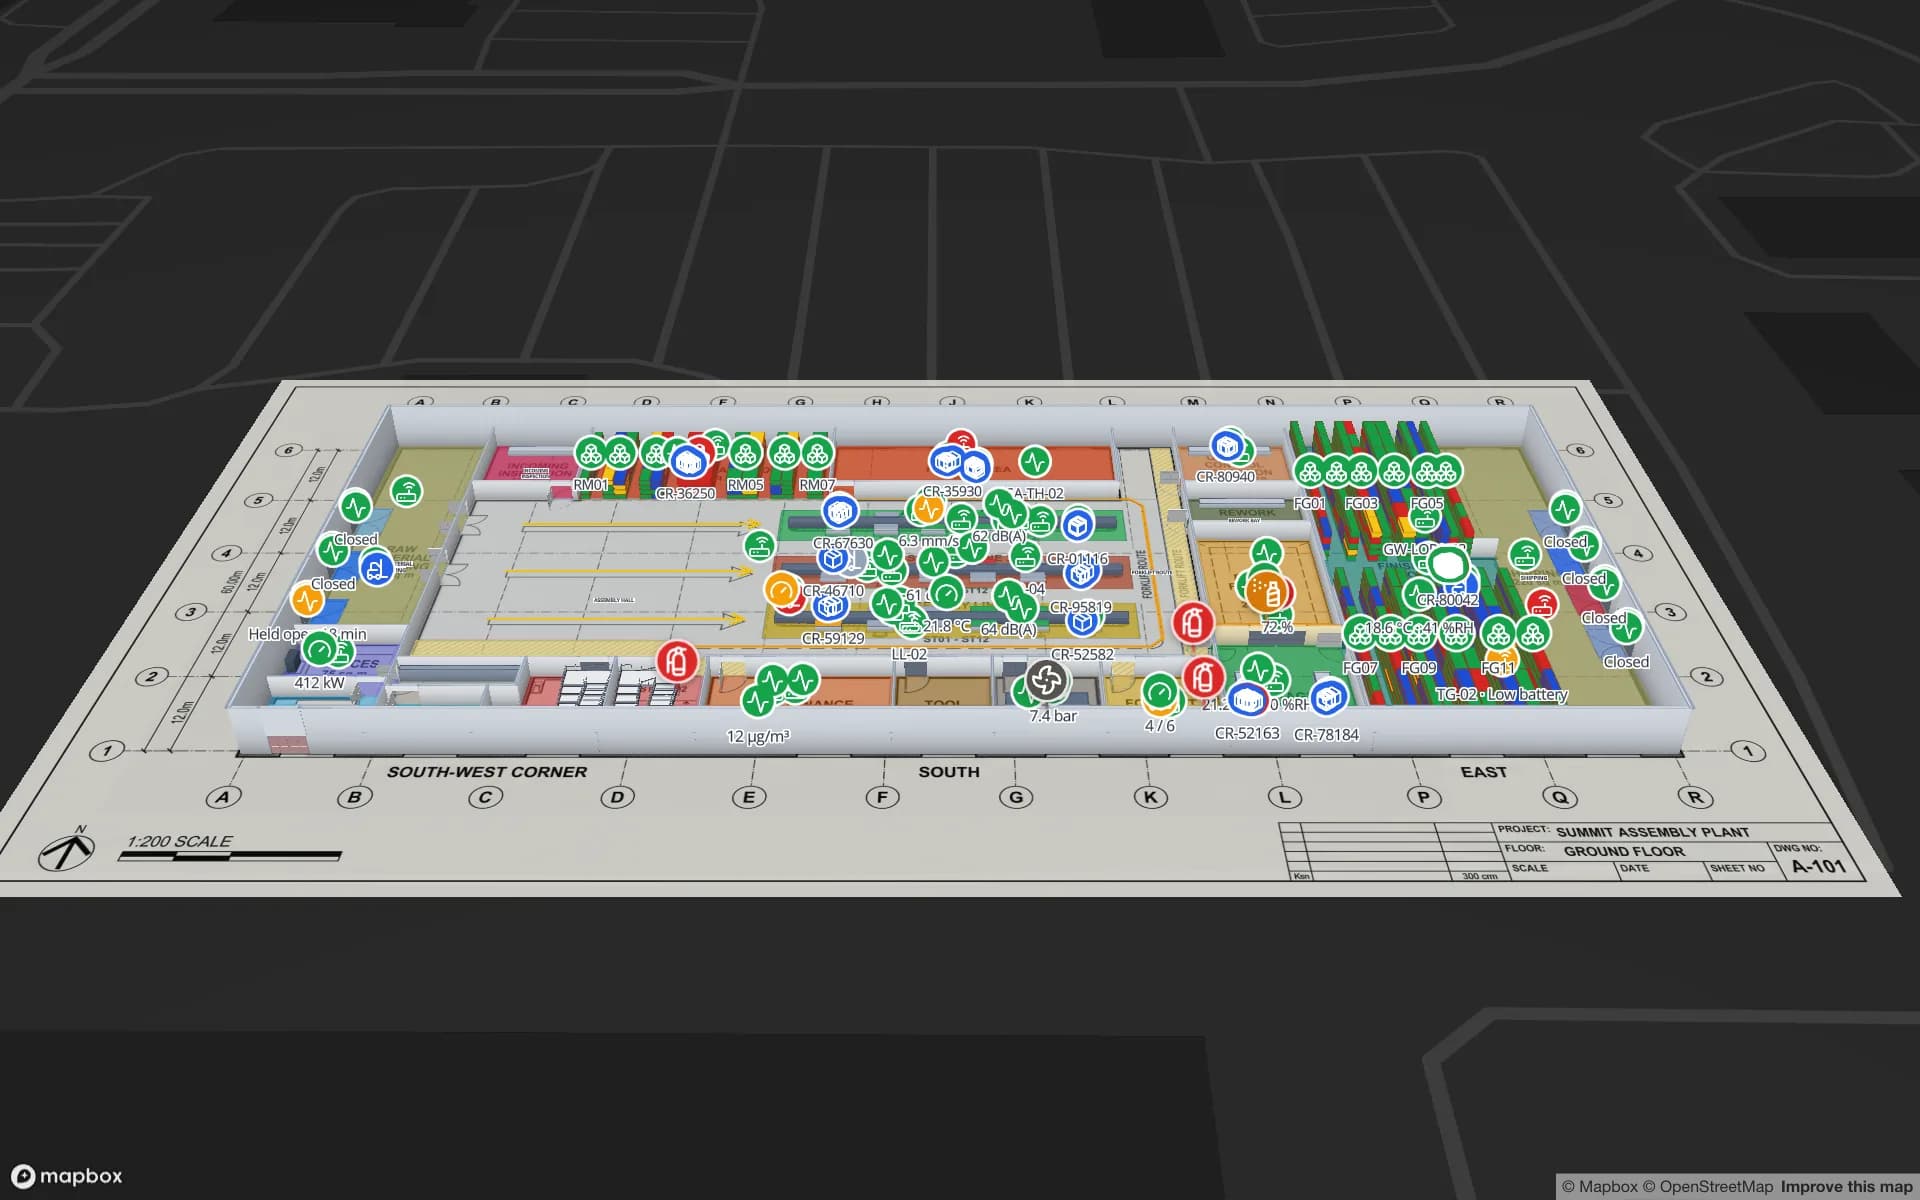
Spatial Map supplies that picture. Lines, workcells, raw-material and finished-goods racks, docks and line-side supermarkets are drawn on the real floor plan; table rows from your systems become live markers, value badges and rooms coloured by status. The Summit Assembly demo shows assembly lines, 867 rack locations and RFID WIP carriers on one map.
Distribution along Europe’s logistics corridors

Goods in Europe move along the Trans-European Transport Network (TEN-T) corridors that link the North Sea ports with the Alps, the Mediterranean and the east. Distribution centres, cross-docks and 3PL sites cluster where those corridors meet — in the Netherlands and Belgium, the Rhine-Ruhr, northern Italy, central Spain and around Paris and Lyon — and many serve several countries from one building.

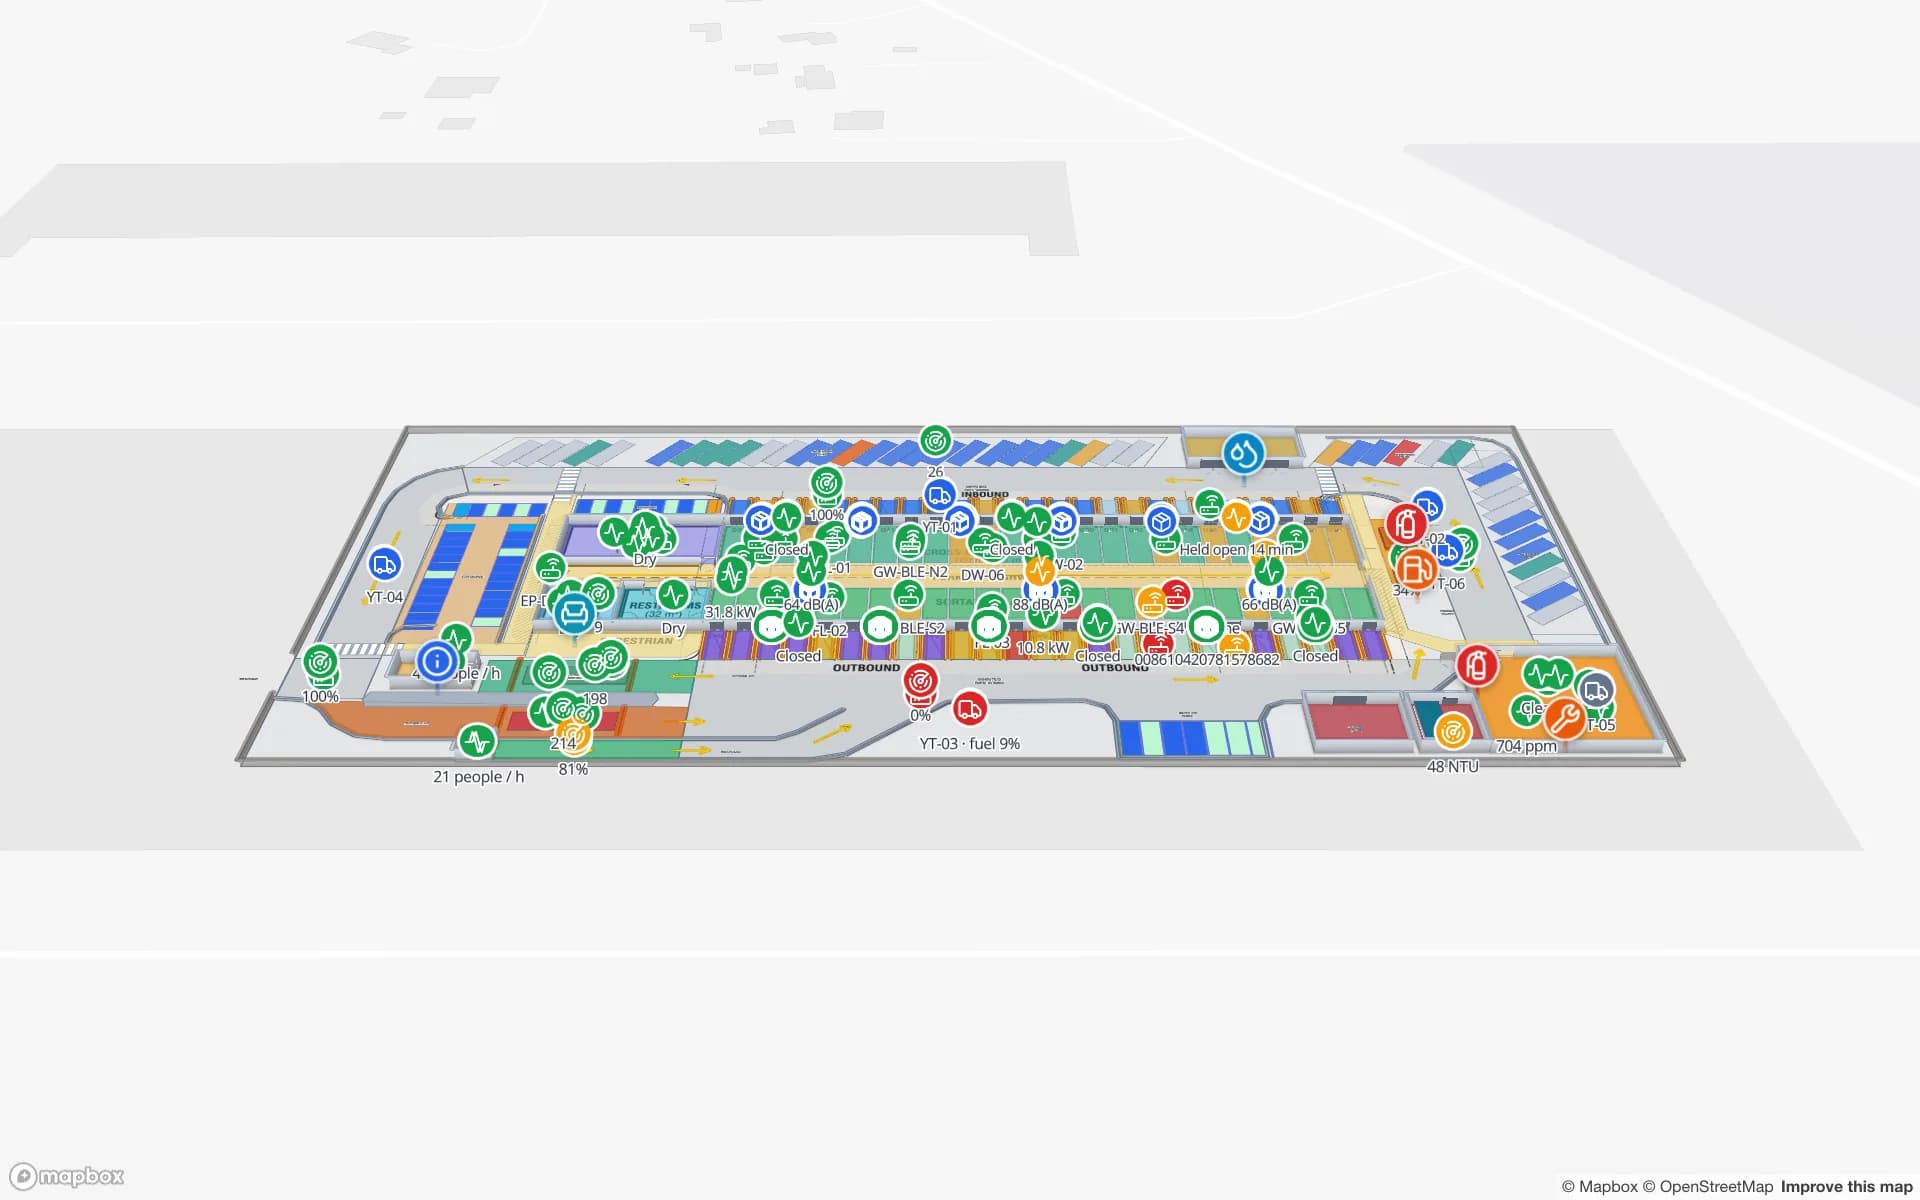
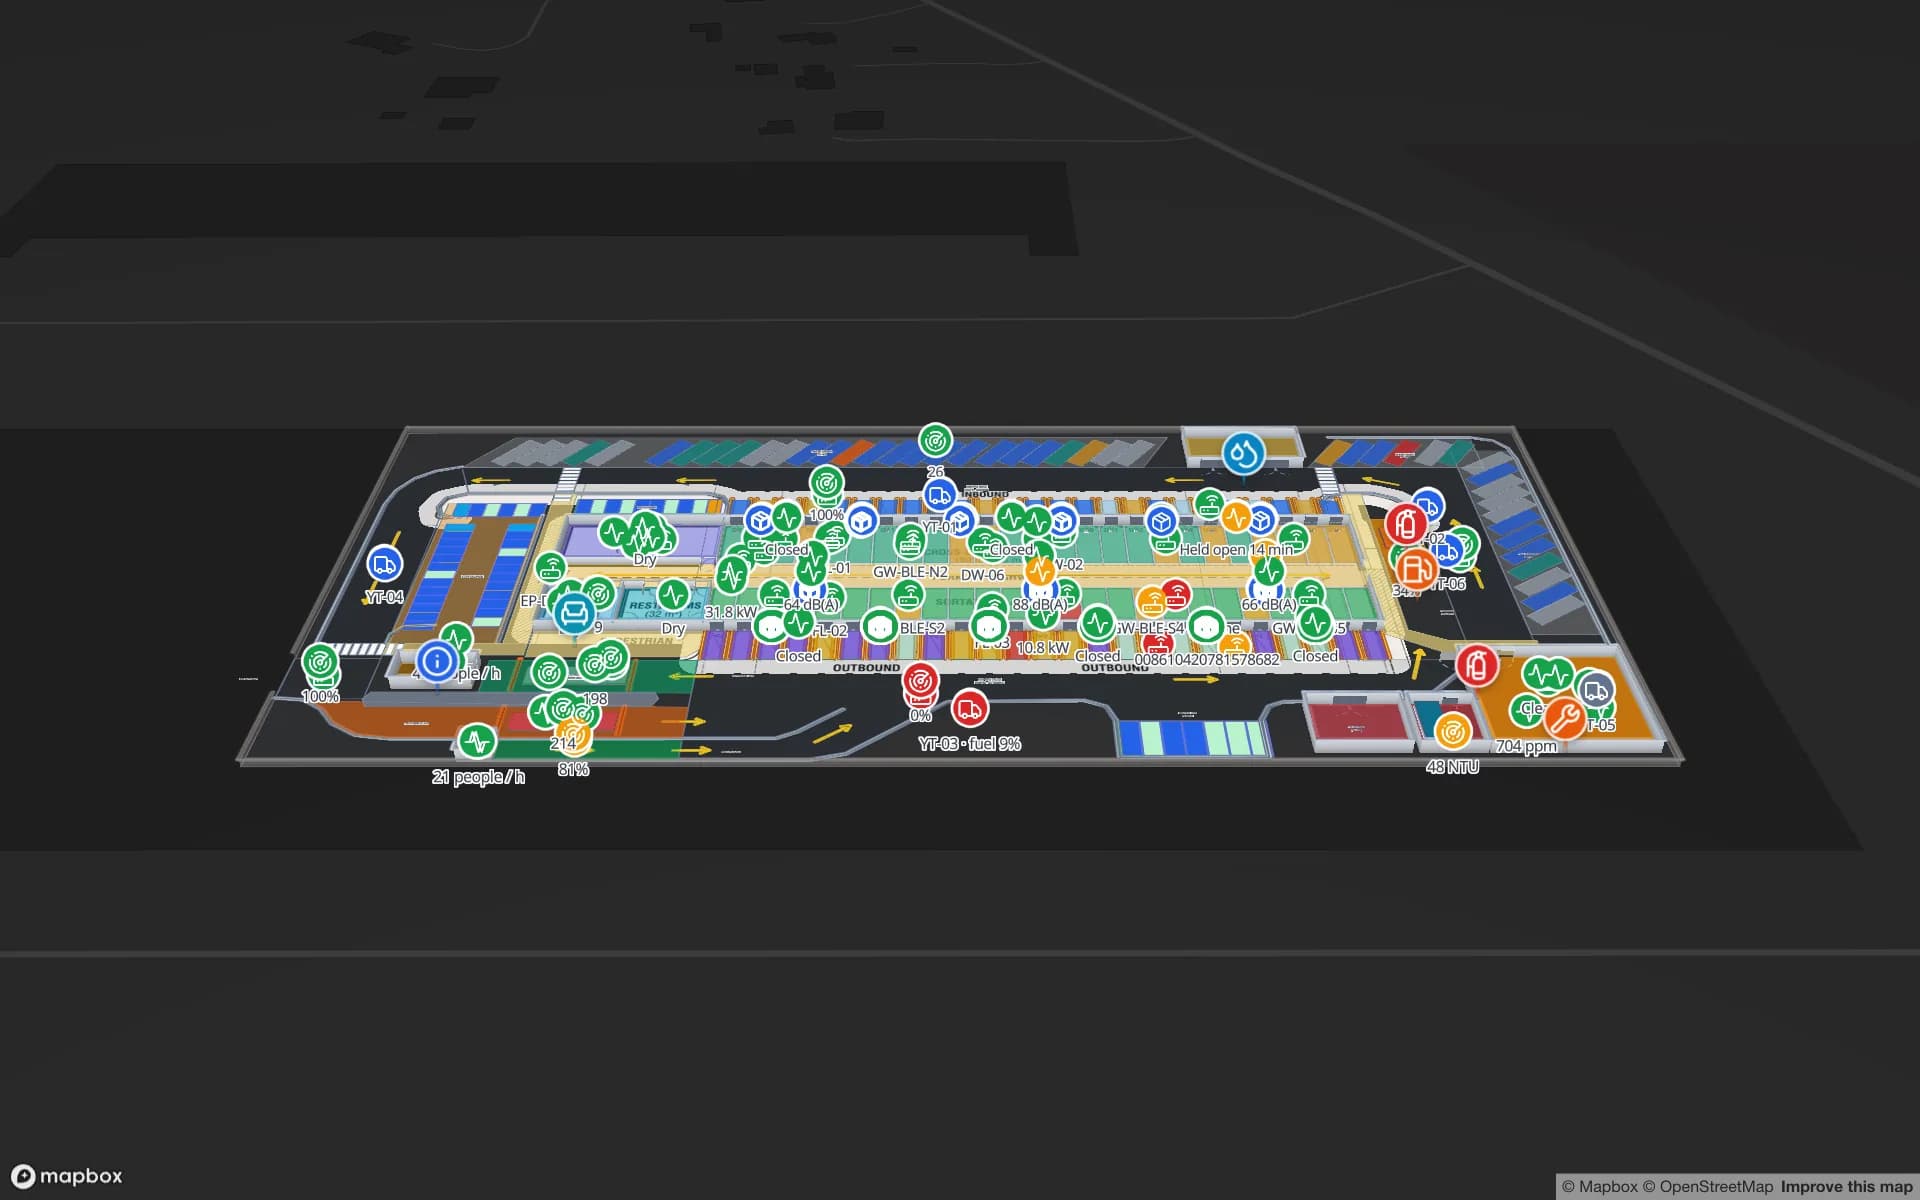
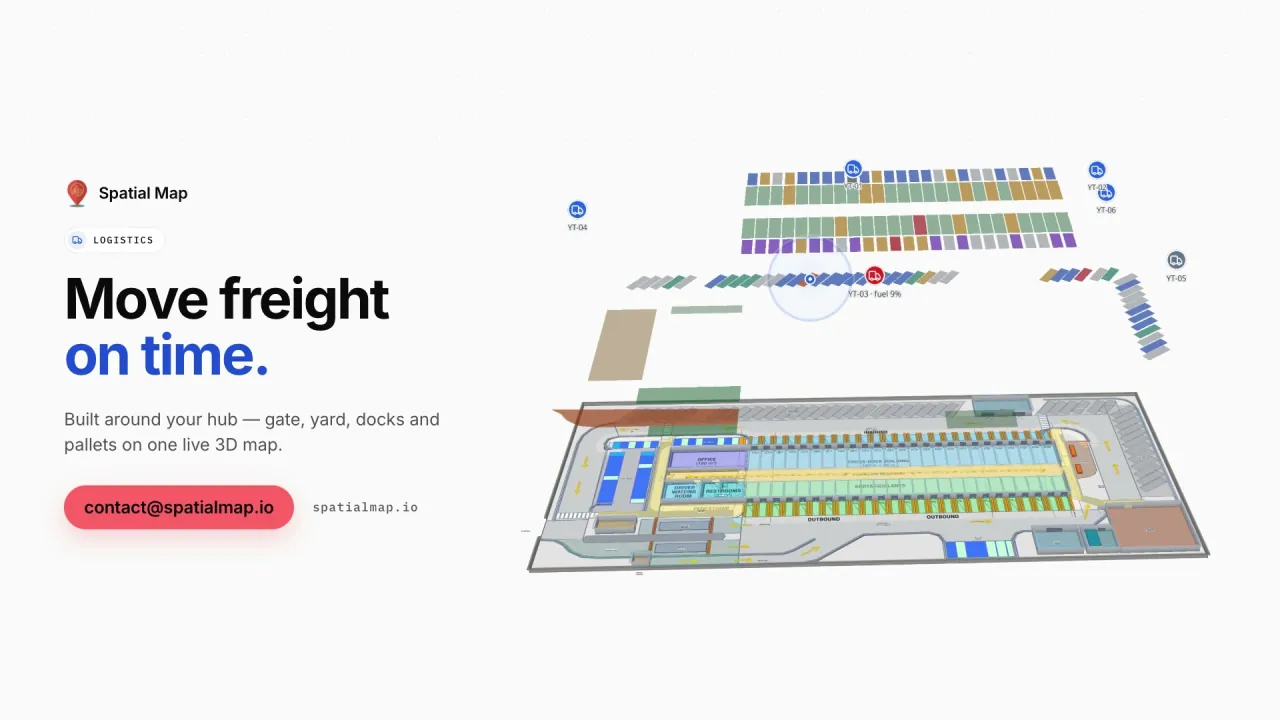
For those sites, Spatial Map puts dock doors, yard slots, staging lanes and rack locations on one live map: RFID-tagged pallets read at each door, trailers in the yard and stock by bin from your WMS. The Eastport Cross-Dock and Crestline Fulfillment demos show 50 dock doors, 1,180 RFID pallets and 2,204 rack locations live.

Cold chain for food and pharmaceuticals

Wholesale distributors of medicines in the EU work to the Good Distribution Practice (GDP) guidelines, and food businesses keep chilled and frozen products within their temperature limits under EU food-hygiene rules. Spatial Map does not make anyone compliant. It makes the state of every cold room, freezer and controlled-ambient zone visible: zones coloured by the live reading from your sensors, doors open or closed, held pallets marked in place, and a history you can replay and export with the report for your QA file.

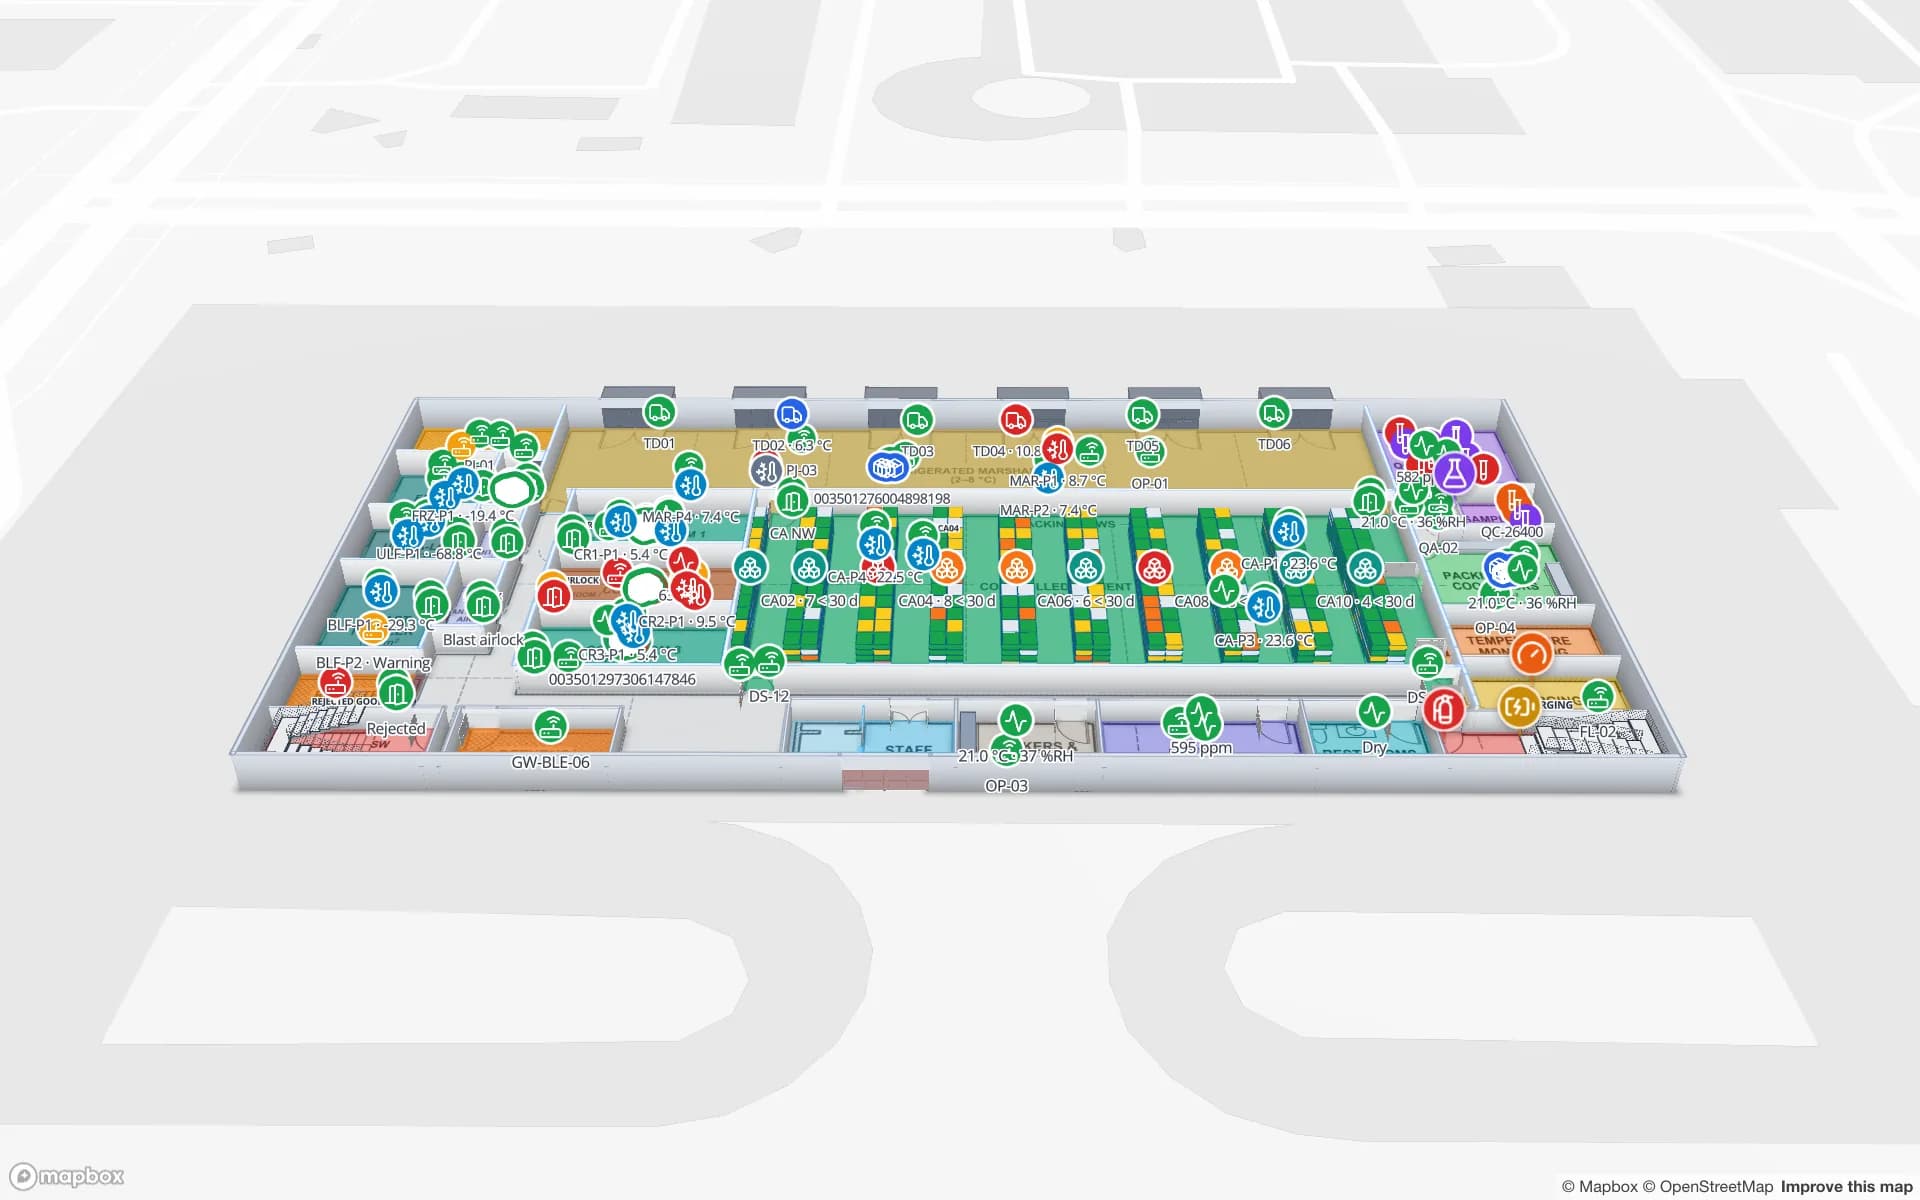
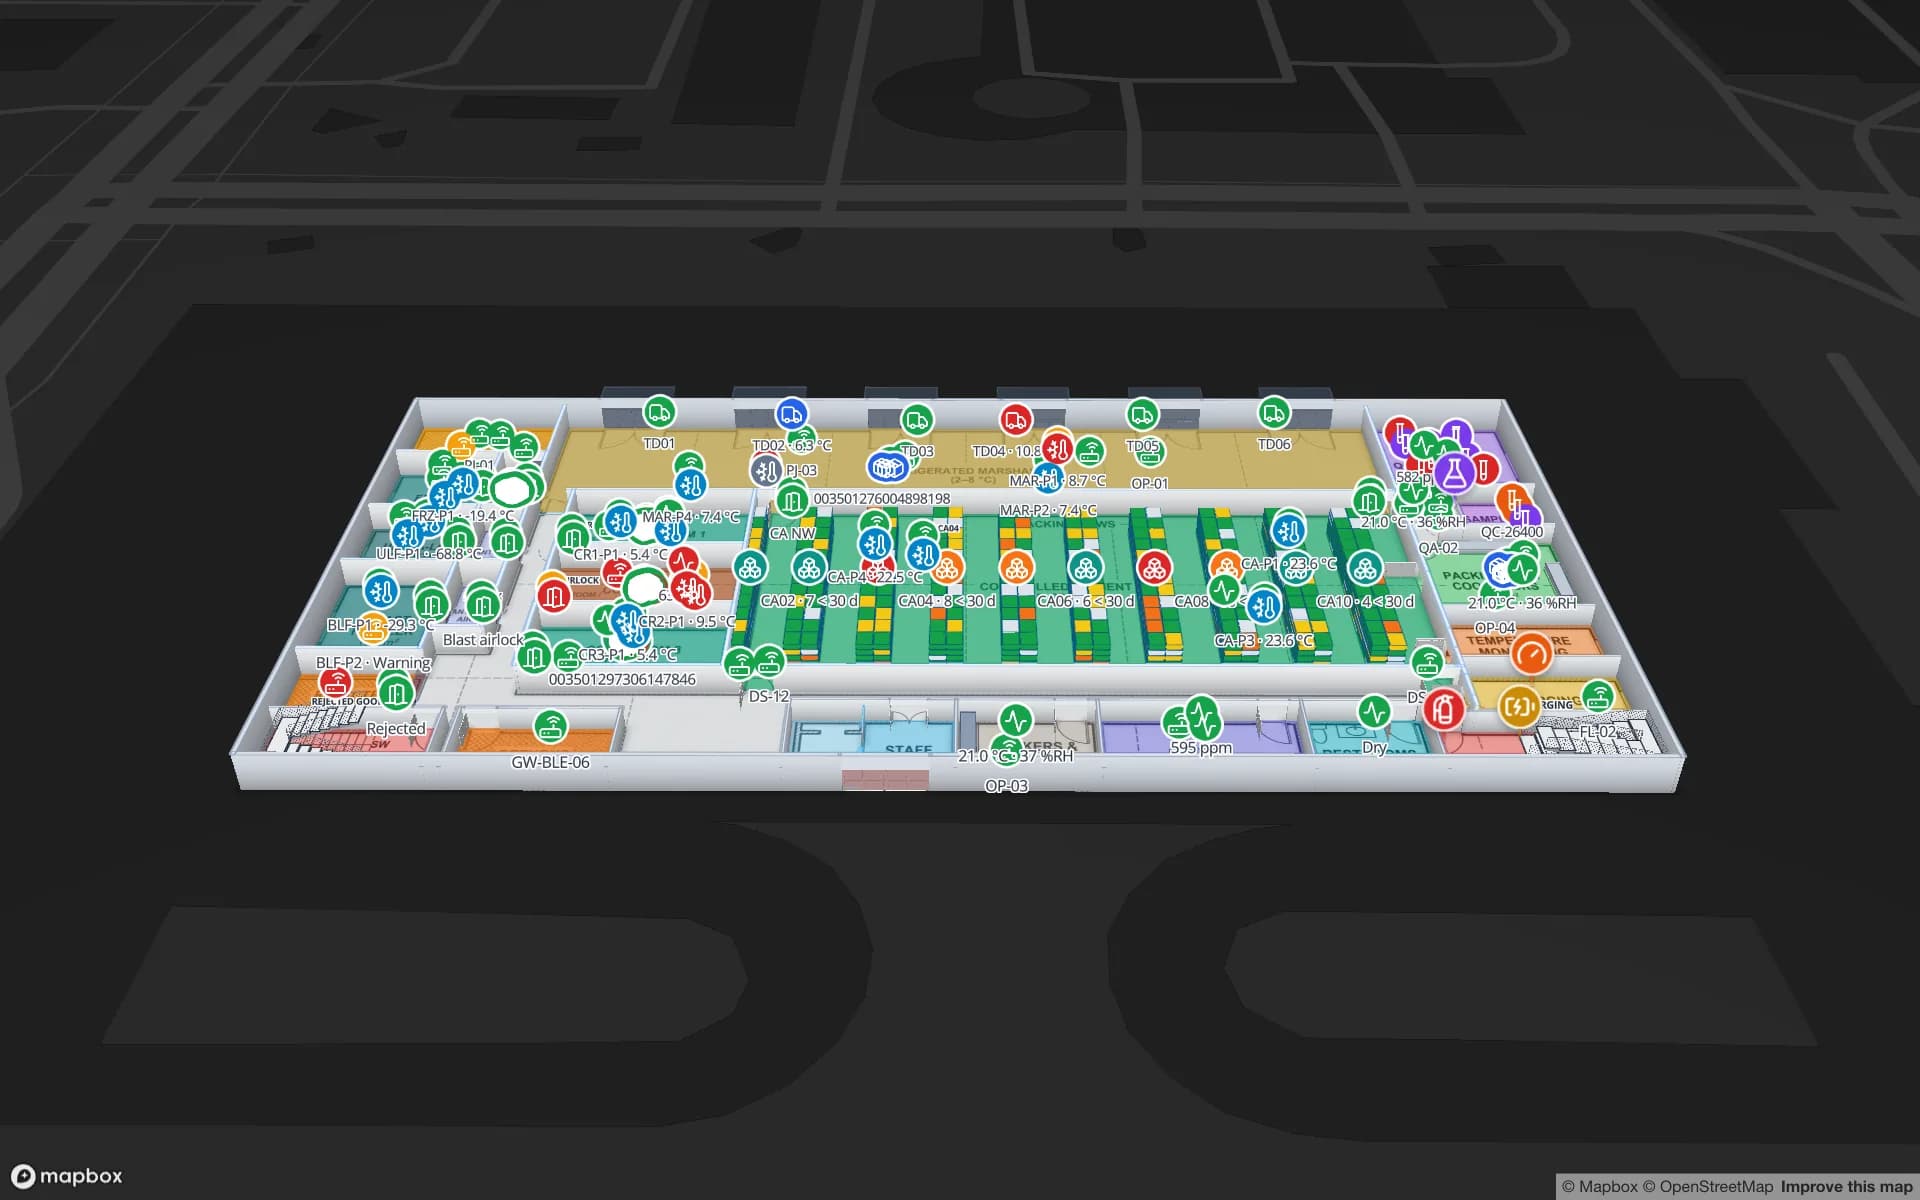
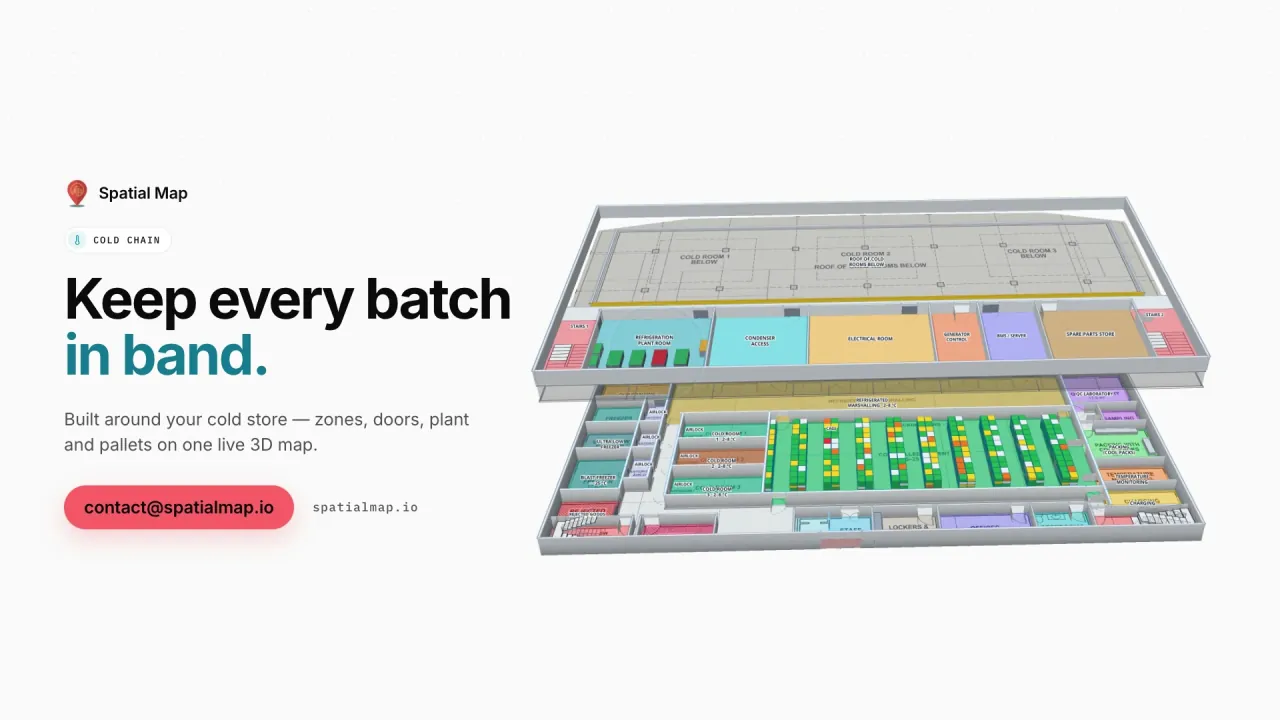
The Polar Pharma demo shows cold rooms, freezers and 1,140 rack locations with temperature zones, door states and pallets on hold.

GDPR: track assets first, treat people data carefully

Location data that can be linked to a person is personal data under the GDPR, and indoor tracking of staff needs a clear purpose, a lawful basis and often a data protection impact assessment. Most European projects avoid the question where they can by tagging assets rather than people: pallets, carriers, tools, trolleys, forklifts and returnable containers.

Where people do appear — a headcount in a zone, a visitor badge — you decide what is shown and to whom. Data arrives only through the tables and REST sources you configure, the four roles (Owner, Admin, Editor, Viewer) limit who can see or edit a facility, share links expose only the layers and floors you choose, and every workspace is isolated. A data processing agreement is available, and the security page explains how data is protected.

Germany, Italy and the Netherlands

Three European markets have their own pages, because their buildings and questions differ:

  • Germany: automotive and machinery supply chains, JIT/JIS line supply, intralogistics in Mittelstand plants, and works-council questions around tracking.
  • Italy: industrial districts and machinery builders, fashion and luxury logistics, and the cold chain for DOP and IGP food products.
  • Netherlands: Rotterdam, Schiphol and the European distribution centres around them, cross-docks, and agrifood and horticulture cold chains.

Languages and working with us from Europe

The app is available in English, German, French and Spanish, plus Arabic and Chinese; it is not yet translated into Italian or Dutch. Each user picks their own language, and room names, table columns and report titles stay in whatever language you type them.

Spatial Map is sold online at the same USD price everywhere, and our team works with European customers remotely, by video call and through the contact form. For multi-site rollouts, the services team quotes floor-plan digitisation and integration as a fixed-price custom service, in English, German, French or Spanish.

How Spatial Map does it

From a European site plan to a live map

  1. 01

    Import the plan

    Upload the layout as a PDF (scale read from standard sheet sizes) or as a DWG from AutoCAD R2004–R2018.

  2. 02

    Draw lines, racks and docks

    Trace halls, racks with their locations, walls, doors, stairs and lifts on every floor.

  3. 03

    Connect MES, WMS and devices

    Rows arrive via REST polling, CSV or Excel uploads, or the table write API — from the systems you already run.

  4. 04

    Operate, report, share

    Live map, history playback, reports in PDF, Excel, CSV or JSON, and read-only share links.

What European teams use it for

Line supply and WIP

Carriers, kits and held lots on the plant map, from goods-in to the line.

Multi-country distribution centres

Rack-level stock from the WMS, RFID cartons and the trailer yard in one view.

Cross-docks on the corridors

Dock doors, yard slots, the gate and pallets staged for the right outbound load.

Pharma and food cold stores

Temperature zones, doors and held pallets, with exportable reports for QA.

Returnable containers and tools

Tagged containers, tools and forklifts as live markers, with row history per item.

See it on real demo facilities

Fictional names, real floor plans, live sensors, RFID, BLE tags and gateways — open any of them in the browser.

All 13 demo facilities

Questions from European teams

Yes. Spatial Map processes the data you send it, a data processing agreement is available, and the security page explains how data is protected. Whether a specific use — especially tracking people — is lawful is for you as the controller to assess; most teams start by tagging assets rather than employees.

English, German, French and Spanish, plus Arabic and Chinese. Each user picks their own language. Italian and Dutch are not available yet.

Yes, if the system can expose its data. Spatial Map polls a REST endpoint on a schedule (JSON, GeoJSON or CSV), accepts file uploads (CSV, Excel, JSON, GeoJSON), or receives rows through the table write API. It does not replace those systems; it shows their data on the building.

No software does that on its own. Spatial Map shows live temperatures, excursions, door states and held stock on the map, keeps row history and exports reports; your quality system and procedures remain the record.

No. Pricing is the same worldwide and in US dollars: a 7-day free trial for up to 5 facilities, then Pro at $60 a month or $600 a year for up to 4 facilities. Larger estates are quoted as custom services.

Map your first European site this week.

Start the free trial in English, German, French or Spanish, or send us a floor plan and a sample of your data through the contact form.