Tracking · Real-time inventory tracking system

A real-time inventory tracking system that shows where the stock is

Spatial Map works as a real-time inventory tracking system for the physical side of stock: it shows where each pallet, bin and carton sits on a live 3D map of the warehouse, store or plant. The stock levels come from your WMS, ERP or RFID reads, posted into a Spatial Map table; every rack location is coloured by its status, and a supervisor sees what is low, empty, blocked or staged without opening a report.

Last updated:

No credit card. Runs in the browser. Pro is $60/month for up to 4 facilities. Book a demo

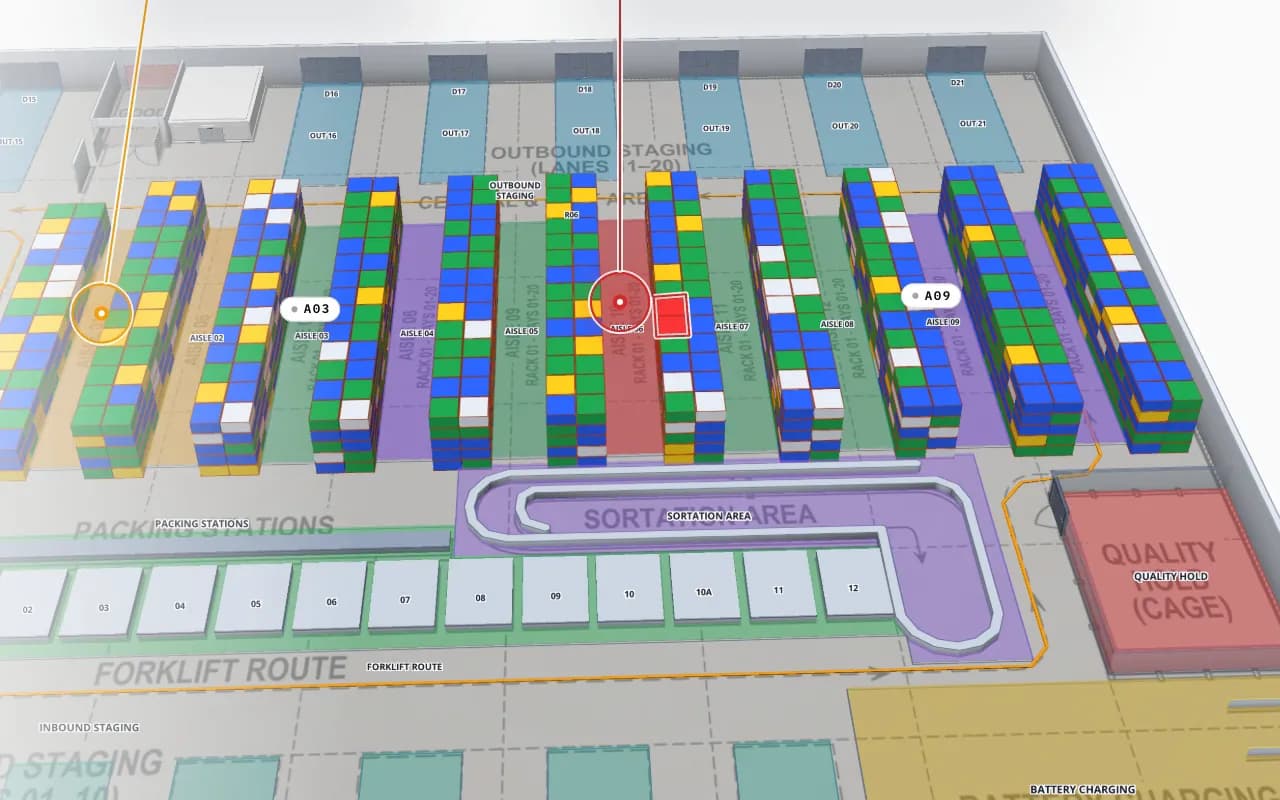
Crestline Fulfillment Center in 3D with every rack location coloured full, OK, low, empty or blocked, and a blocked location highlighted in red
Crestline Fulfillment Center
Crestline Fulfillment Center (demo): rack locations coloured full, OK, low, empty or blocked, with a blocked aisle and a replenishment flag in place.
Rack locations in the Crestline Fulfillment demo
2,204
Write API requests per key, with bulk upsert
60 / min
How often alert rules are checked
15 s
Free trial, no credit card
7 days

What it is, and what it is not

An inventory system of record answers “how many of item X do we own, and what is it worth”. Your ERP or WMS does that, and Spatial Map does not replace it. It answers the question those systems make awkward: where, physically, is it, and what state is that location in right now?

So Spatial Map is not accounting, purchasing or order-management software. It does not hold your item master, price lists or ledgers, and it does not write anything back to your WMS or ERP. It reads stock from them, or from RFID reads, and draws it where the stock stands. Think of it as the floor-level view that sits beside the system of record.


Rack, bin and location-level stock

Racks are drawn once from the floor plan, with their bays, levels and positions. Each location in your WMS export has a code, so every row of stock lands on the rack cell with the same code. A data link then colours cells by whatever field you choose.

  • Status colours — full, OK, low, empty, blocked or on hold, from a status field or from quantity against a threshold.
  • Quantity badges — the count or the days of cover on the cell, readable when you tilt the camera into an aisle.
  • Detail on click — SKU, lot, quantity, last movement and any field you add, in the drawer and tooltip.
  • Heatmaps — where picks happen, or where stock is thin, as a heatmap that stops at walls.
  • Floors and zones — multi-floor mezzanines, cold rooms and cages on their own floors, each with its own colours.
Crestline Fulfillment Center, a fulfillment center demo, in the Spatial Map 3D viewer with live device markers
Crestline Fulfillment Center
Crestline Fulfillment Center (demo): 20 racks with 2,204 locations coloured by stock status, dock doors, staging lanes and live forklift and RFID markers.

Cycle counts, variance, staging and dock-to-stock

The map earns its place in the moments between counts. With rows that carry a last-counted date and a system quantity against a counted quantity, you can see variance by aisle, not just by item, and find the zone that keeps drifting. Counts from handhelds can be posted as rows, and the stock counting page covers that workflow.

The same logic follows stock from the truck to the rack. Dock doors, staging lanes and put-away zones are areas on the plan; each can show a count of pallets waiting and the age of the oldest. A rule such as “pallets in the lane for more than 120 minutes” fires an in-app alert, so inbound stock does not sit unnoticed between the dock and its location.

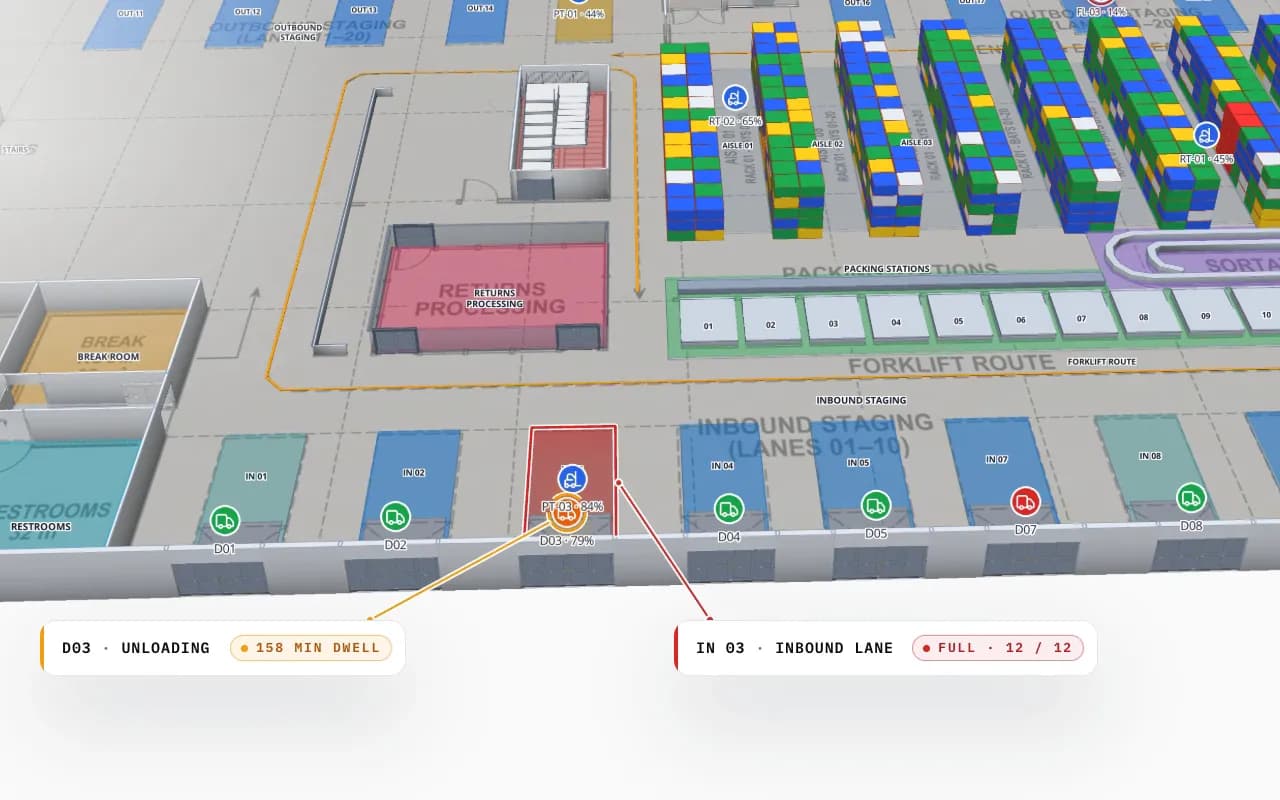
Crestline Fulfillment Center dock doors in 3D: door D03 unloading with a long dwell time and inbound lane IN 03 full, next to the rack area
Crestline Fulfillment Center
Crestline Fulfillment Center (demo): a dock door unloading for 150 minutes and a full inbound lane flagged on the floor plan, next to the racks they feed.

Where the stock numbers come from

Three feeds cover most sites, and they combine. A WMS or ERP export or API gives quantity per location: post it with the write API, let Spatial Map poll a REST endpoint on a schedule, or upload a CSV when that is all you have. RFID reads from fixed readers, portals and handhelds give the presence of tagged cartons and pallets by zone; the RFID inventory management page covers that in depth. Barcode scans arrive from your scanner app as rows. The post from CSV bin inventory to a live rack map walks through the first one.

Updates are as current as your feed. The write API accepts bulk upserts at up to 60 requests a minute per key, so a relay should batch changes rather than post each scan. Plan for a few seconds behind your system, not sub-second.

Which part of inventory tracking lives where

QuestionAnswered byOn the Spatial Map side
How many of this SKU do we own?Your ERP or WMSNot stored; quantities per location are shown from your export
Which rack cell holds it?Your WMS location dataCell coloured and labelled from the row
Is a location blocked, low or empty?A status field or a quantity rule in your dataStatus colours, quantity badges and rules
Did the pallet cross the dock door?RFID portal or readerRead trail and a count per door or lane
Where does the count drift?Cycle-count rows with counted vs system quantityVariance by aisle and zone in reports
Update the stock recordYour WMS or ERPNothing is written back from Spatial Map

How a digital twin and a WMS divide the work is covered in warehouse digital twin vs WMS. For barcode against RFID, see RFID vs barcode in the warehouse.

How Spatial Map does it

Live stock on a rack map in four steps

  1. 01

    Draw the racks

    Import the warehouse plan and trace racks, aisles, dock doors and staging lanes, or let AI Map draft them for you to review.

  2. 02

    Match location codes

    Use the same location code in your export and on the rack cell, so each row finds its place.

  3. 03

    Connect the stock feed

    Post batches with the write API, poll a REST endpoint, or upload a CSV to start.

  4. 04

    Colour, alert, report

    Choose the status field, add rules for low stock and slow staging lanes, and share a read-only view with the operations team.

Inventory tracking in the demos

Fulfillment centre racks

Twenty racks with 2,204 locations coloured by stock status, with pick modules and staging lanes beside them.

Cold store pallet locations

Cold rooms and freezers with pallet locations coloured by status, and stock on hold or in QC.

Retail shelf and department stock

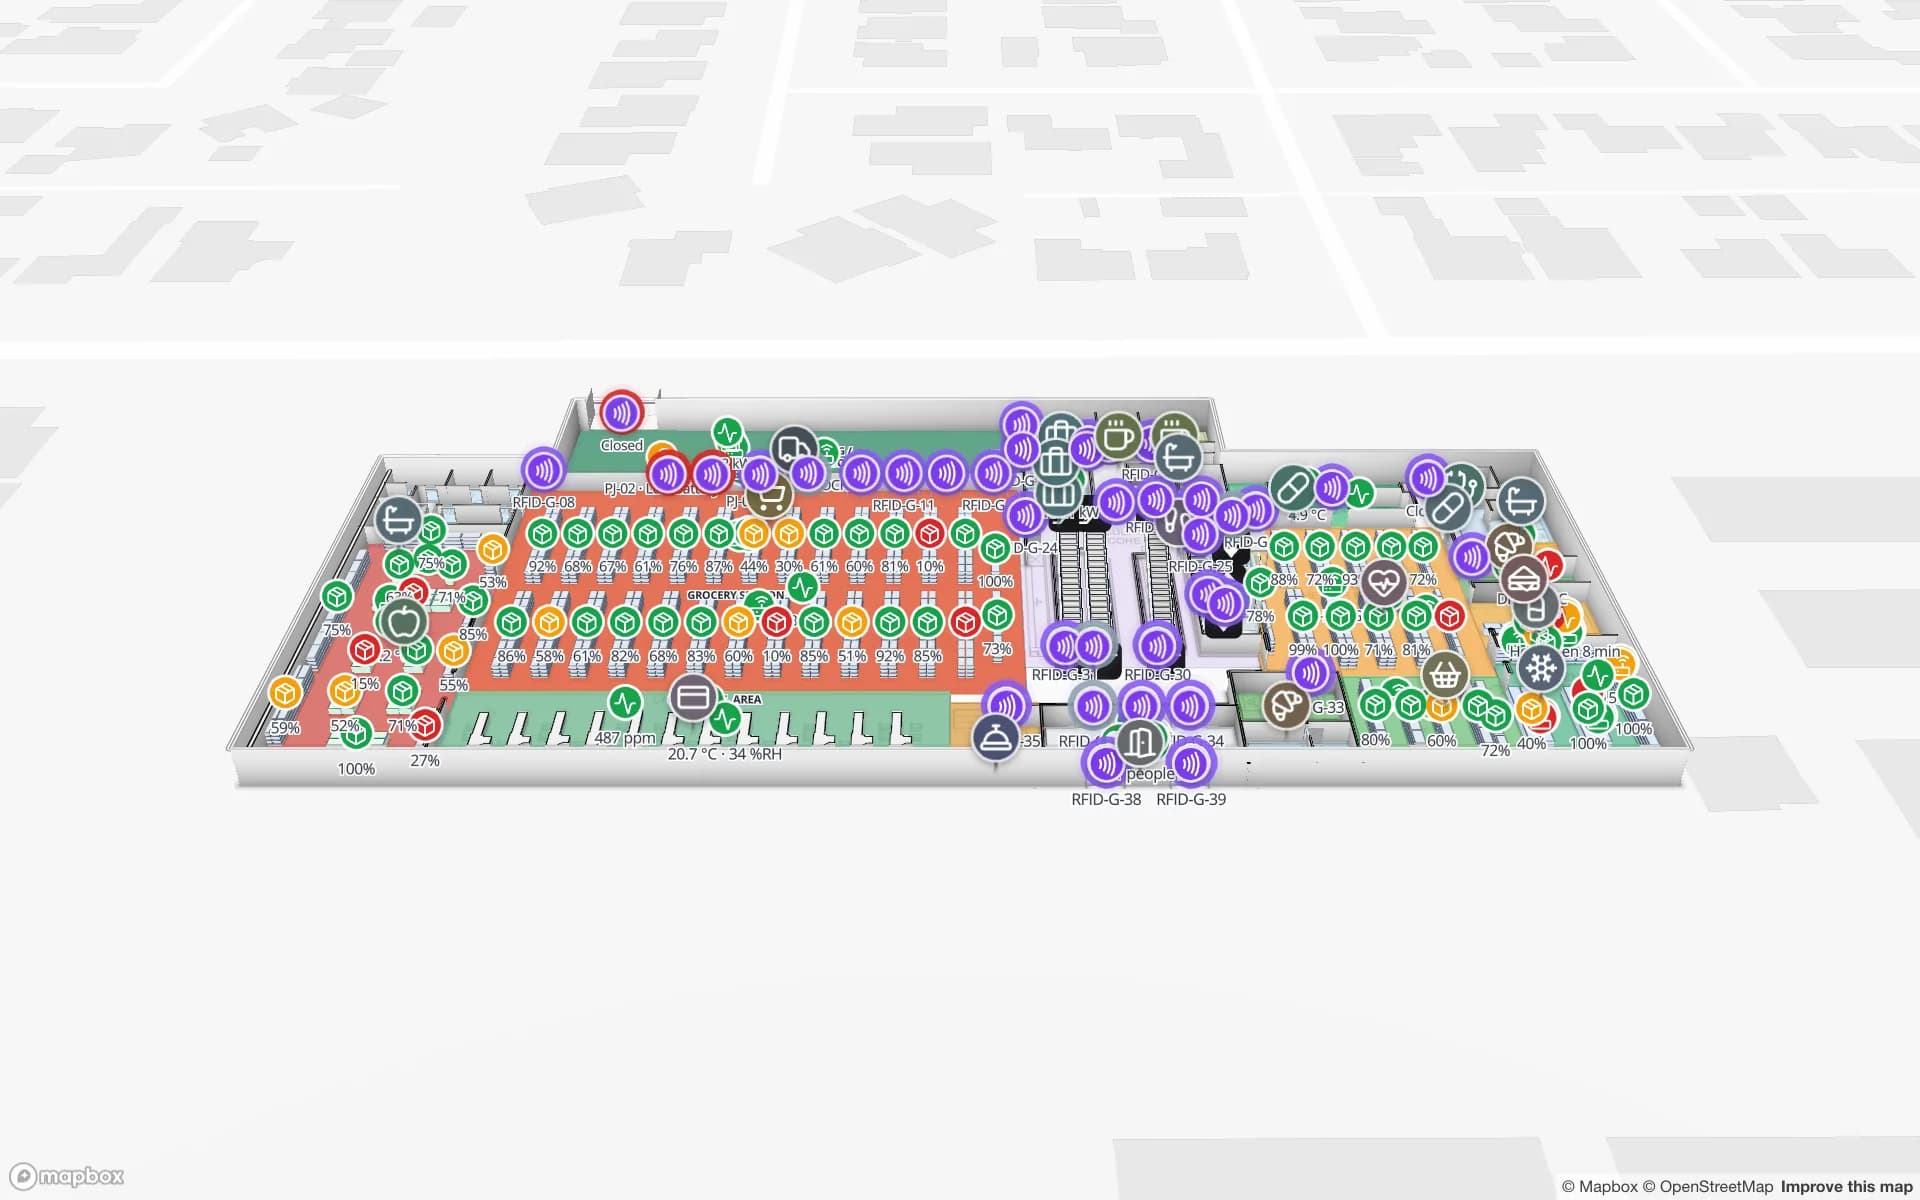
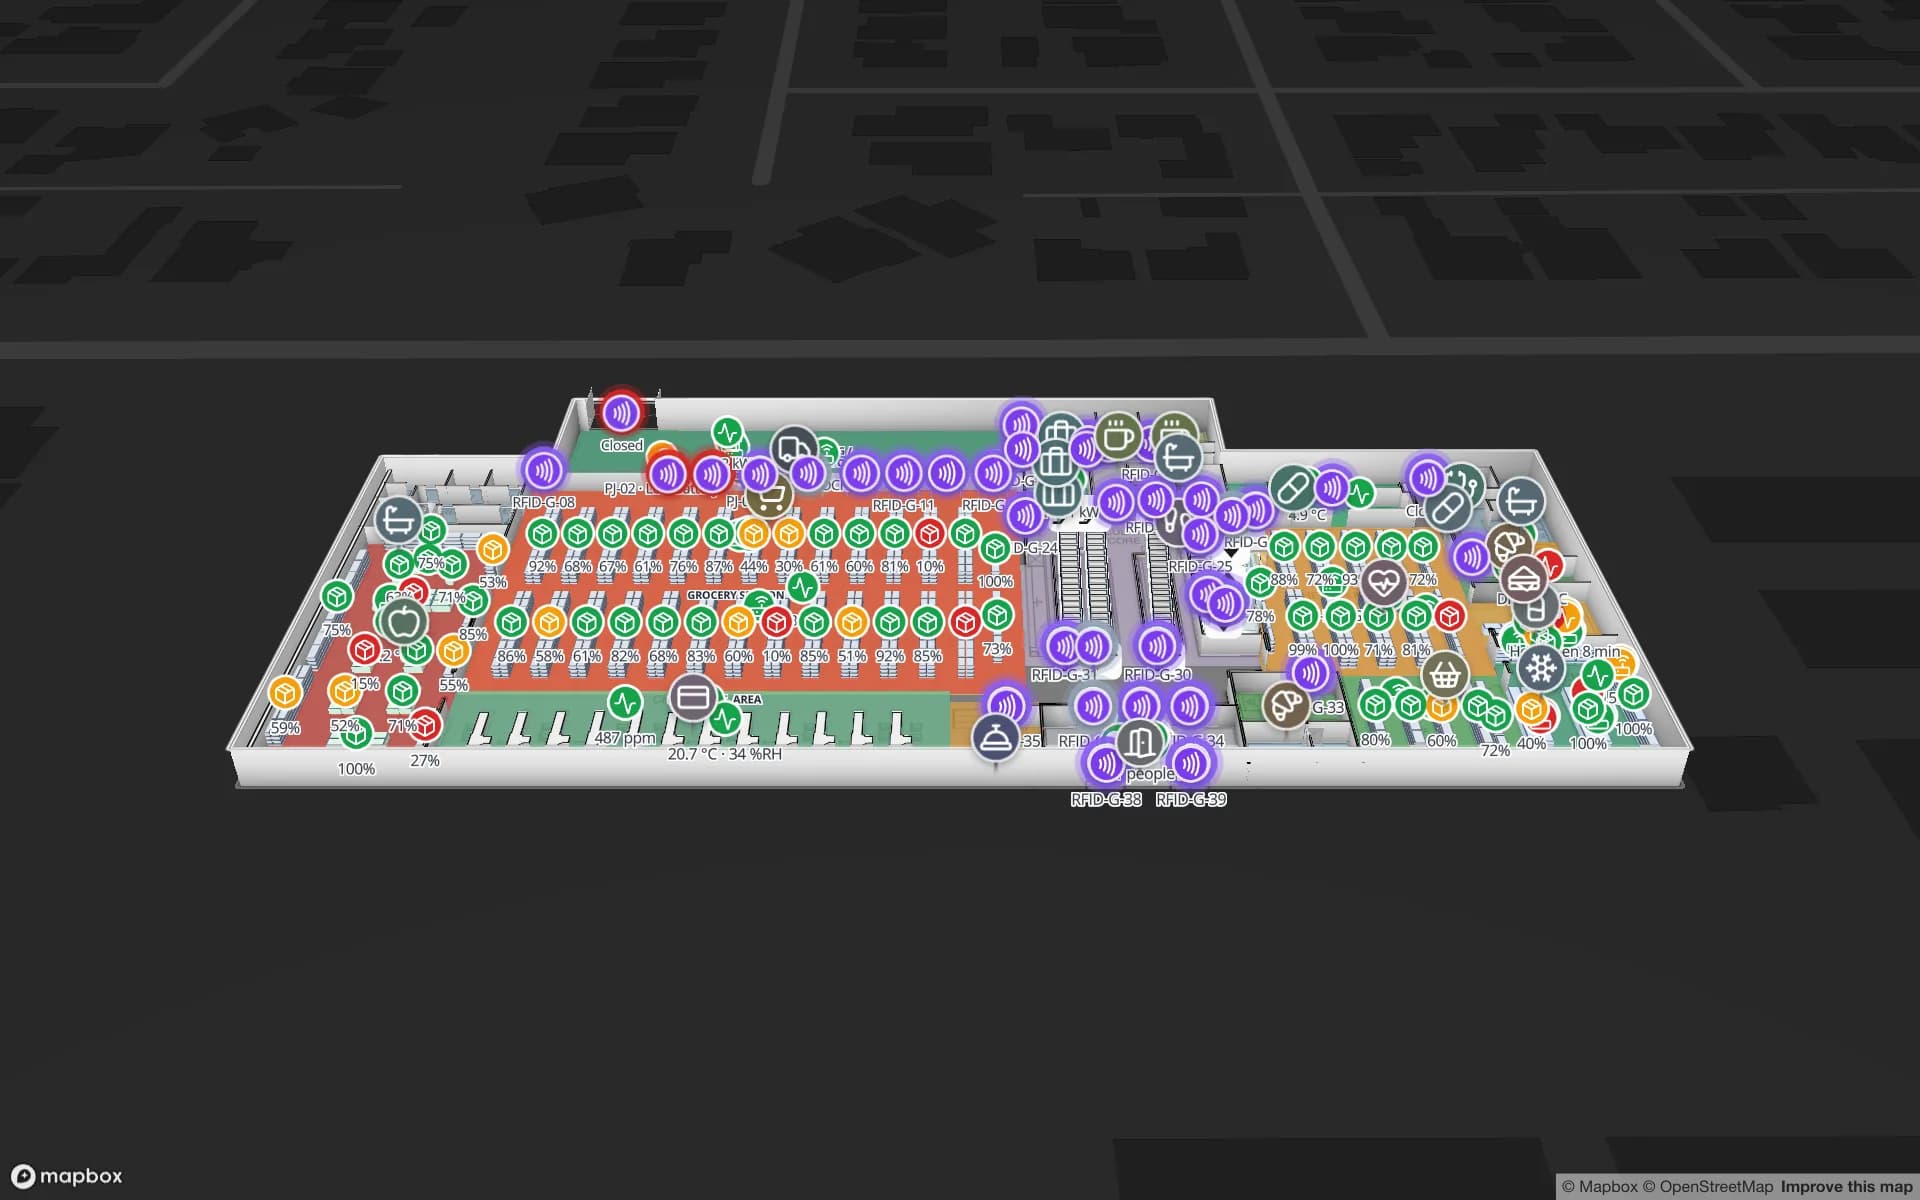
Shelves carrying daily stock counts across three floors, with RFID readers at the doors.

Raw material and finished goods

Material racks with 867 locations next to the lines they feed.

See it on real demo facilities

Fictional names, real floor plans, live sensors, RFID, BLE tags and gateways — open any of them in the browser.

All 13 demo facilities

Real-time inventory tracking — frequently asked questions

No. It is not accounting, purchasing or order-management software and it keeps no item master or ledger. It shows where stock is: your WMS, ERP or RFID reads supply quantities and statuses per location, and Spatial Map draws them on a live 3D map.

No. Data flows one way, from your systems into Spatial Map. Nothing is written back, so your WMS stays the single record of stock. Alerts appear in the app only, with no email, SMS or push.

Open maps refresh after each write. The write API takes bulk upserts at up to 60 requests a minute per key, so a relay batches changes. Expect a few seconds behind your system, not sub-second.

Yes. Upload a CSV or Excel file with a location code, quantity and status per row, and the racks colour straight away. Move to the write API or REST polling when you want it to stay current.

Yes. Fixed readers, portals and handhelds write their reads to a table, and the map shows tagged items by zone or location. Read the RFID inventory pages for the reader side; Spatial Map does not talk to readers directly.

If your rows carry system and counted quantities, a report or a style rule can show variance by aisle and zone. The count itself is done by your people or handhelds and posted as rows.

A 7-day free trial covers up to 5 facilities with no credit card. Pro is $60 a month or $600 a year for up to 4 facilities. Hardware, relays and larger estates are quoted per project as custom services or custom development.

See where every pallet stands.

Start a free trial and open the Crestline demo, or send us a floor plan and a sample location export from your WMS and we will build your rack map.