IoT sensors · Warehouse temperature monitoring

Warehouse temperature monitoring you can see room by room

Spatial Map does warehouse temperature monitoring on a live 3D floor plan. Your probes and data loggers, through their gateway or monitoring platform, write readings into a Spatial Map table; every cold room, freezer and ambient zone is tinted by its temperature, and alerts flag a zone that stays out of band or a sensor that stops reporting. Heatmaps, history playback and cold-chain reports come from the same readings.

Last updated:

No credit card. Runs in the browser. Pro is $60/month for up to 4 facilities. Book a demo

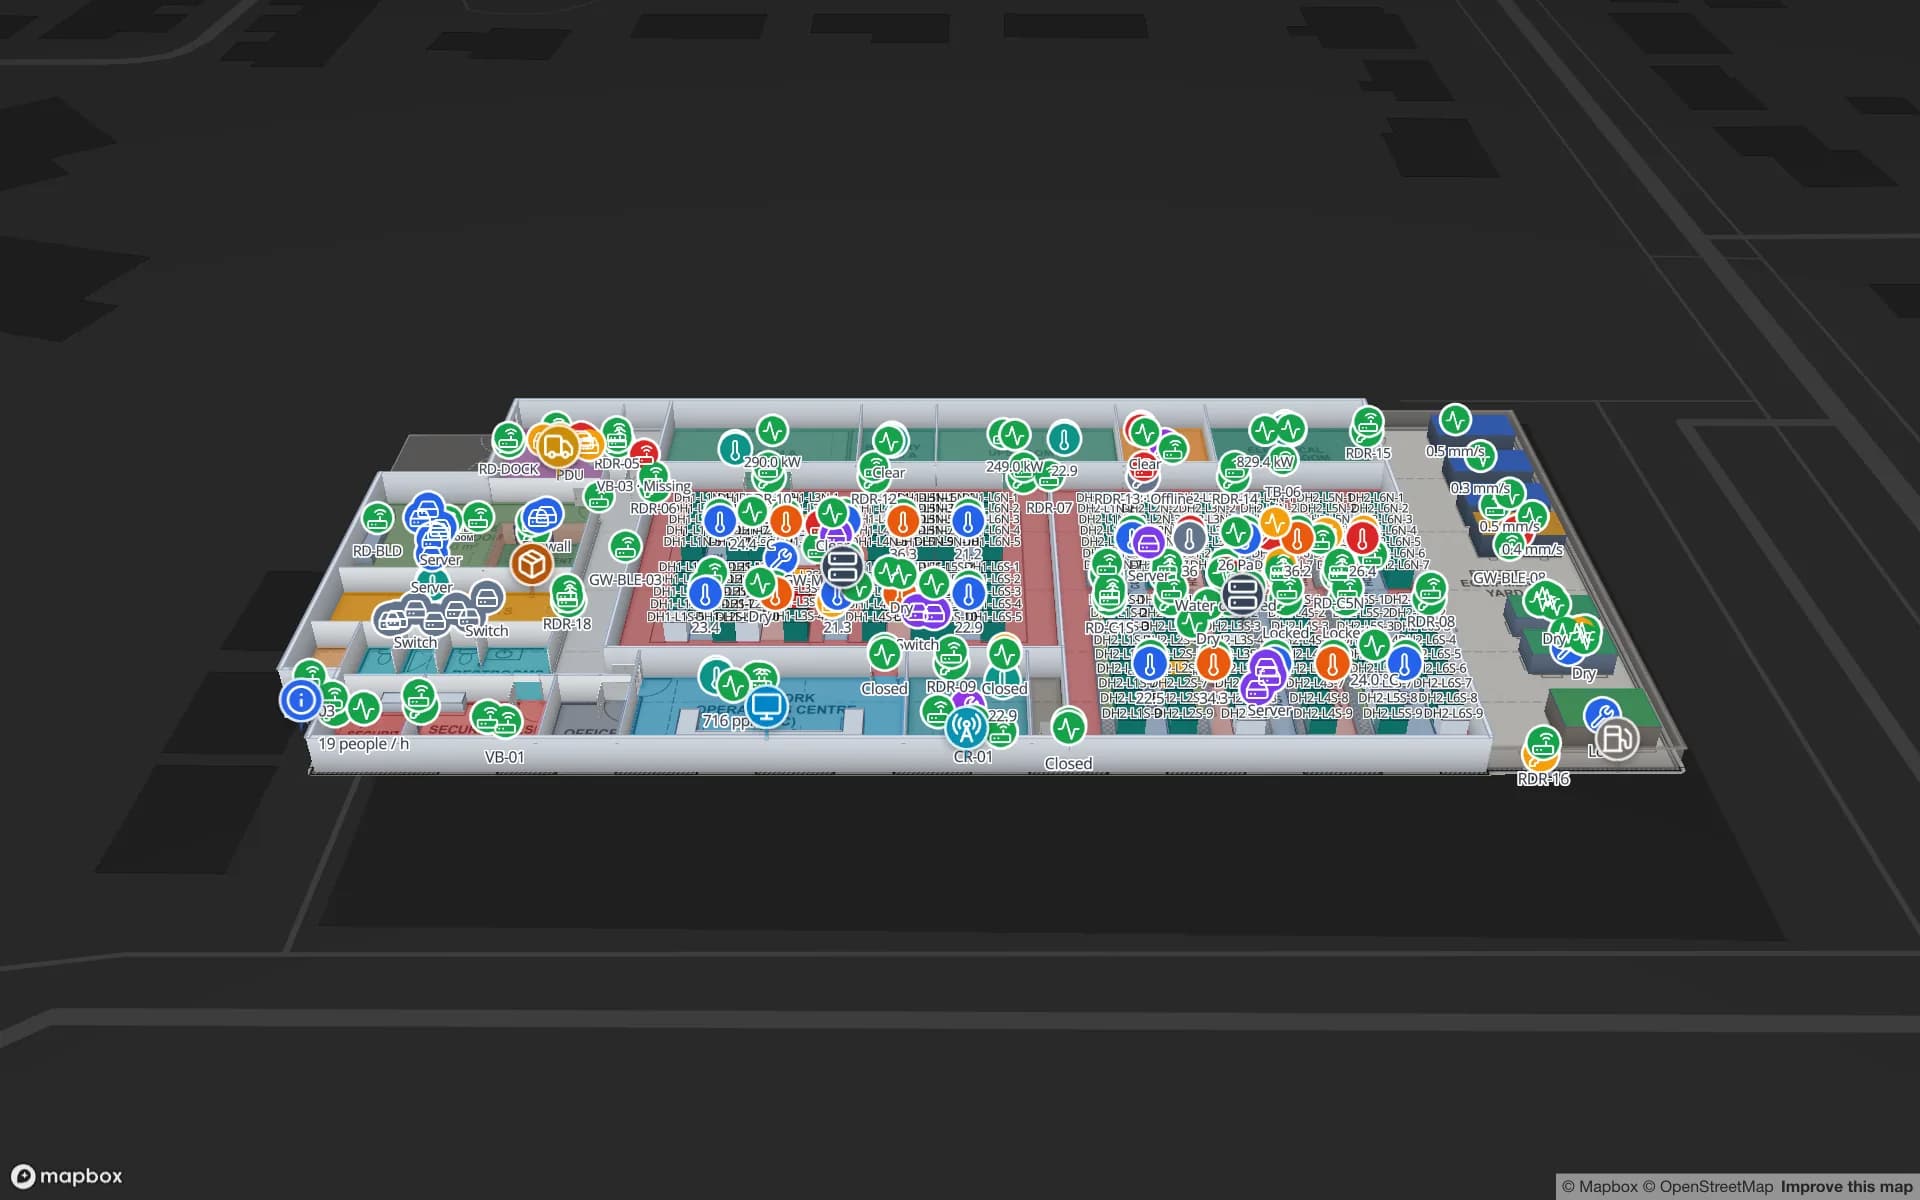
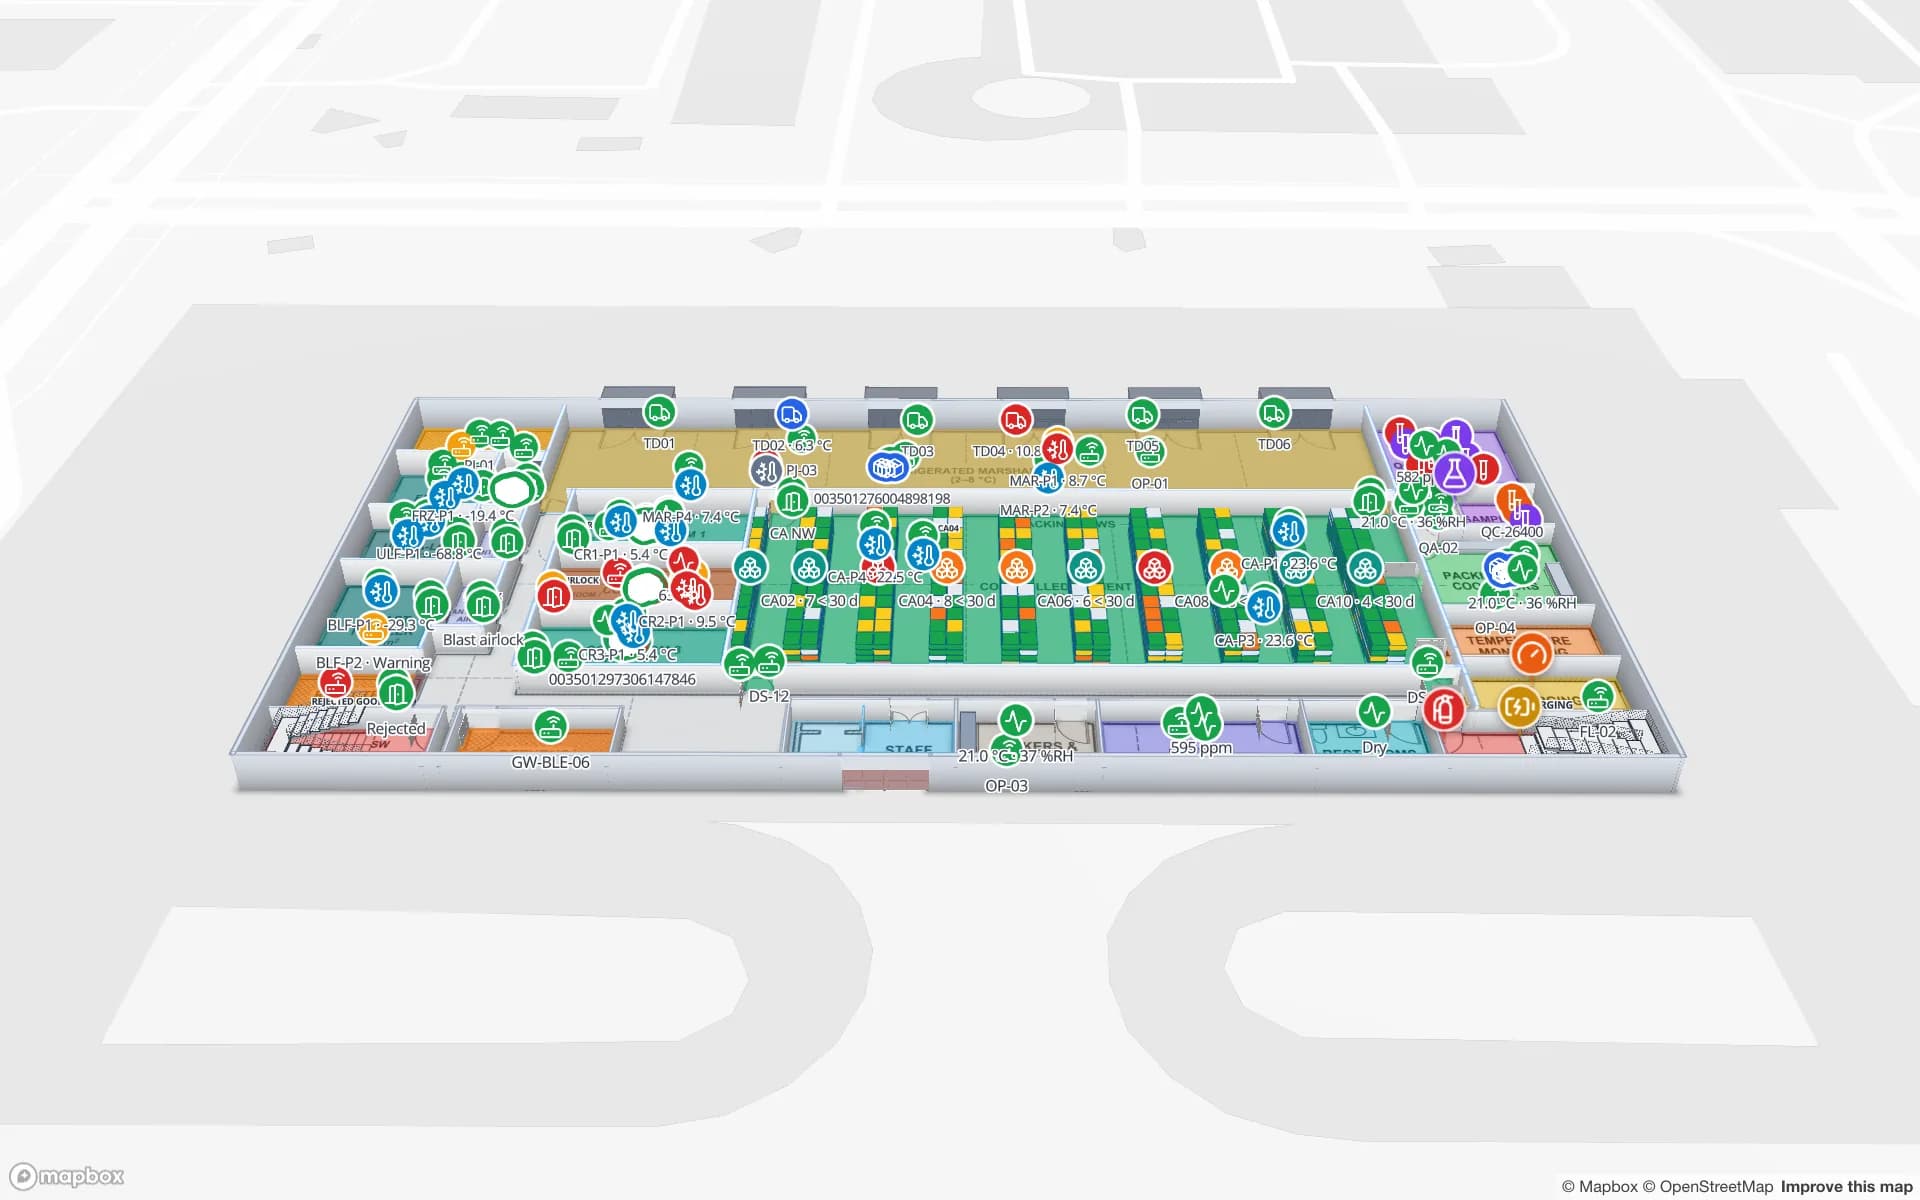
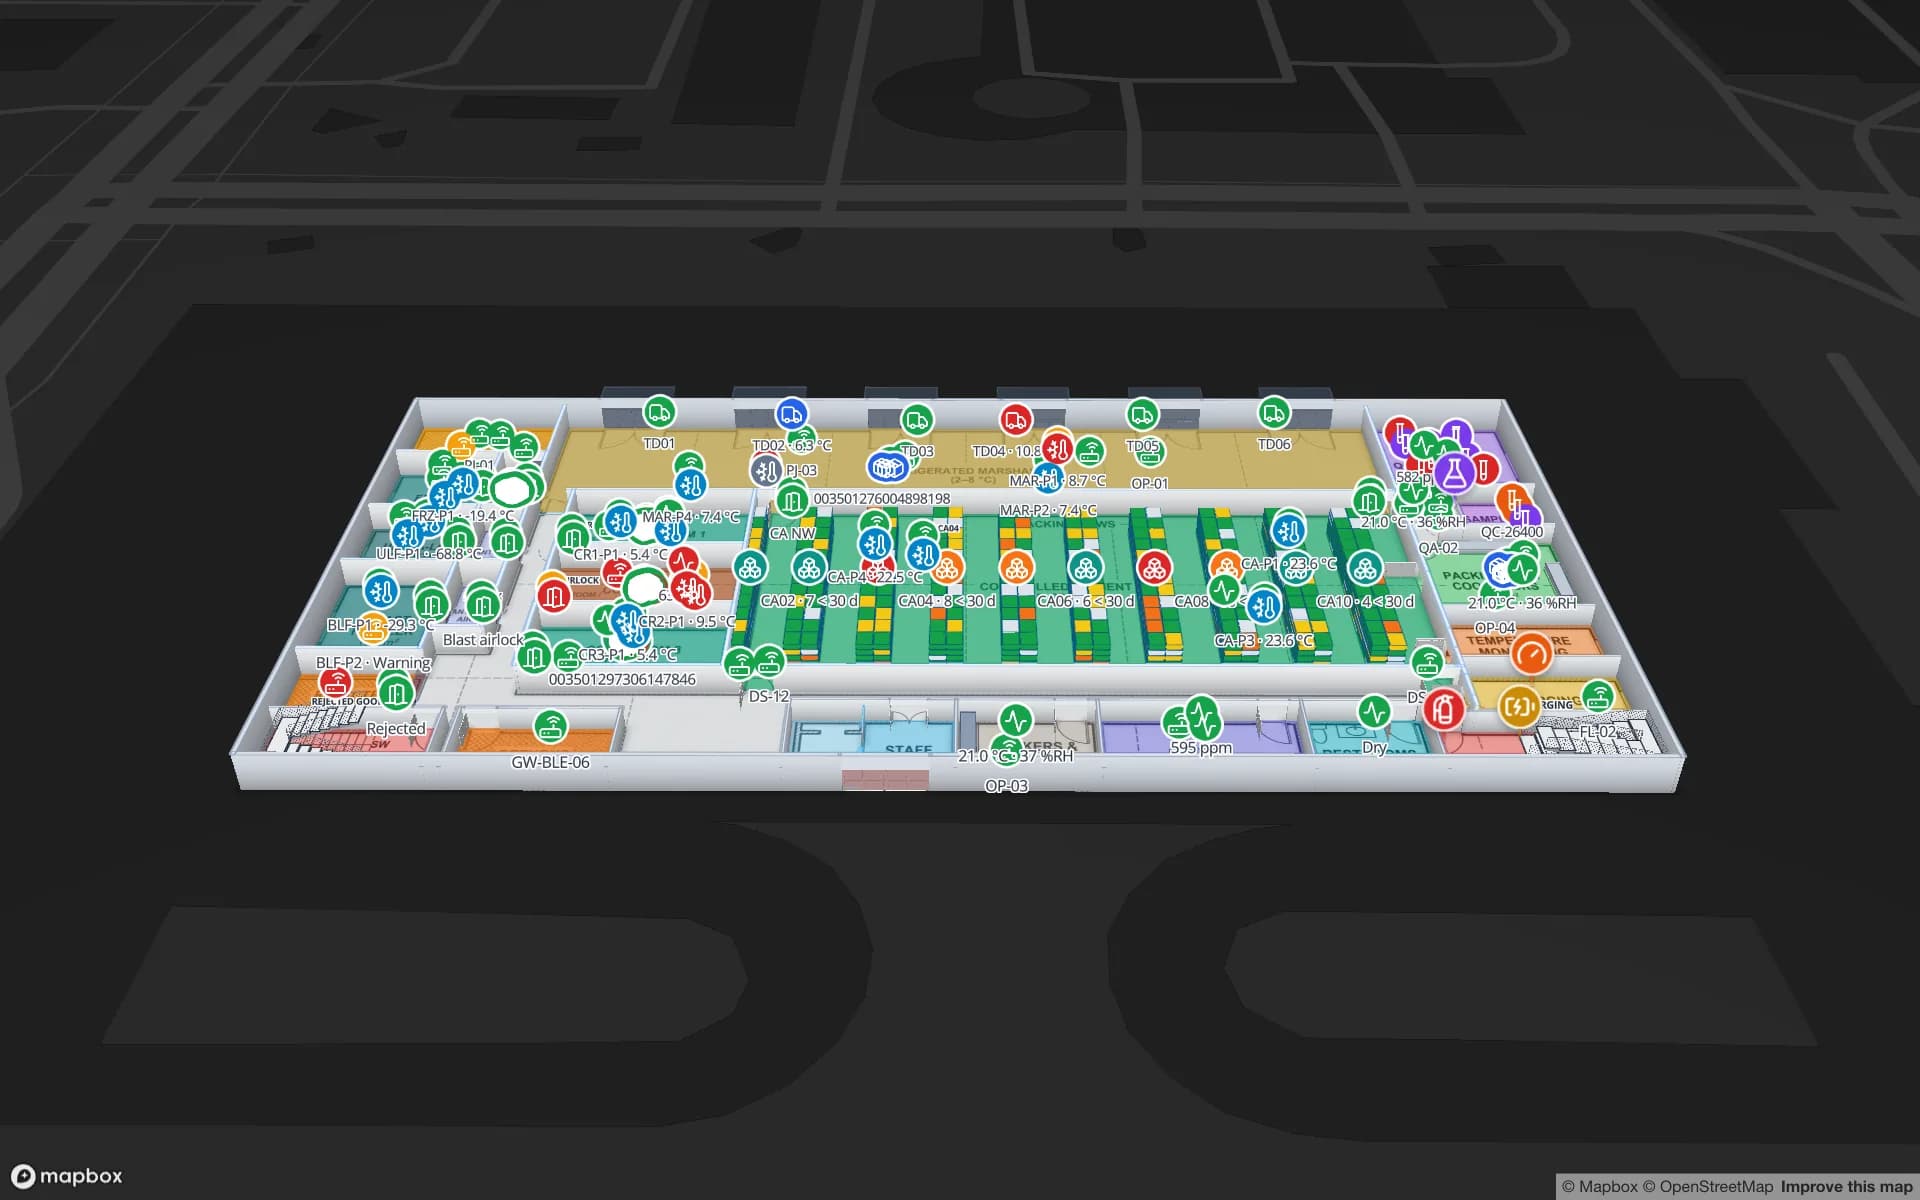
Polar Pharma — Cold Storage & QC Facility, a pharmaceutical cold store & qc lab demo, in the Spatial Map 3D viewer with live device markers
Polar Pharma — Cold Storage & QC Facility
Polar Pharma (demo): eight temperature zones tinted from their probes, cold-room doors, reefer docks and the QC laboratory on a two-floor map.
Temperature zones in the Polar Pharma demo
8
How often alert rules are checked
15 s
Export formats: PDF, Excel, CSV, JSON
4
Free trial, no credit card
7 days

What warehouse temperature monitoring involves

A warehouse that stores temperature-sensitive goods usually has three kinds of space: ambient or controlled-ambient storage, cold rooms (often 2–8 °C for pharmaceuticals) and freezers. Each has probes or data loggers that report through a gateway (wired, Wi-Fi, LoRaWAN or similar) to a monitoring platform, and that platform keeps the readings and calls someone out of hours.

What that stack rarely gives the people on site is the building. A list says probe 14 reads 9.1 °C. The map shows that probe 14 is in Cold Room 2, its door has been open for twelve minutes and the pallets inside are on hold. Spatial Map adds that layer and leaves the probes, the platform and your procedures where they are.
Cold rooms and freezers tinted on the map

Each zone, room and freezer is a shape on the floor plan, named the way your probes are named. A data link binds the readings table to those shapes, and style rules colour them: in band, warning, excursion. Value badges show the live number over the probe or the room, and door sensors sit on the same map.

In the Polar Pharma demo, Cold Room 2 turns red at 9.1 °C, outside its 2–8 °C band, while its door is held open and the other zones stay in band. The facility’s Temperature Zones & Excursions, Temperature Probes & Mapping and Cold-Zone Doors reports are built from the same tables.

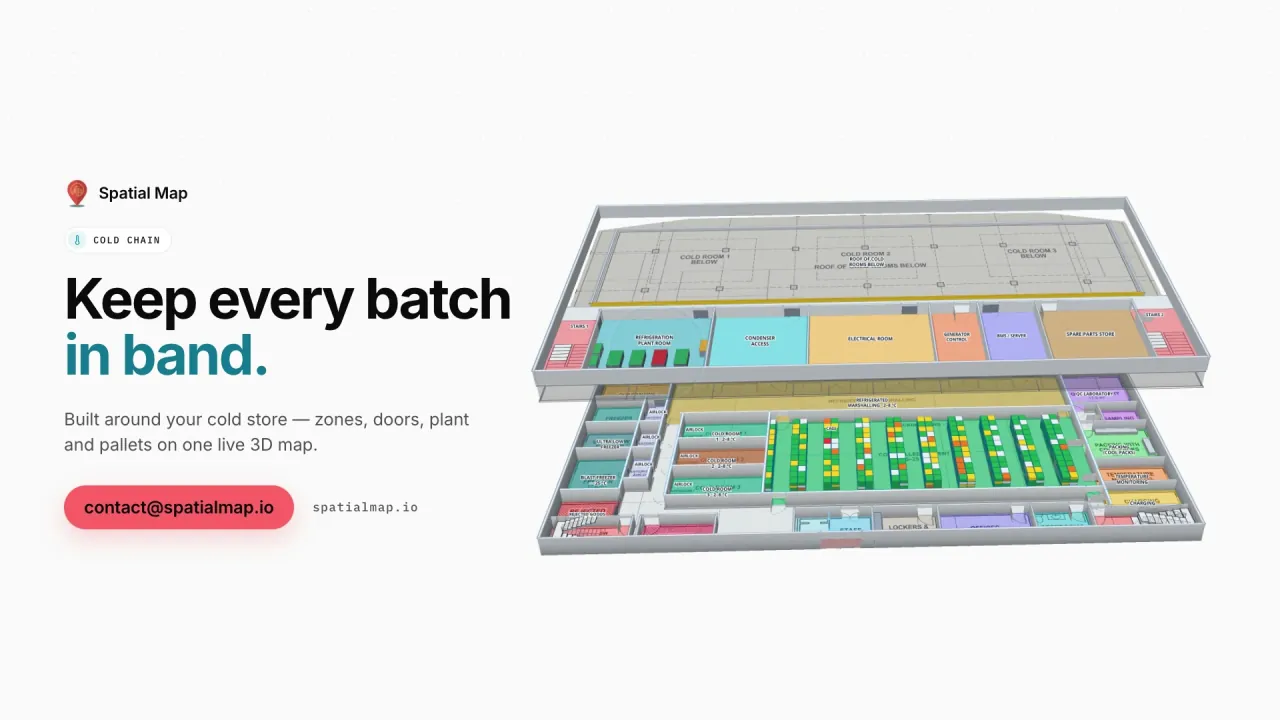
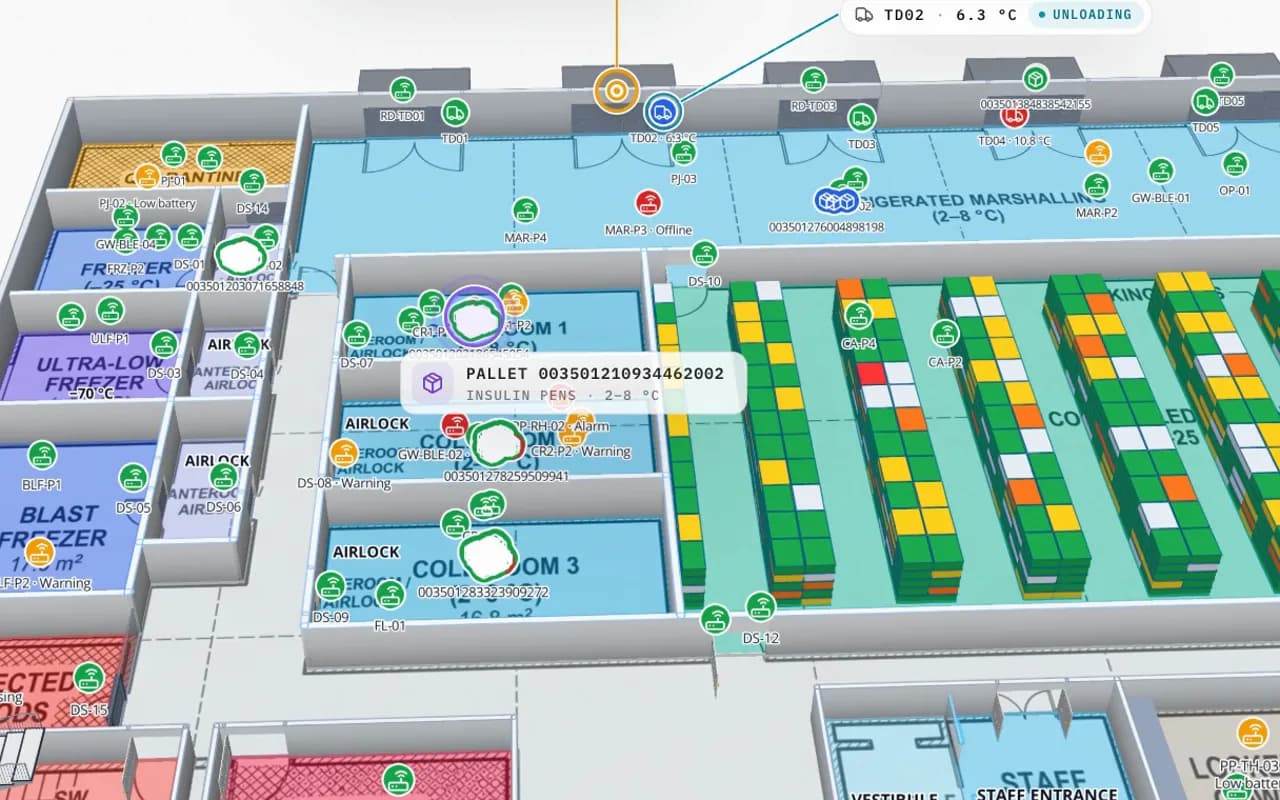
Polar Pharma cold store in 3D: cold rooms, freezers and pallet locations coloured by status, with an insulin pallet and a dock-door reading called out
Polar Pharma — Cold Storage & QC Facility
Polar Pharma (demo): cold rooms, freezers and the refrigerated marshalling area with pallet locations coloured by status, and a pallet read at a dock door with its temperature.

Heatmaps and history playback

A probe or logger layer can also be drawn as a heatmap, weighted by the reading, so warm readings that cluster near a dock door or a ceiling heater stand out across the floor. The heat stops at walls and closed doors and shows one floor at a time. It is a picture for discussion, not a calculated temperature field.

Every change to a table row is kept: each probe has a row history in the detail drawer (up to 500 recent changes), and the History player replays a night shift so you can see when a zone started to drift and how long it took to recover.

Alerts for excursions and silent sensors

Alert rules run on the readings table, are checked every 15 seconds and resolve themselves when the zone is back in band. Each has a severity, a message template and the roles or members to notify:

  • Out of band for a while — “matches for N minutes”, for example above 8 °C for 15 minutes, so a door opening does not raise an alert every time.
  • A sensor not reporting — “not updated for N minutes”, for a probe, logger or gateway that has gone quiet.
  • Several at once — “number of matching items” against a threshold, for example three or more probes out of band.
  • On the map — acknowledge or resolve, and Show on map flies to the zone.

Temperature mapping studies and the audit file

Under GDP and wider GxP expectations, storage areas for medicines are usually temperature-mapped before use and after significant changes. Data loggers are placed on a grid across the space, often empty and loaded and in summer and winter, to find hot and cold spots and decide where the permanent monitoring probes go. The EU GDP guidelines and WHO guidance on temperature mapping of storage areas describe the approach; the protocol and acceptance criteria are yours.

Spatial Map can hold the picture around that work: logger positions as markers on the plan, the study’s exported readings in a table, a heatmap of where readings ran warm, and cold-chain reports exported to PDF, Excel, CSV or JSON or shared as a read-only report link. It is not a validated system, it does not write a mapping protocol or report, and it does not make a site compliant. Your validated monitoring system, your loggers’ records and your QA procedures remain the record.

Temperature alerts, in practice

How common monitoring questions map to Spatial Map alert conditions. The thresholds are examples; take bands and delays from your product specifications and SOPs.

What you want to catchAlert conditionExample rule
A cold room out of band for a whileMatches for N minutesTemperature above 8 °C for 15 minutes
A freezer far out of rangeA row matchesFreezer reading above −15 °C, high severity
A probe, logger or gateway gone quietNot updated for N minutesNo new reading for 30 minutes
A cold-room door held openMatches for N minutes, on the door tableDoor state open for more than 5 minutes
A wider problemNumber of matching items vs a thresholdThree or more probes above their band

Alerts appear in the app (bell, toast, Alerts page). There is no email, SMS or push, so keep your monitoring platform’s out-of-hours call-outs. More on alerts.

How Spatial Map does it

Temperature on the floor plan in four steps

  1. 01

    Draw zones and probes

    Import the floor plan and draw cold rooms, freezers, ambient zones and doors, named the way your probes are.

  2. 02

    Feed the readings

    Your platform or gateway posts readings with the write API, Spatial Map polls its REST endpoint, or you upload a logger export.

  3. 03

    Set bands and alerts

    Style rules colour each zone by band; alert rules catch excursions and sensors that stop reporting.

  4. 04

    Report and export

    Build cold-chain reports and export them to PDF, Excel, CSV or JSON for QA, or share a read-only report link.

Temperature monitoring by site

Pharma cold stores

Cold rooms, freezers and controlled-ambient zones tinted from probes, with doors, reefer docks and QC holds alongside.

Store fridges and freezers

Cabinet temperatures on all three floors of a store, with a Cold-Chain Sensors report the manager can export.

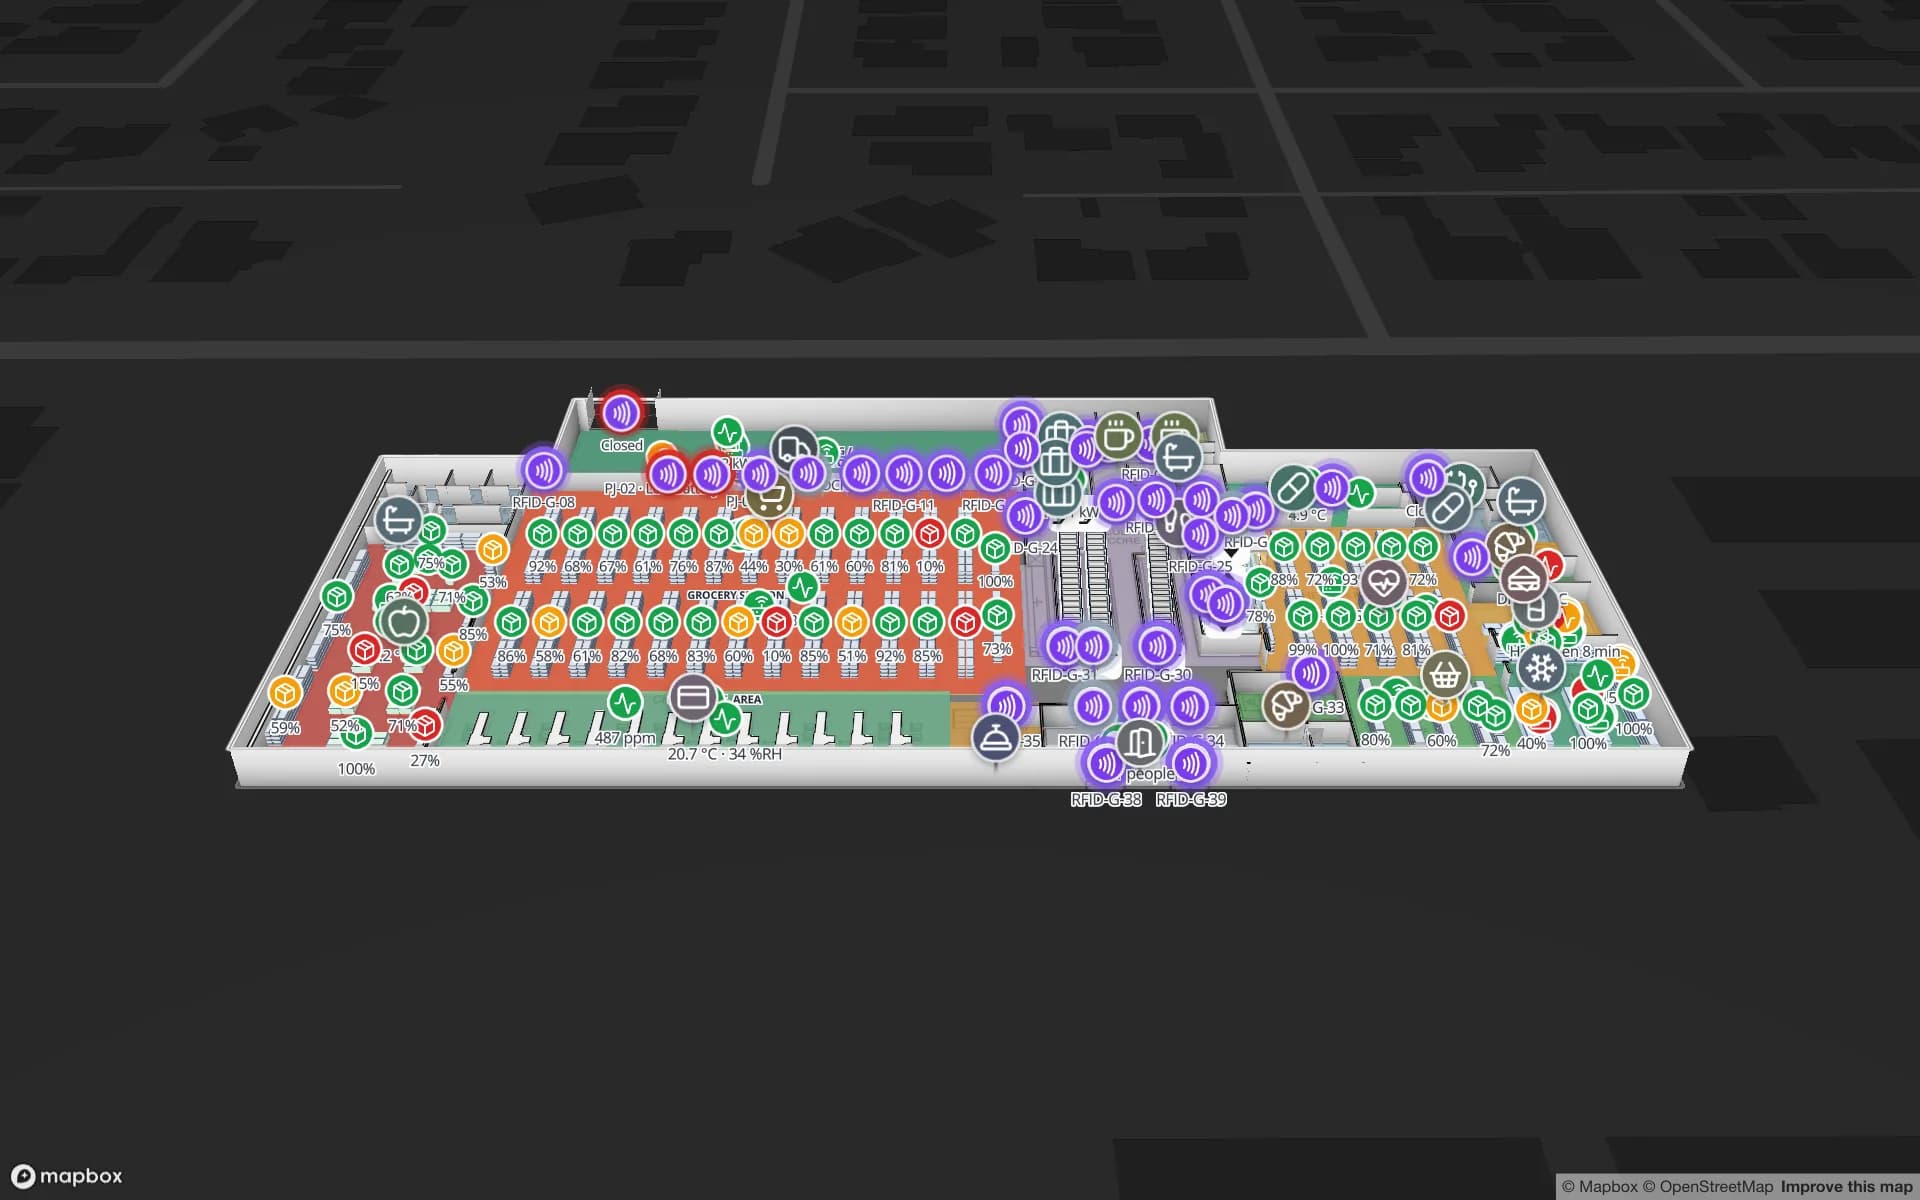
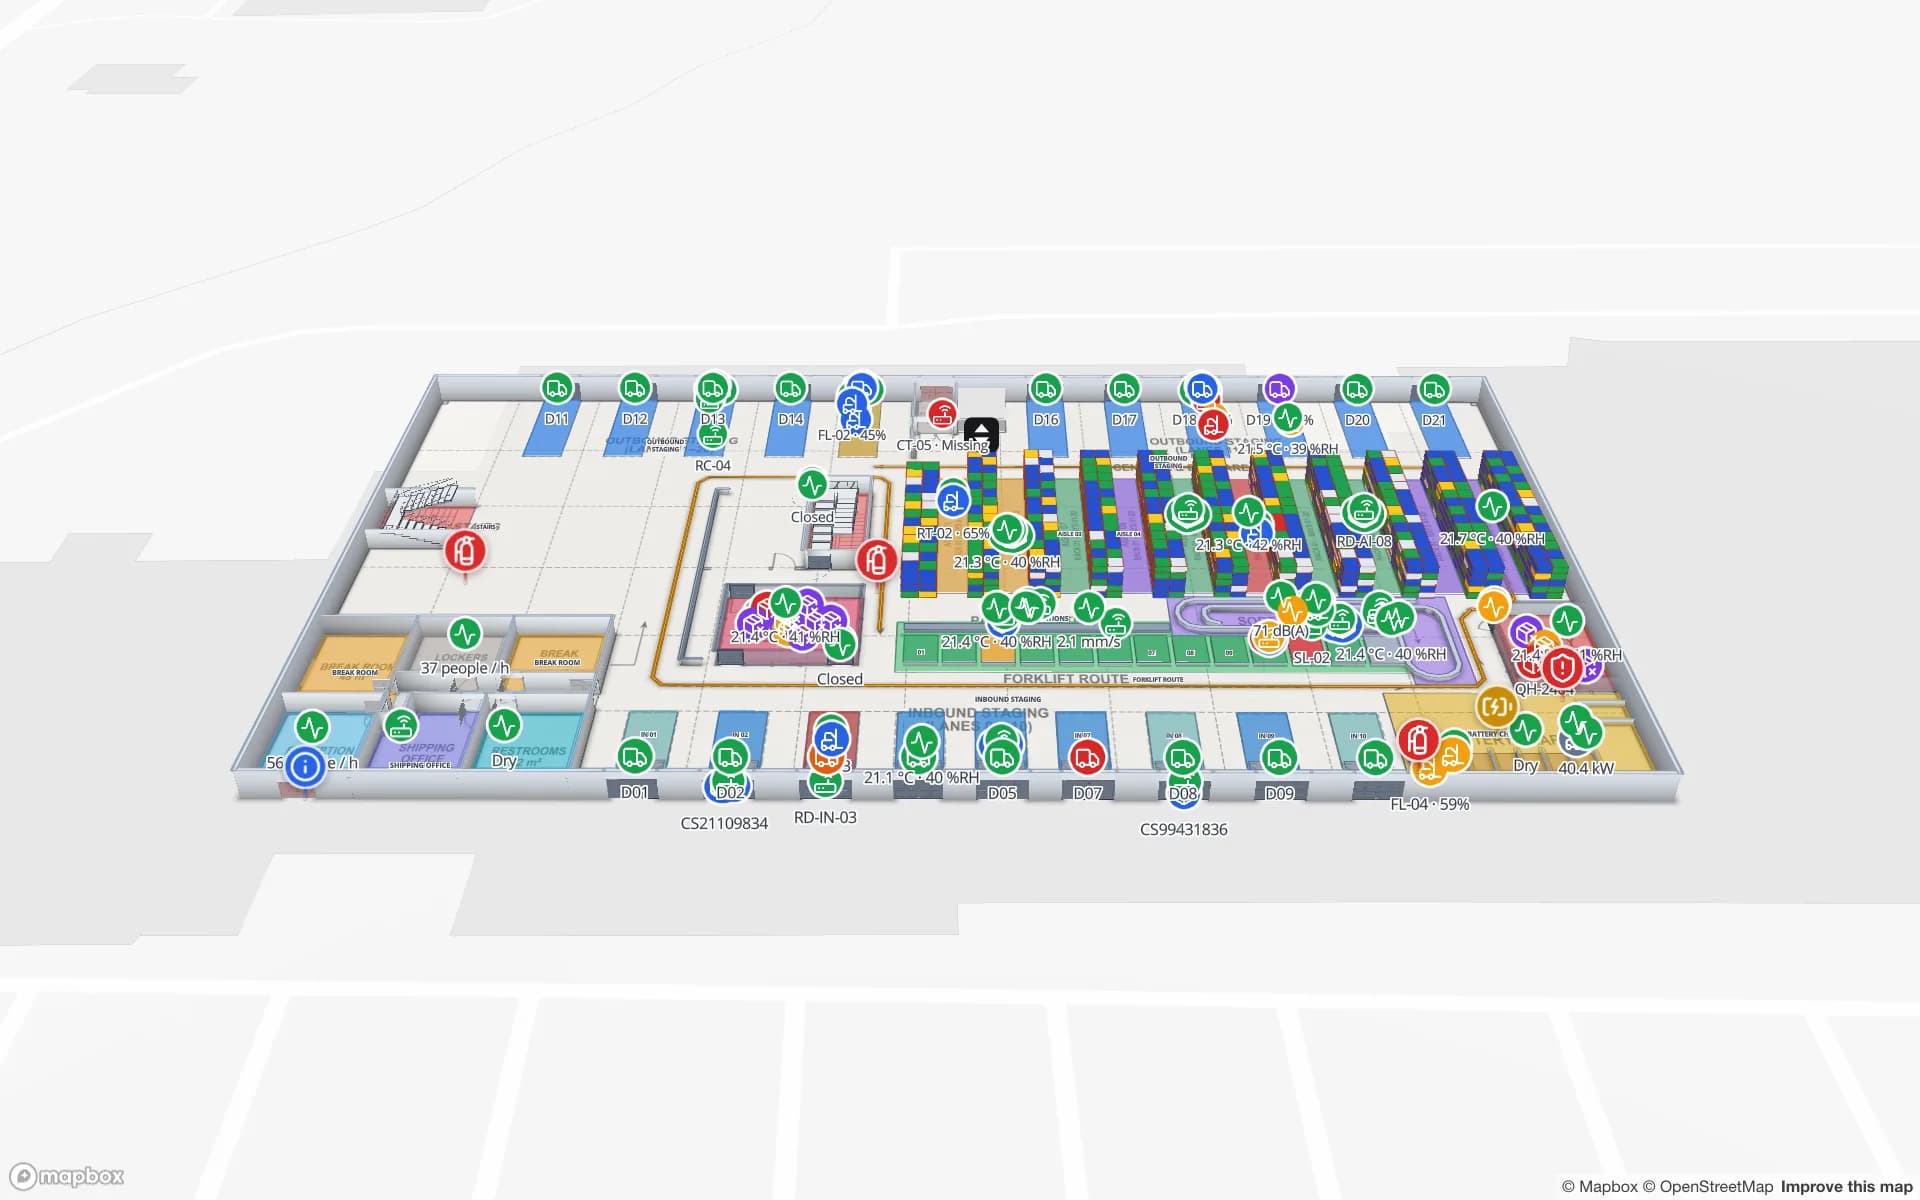
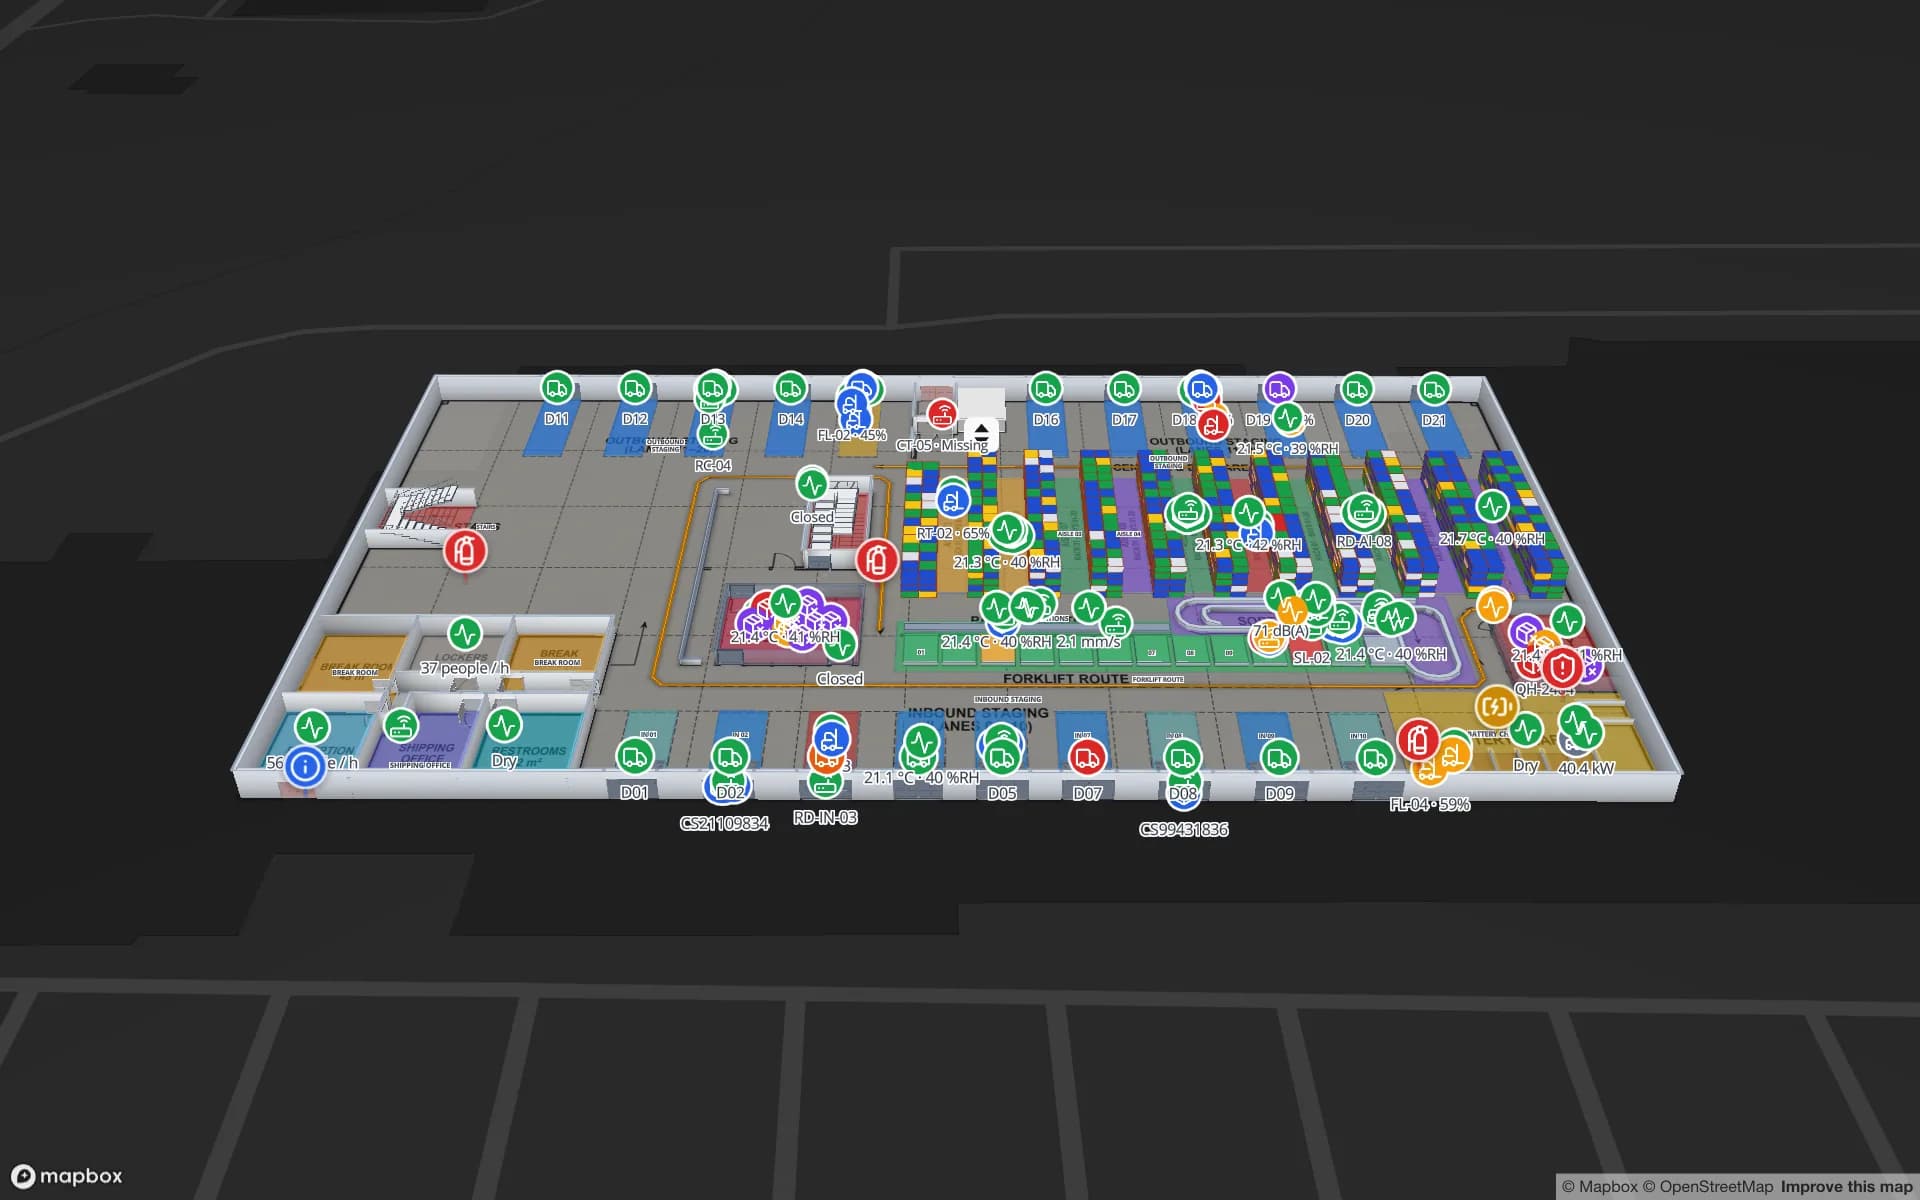
Ambient warehouse zones

Temperature and humidity across storage zones of a fulfillment centre, next to the racks they protect.

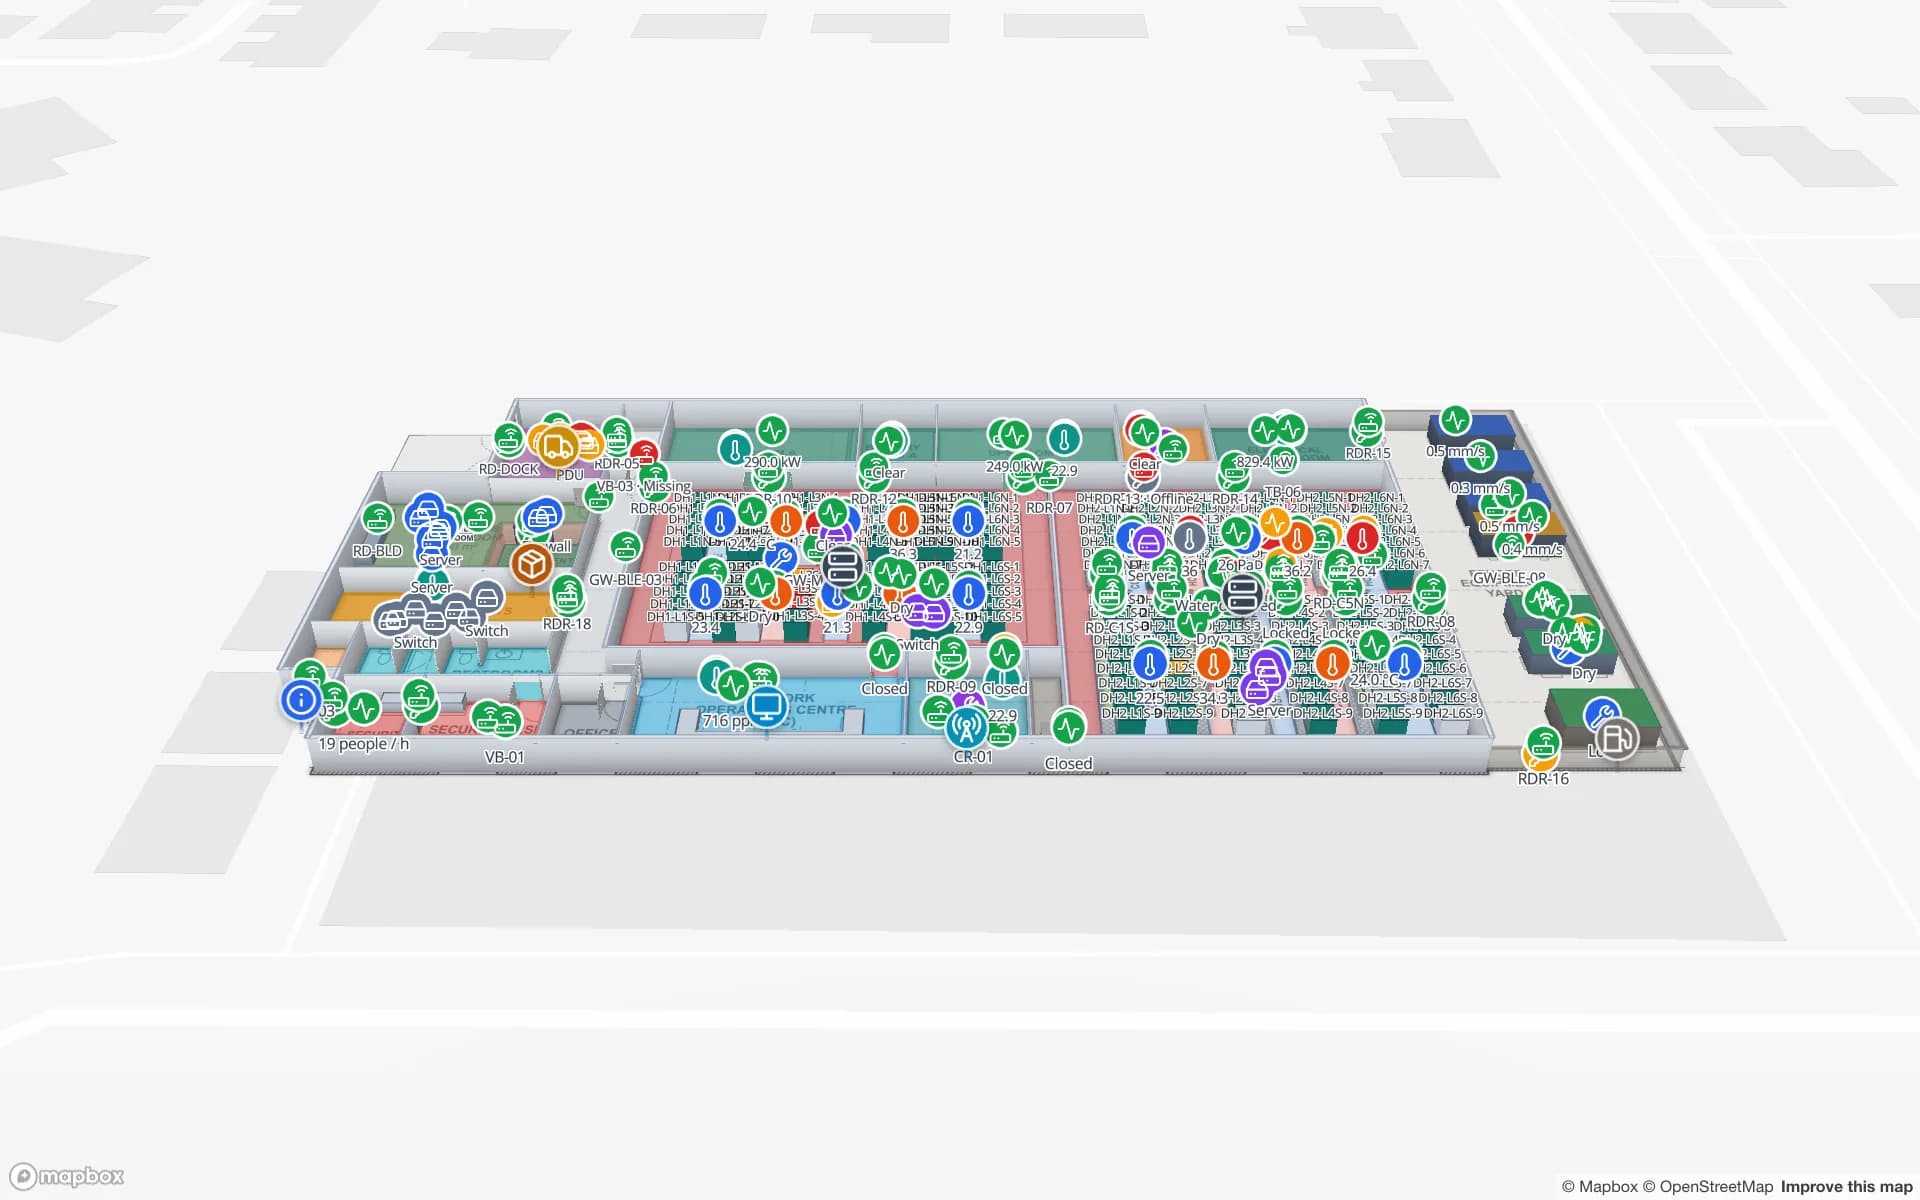
Data-hall aisles

Hot- and cold-aisle readings beside the cabinets and plant rooms of a data hall.

See it on real demo facilities

Fictional names, real floor plans, live sensors, RFID, BLE tags and gateways — open any of them in the browser.

All 13 demo facilities

Warehouse temperature monitoring — frequently asked questions

No. Spatial Map shows readings, excursions and their location on a floor plan and keeps reports you can export. It is not validated for GxP use and does not replace your validated monitoring system, your data loggers or your QA procedures.

Any whose gateway, cloud platform or BMS can post JSON rows over HTTPS or expose a REST endpoint. Spatial Map does not connect to sensors directly. Logger exports in CSV or Excel can be uploaded to back-fill a table.

Yes, in the app. A rule such as “above 8 °C for 15 minutes” is checked every 15 seconds, notifies the roles or members you choose through the bell, a toast and the Alerts page, and resolves itself when the room is back in band. There is no email, SMS or push.

A “not updated for N minutes” rule raises an alert for that probe or gateway, and a style rule can colour it as stale on the map, so a silent probe is not mistaken for a stable room.

As a visual aid. You can place logger positions on the plan, load the exported readings and show where the space ran warm or cold. The mapping protocol, the analysis and the report stay in your validated process.

Every change to a row is kept, with up to 500 recent changes per row in the detail drawer and the History player for replay. Reports can be exported for a shift, a week or a month; your monitoring platform stays the long-term archive.

A 7-day free trial covers up to 5 facilities with no credit card. Pro is $60 a month or $600 a year for up to 4 facilities. The relay between your system and Spatial Map, and larger estates, are quoted as custom services or custom development.

See every cold room’s temperature where it is.

Start a free trial and open the Polar Pharma demo, or send us your floor plan and a logger export and we will show you your own warehouse.