Tracking · RTLS software

RTLS software that puts the positions you already have on a 3D map

Spatial Map is vendor-neutral RTLS software for the map, history and reporting side of a real-time location system. It does not compute positions. Your RFID readers and portals, your BLE gateways and positioning engine, or your UWB system already work out where each tag is, or which zone read it. They write that to a Spatial Map table, and Spatial Map places every tag on a multi-floor 3D map of the building, with history playback, heatmaps, alerts, reports, Ask AI and share links on top.

Last updated:

No credit card. Runs in the browser. Pro is $60/month for up to 4 facilities. Book a demo

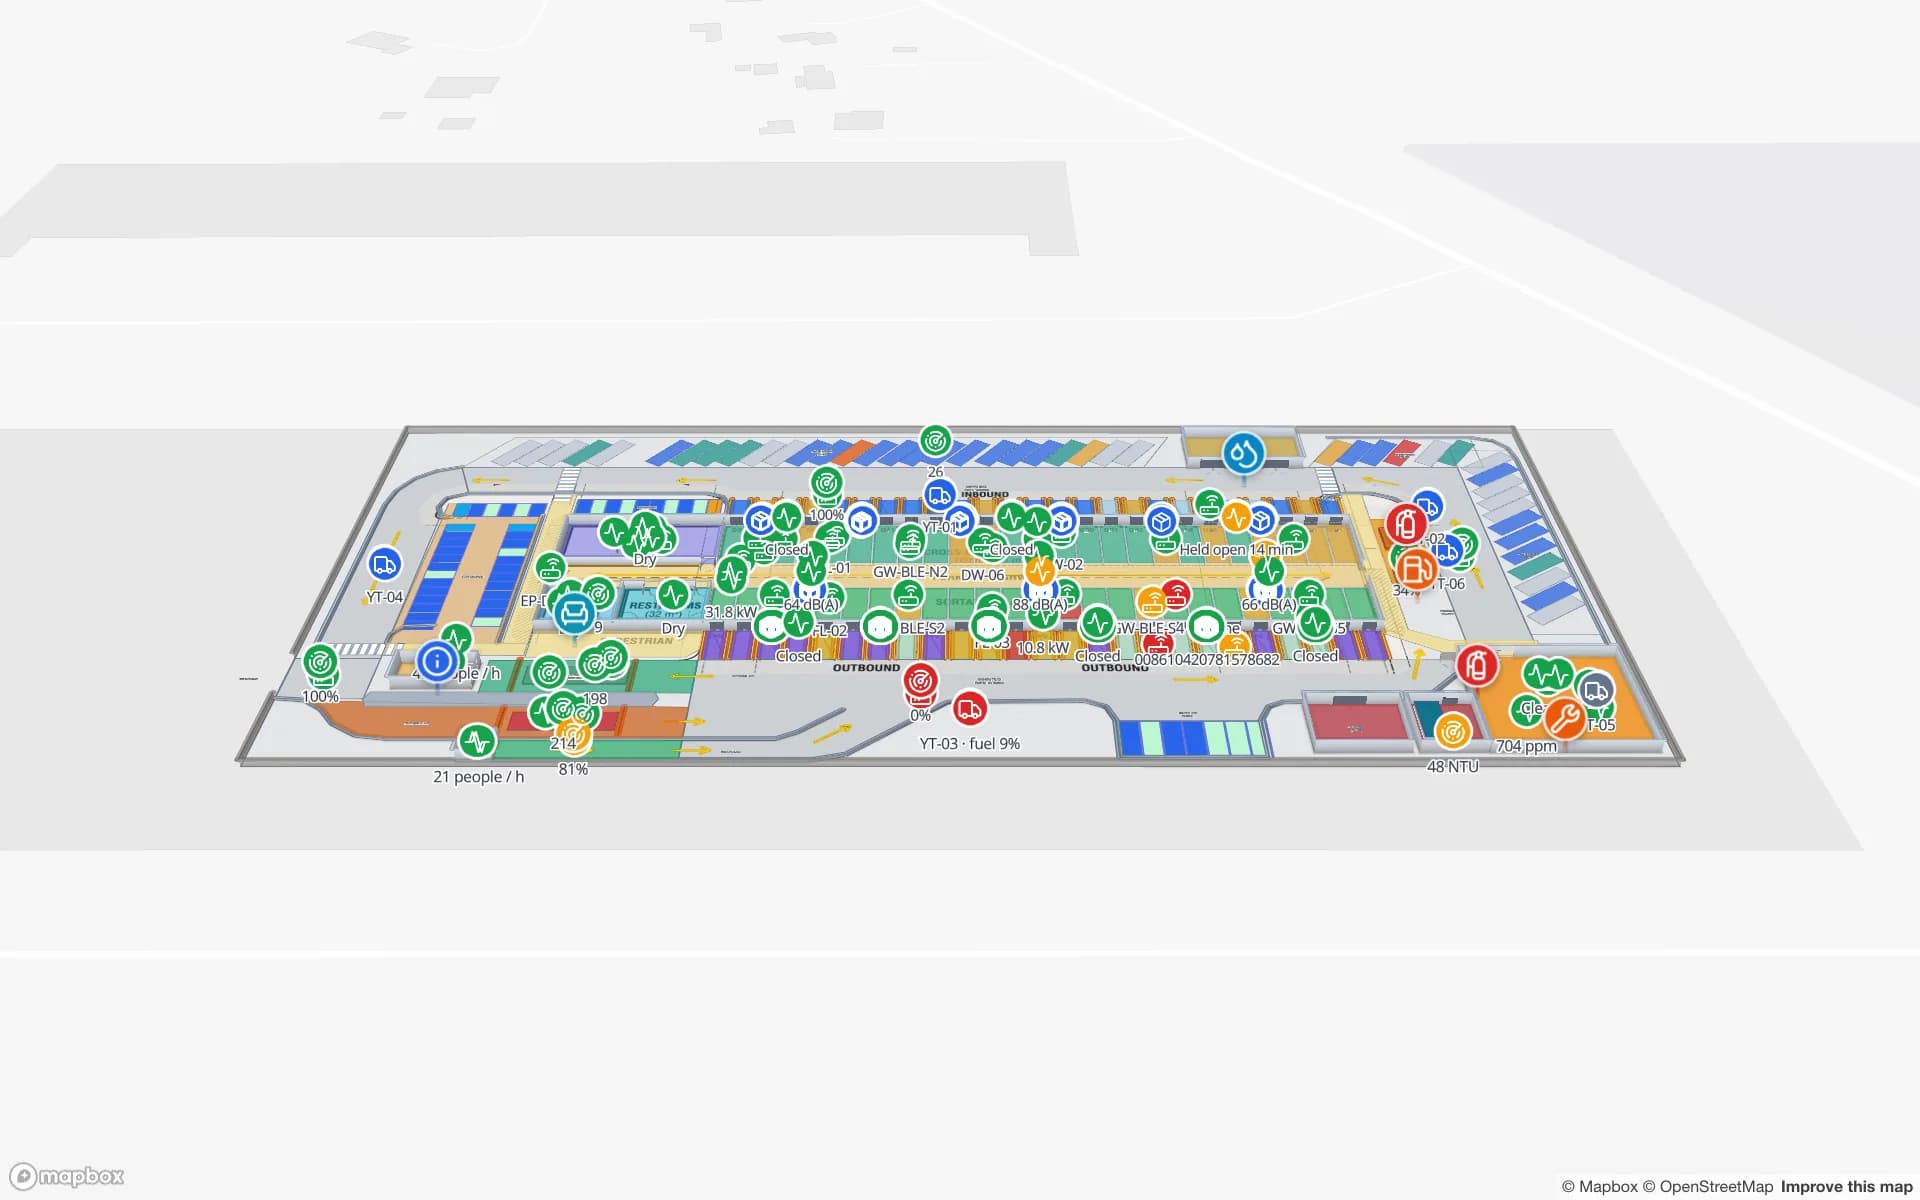
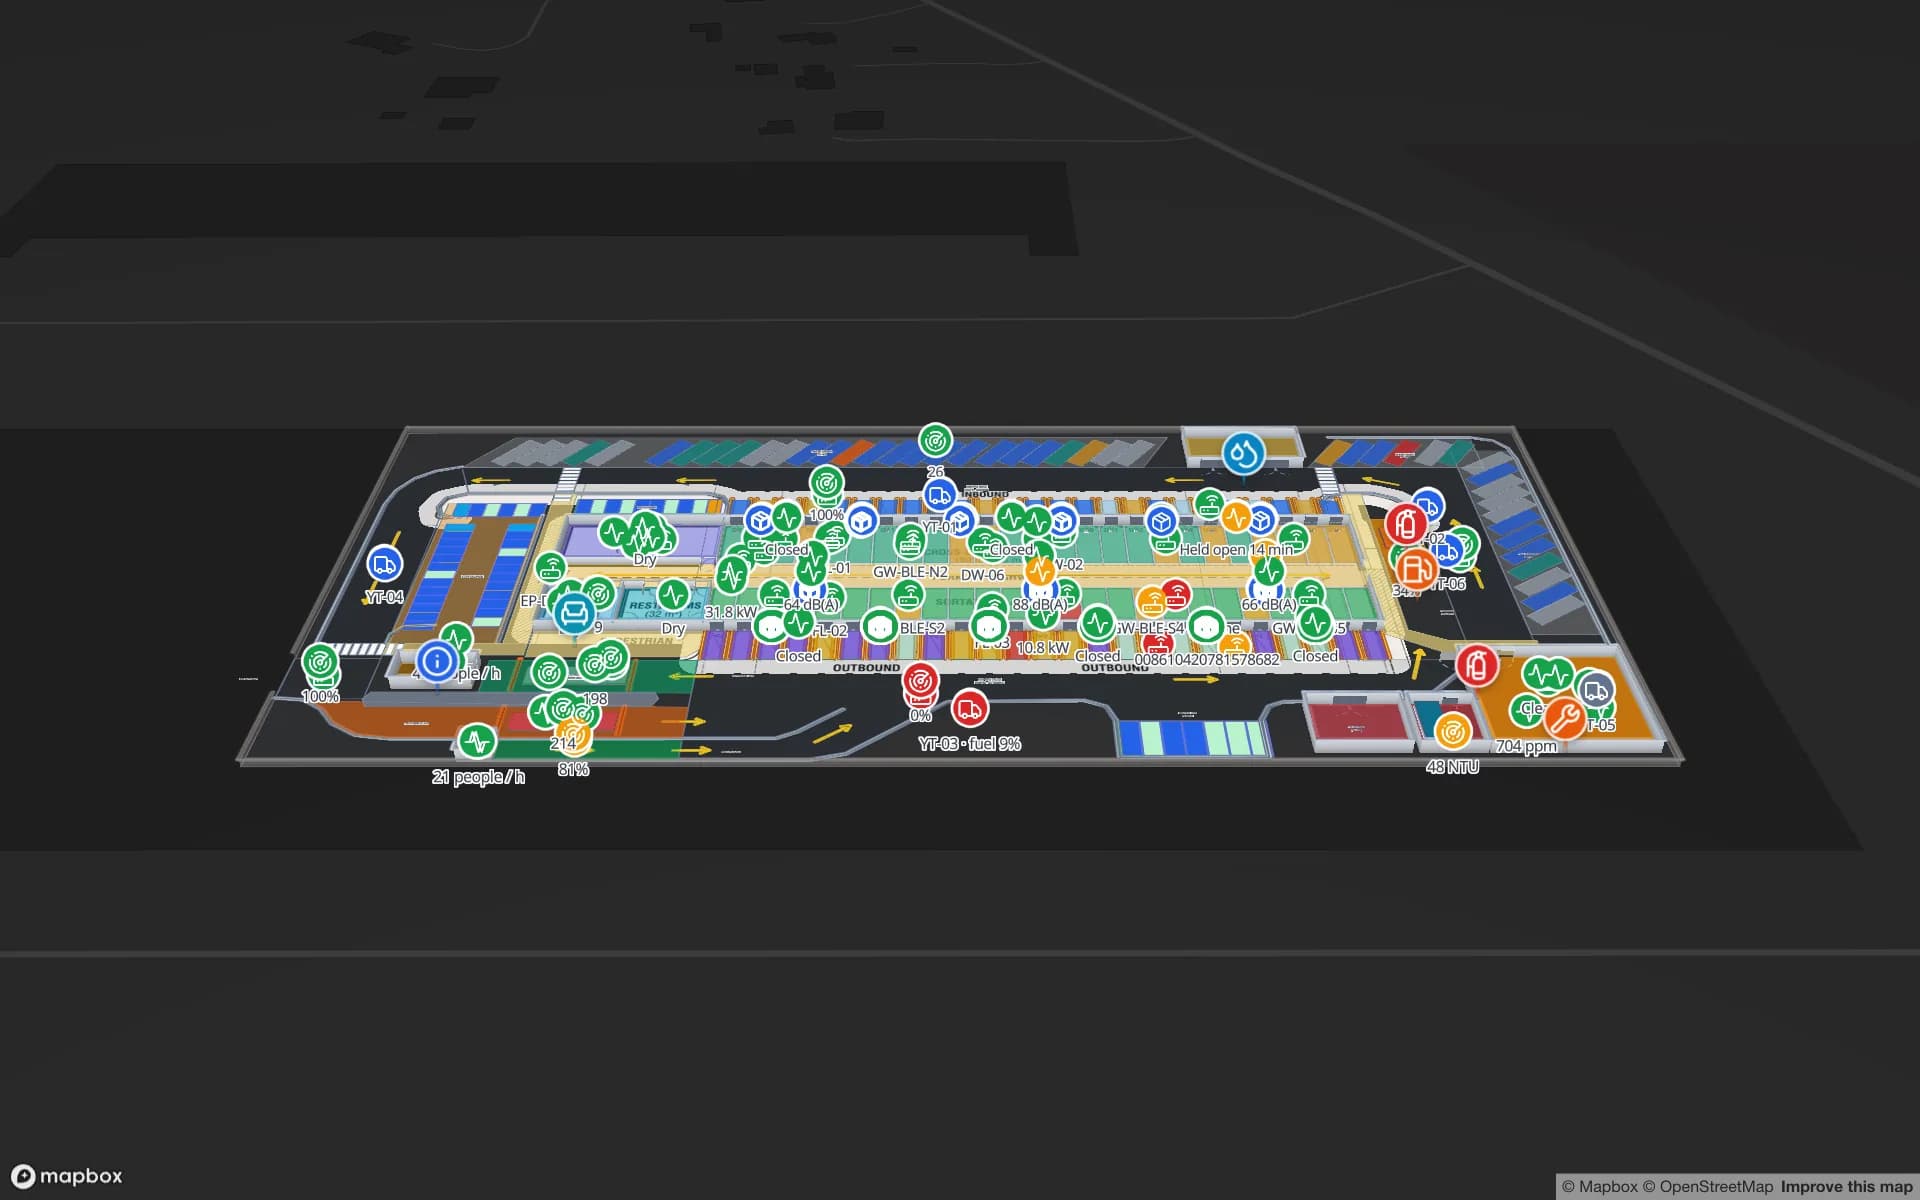
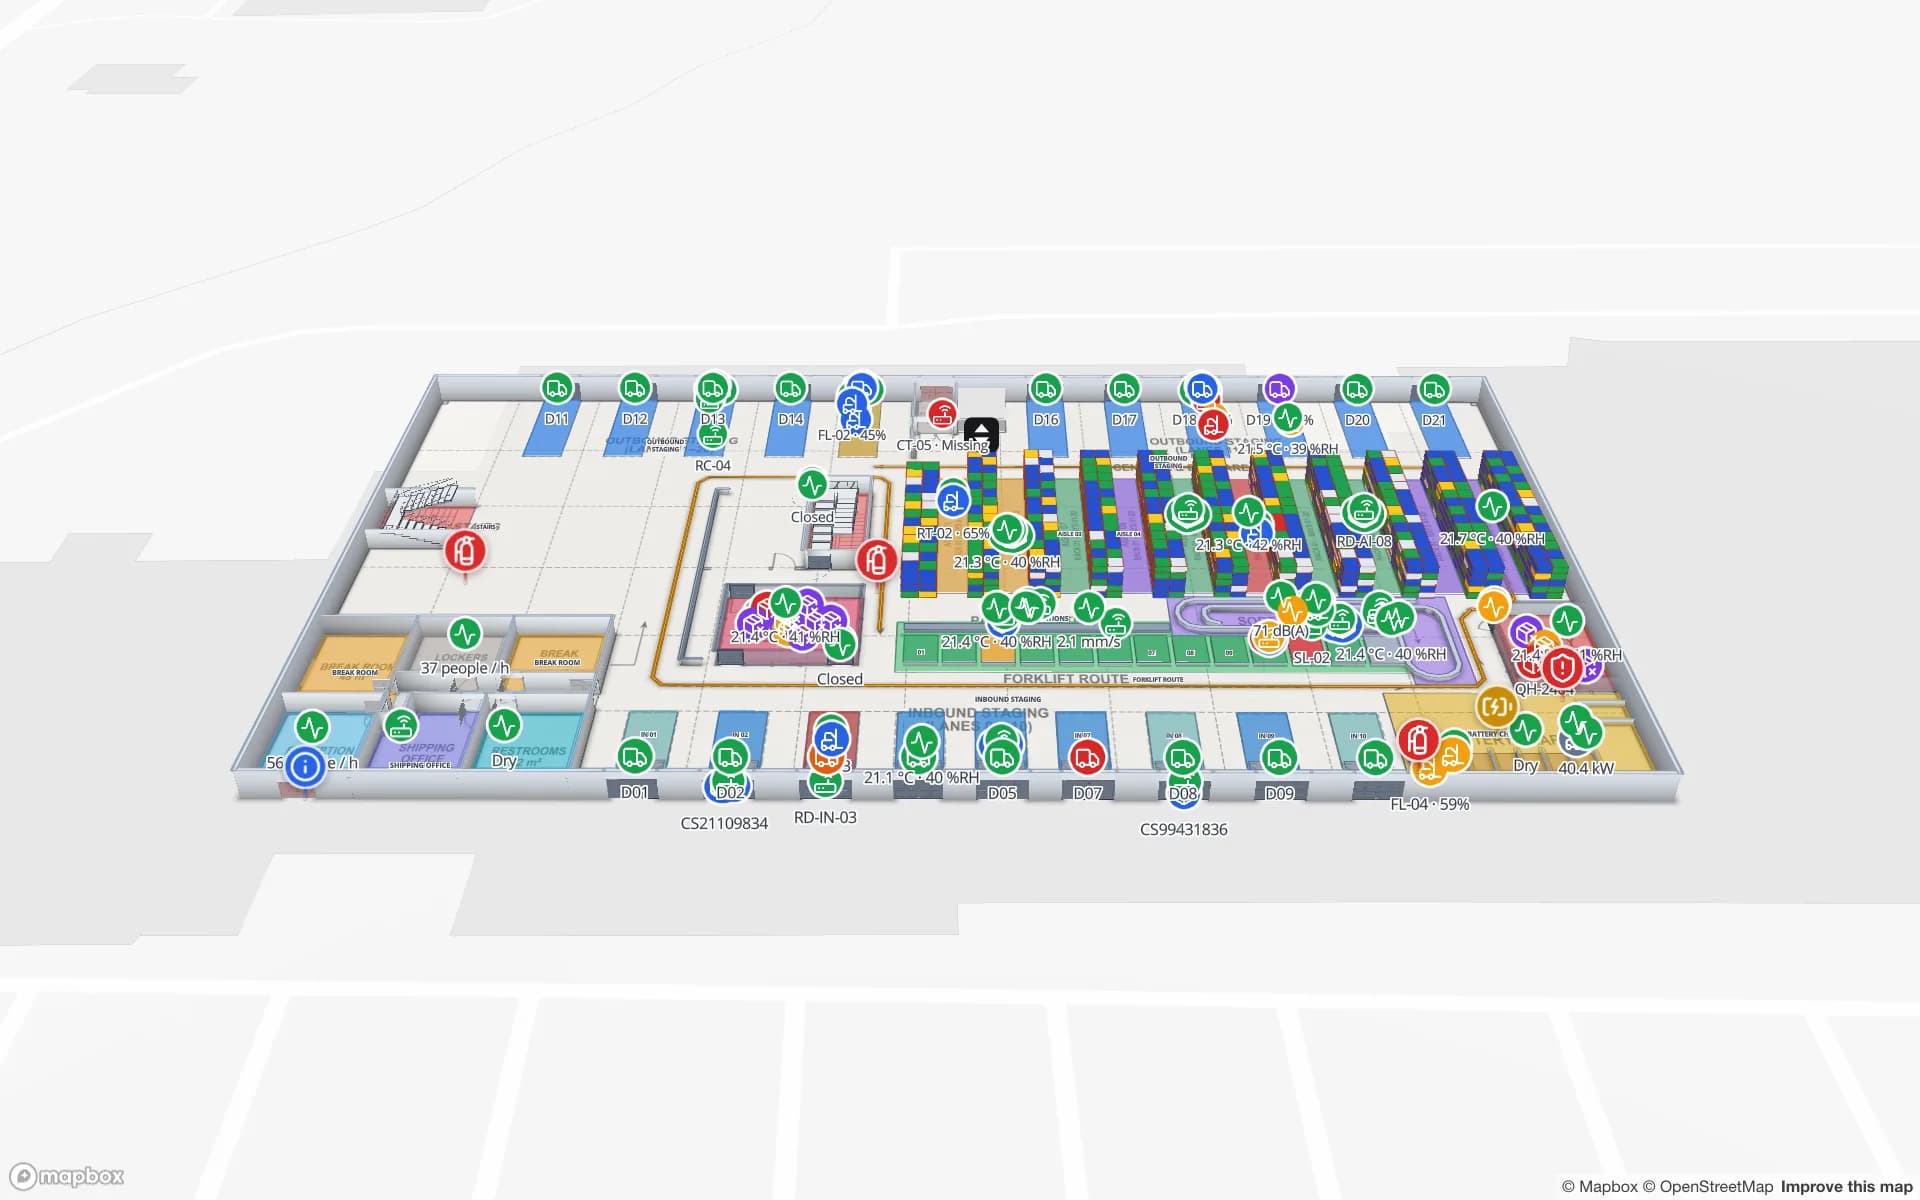
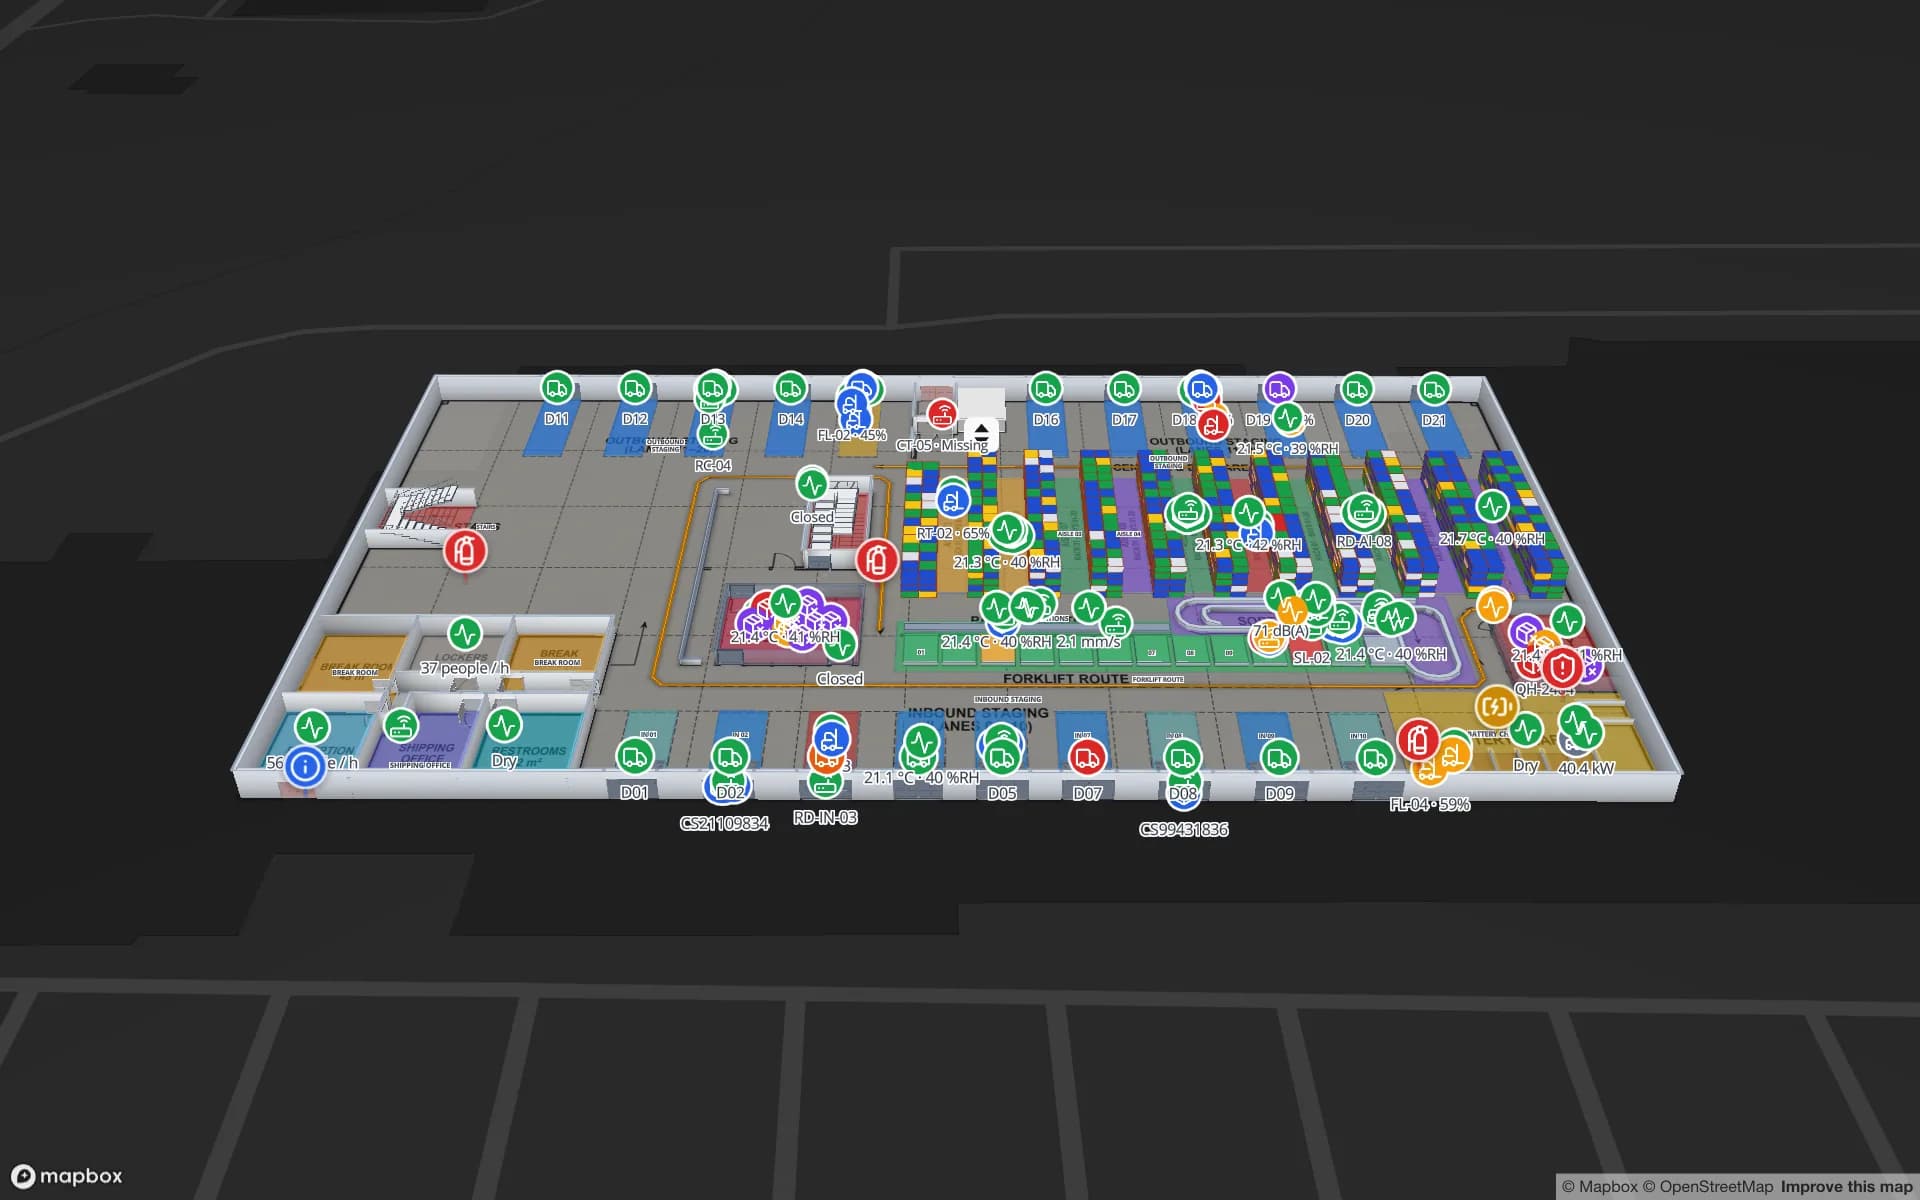
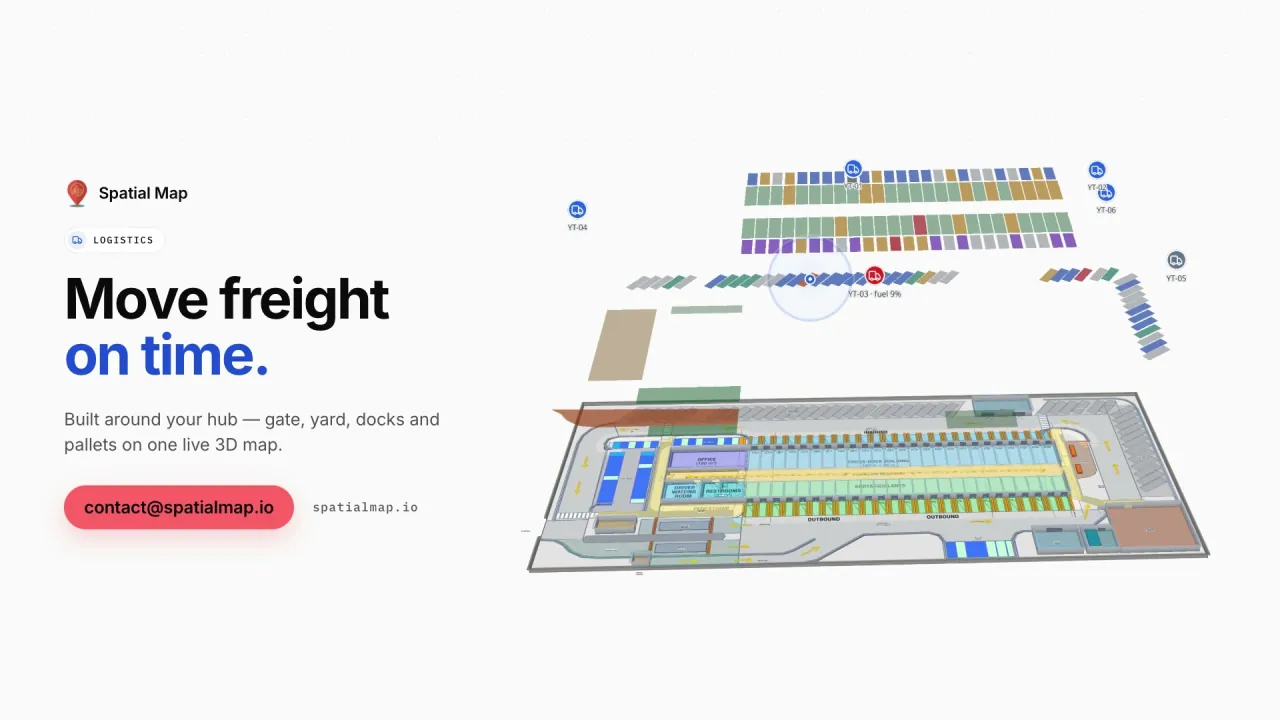
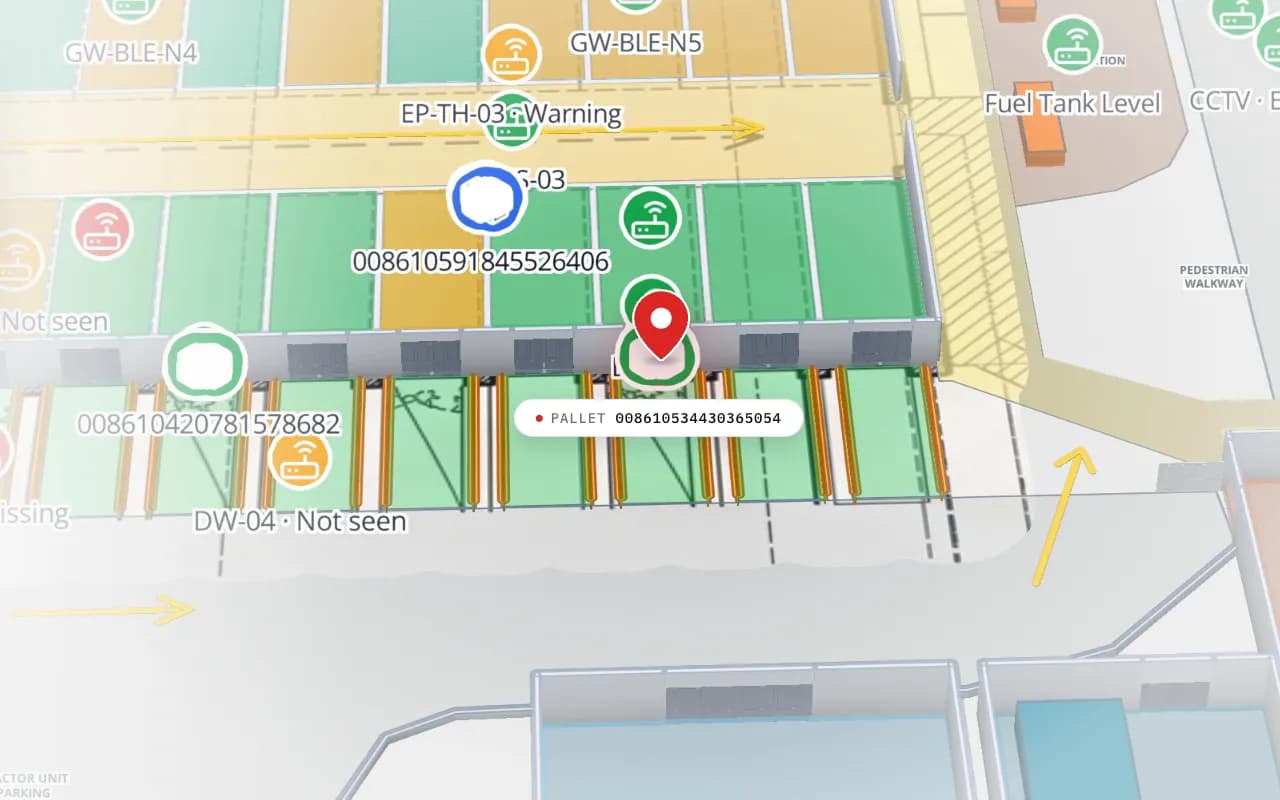
Eastport Cross-Dock in 3D: the view moves from the trailer yard to the dock doors, with RFID pallet markers, gateway markers and a dock reader marked “not seen”
Eastport Cross-Dock Freight Hub
Eastport Cross-Dock (demo): RFID pallet reads at the dock doors, BLE gateways on the same map, and a door reader that has not been seen. Cut from the Logistics film.
Demo facilities with live RFID, BLE and sensor data
13
Ways in: write API, REST polling, file upload
3
Recent changes kept per row for trails and history
500
Free trial, no credit card
7 days

Which part of an RTLS this is

A real-time location system has four parts. Tags on the things you track. Infrastructure that hears them: RFID readers and antennas, BLE gateways, UWB anchors. A location engine that turns raw reads into “tag 0417 is in Bay 3” or “tag 0417 is at these coordinates”. And applications that people use to act on it.

Many RTLS vendors ship all four as one package, which is convenient until a site runs RFID at the docks, BLE on carts and UWB on forklifts from three suppliers. Spatial Map is only the fourth part, and it does not care which radio sits underneath. Each system writes to its own table, and all of them appear on one map of the building.
Zone-level reads or x/y positions

Every RTLS output falls into one of two shapes, and Spatial Map handles both. Which one you get depends on your hardware and engine, not on the map:

  • What arrives — zone level: a reader, portal, gateway or zone name per tag (“Dock 4”, “Store Room B”). x/y: a coordinate per tag, often with a floor and a height.
  • How it is shown — zone level: the room, door or rack with that name lights up, lists its tags or is coloured by count. x/y: each tag is a live marker that moves on the right floor.
  • What you install — zone level: a reader or gateway per zone you need to tell apart. x/y: a denser grid of gateways or anchors, a survey and a positioning engine.
  • What it answers — zone level: which room, which door, did it pass. x/y: where in the aisle, how close to the line, which way it is heading.
  • What to send — zone level: the zone name exactly as the shape is named on the map. x/y: longitude and latitude, so most engines’ local x/y in metres needs one conversion in the relay, from two or three surveyed points.

What Spatial Map adds on top of the positions

Once positions or reads land in a table, a data link binds them to the map, and the same rows feed everything else:

  • Multi-floor 3D map — tags on the floor they are on, among racks, rooms, stairs and lifts you trace once from a PDF or DWG plan.
  • History playback — every change to a row is kept, so the History player replays where a tag went between ten and noon.
  • Heatmaps — any point layer as a heatmap, weighted by a number field if you like. The heat stops at walls and closed doors.
  • Alerts — rules per table such as “not updated for 10 minutes” or “more than 5 items in the zone”, delivered in the app (bell, toast, Alerts page) with Show on map.
  • Reports and share links — reports exported to PDF, Excel, CSV or JSON, and read-only links for a client or auditor.
  • Ask AI (beta) — plain-language questions such as “which carts were in Bay 3 this morning?”, answered from the facility’s tables with links that show the items on the map.
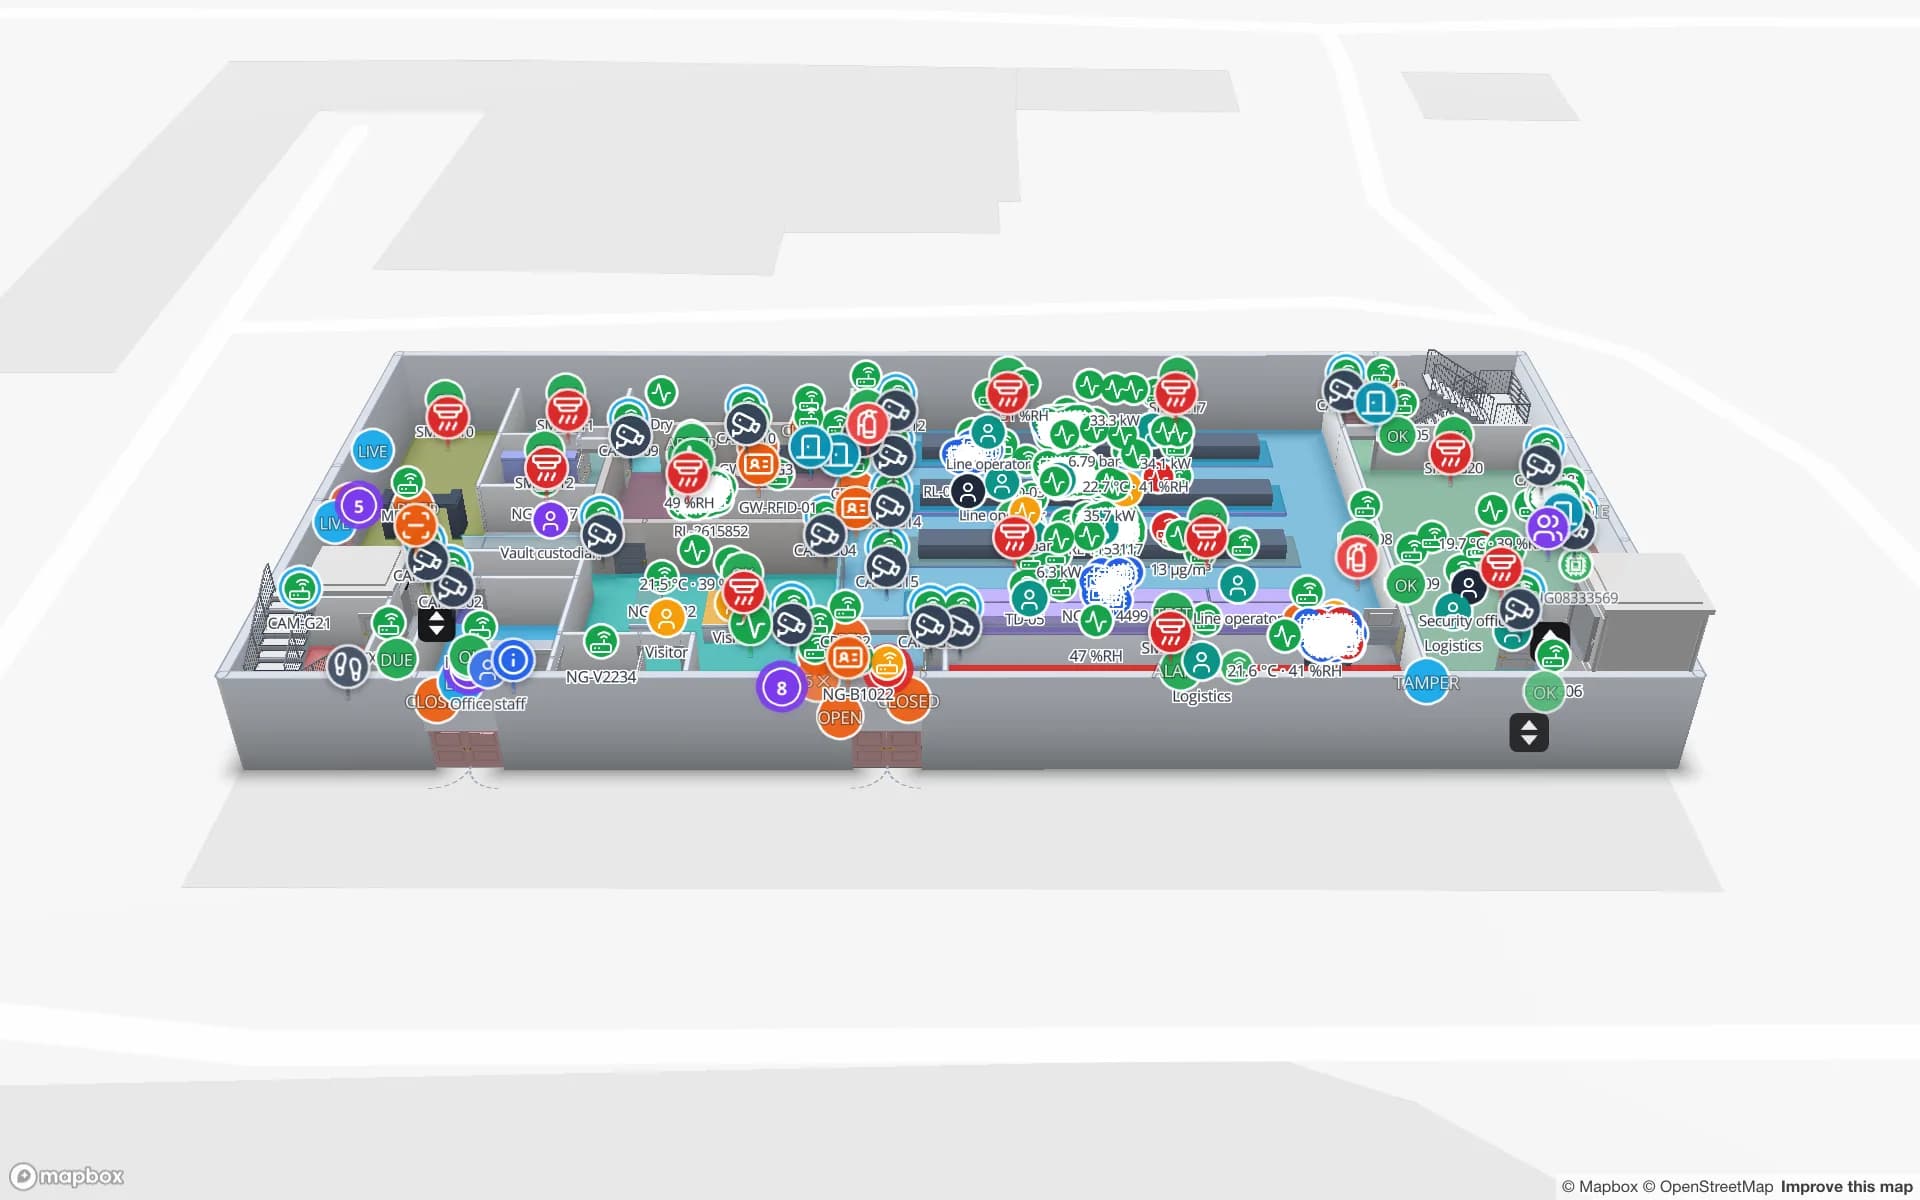
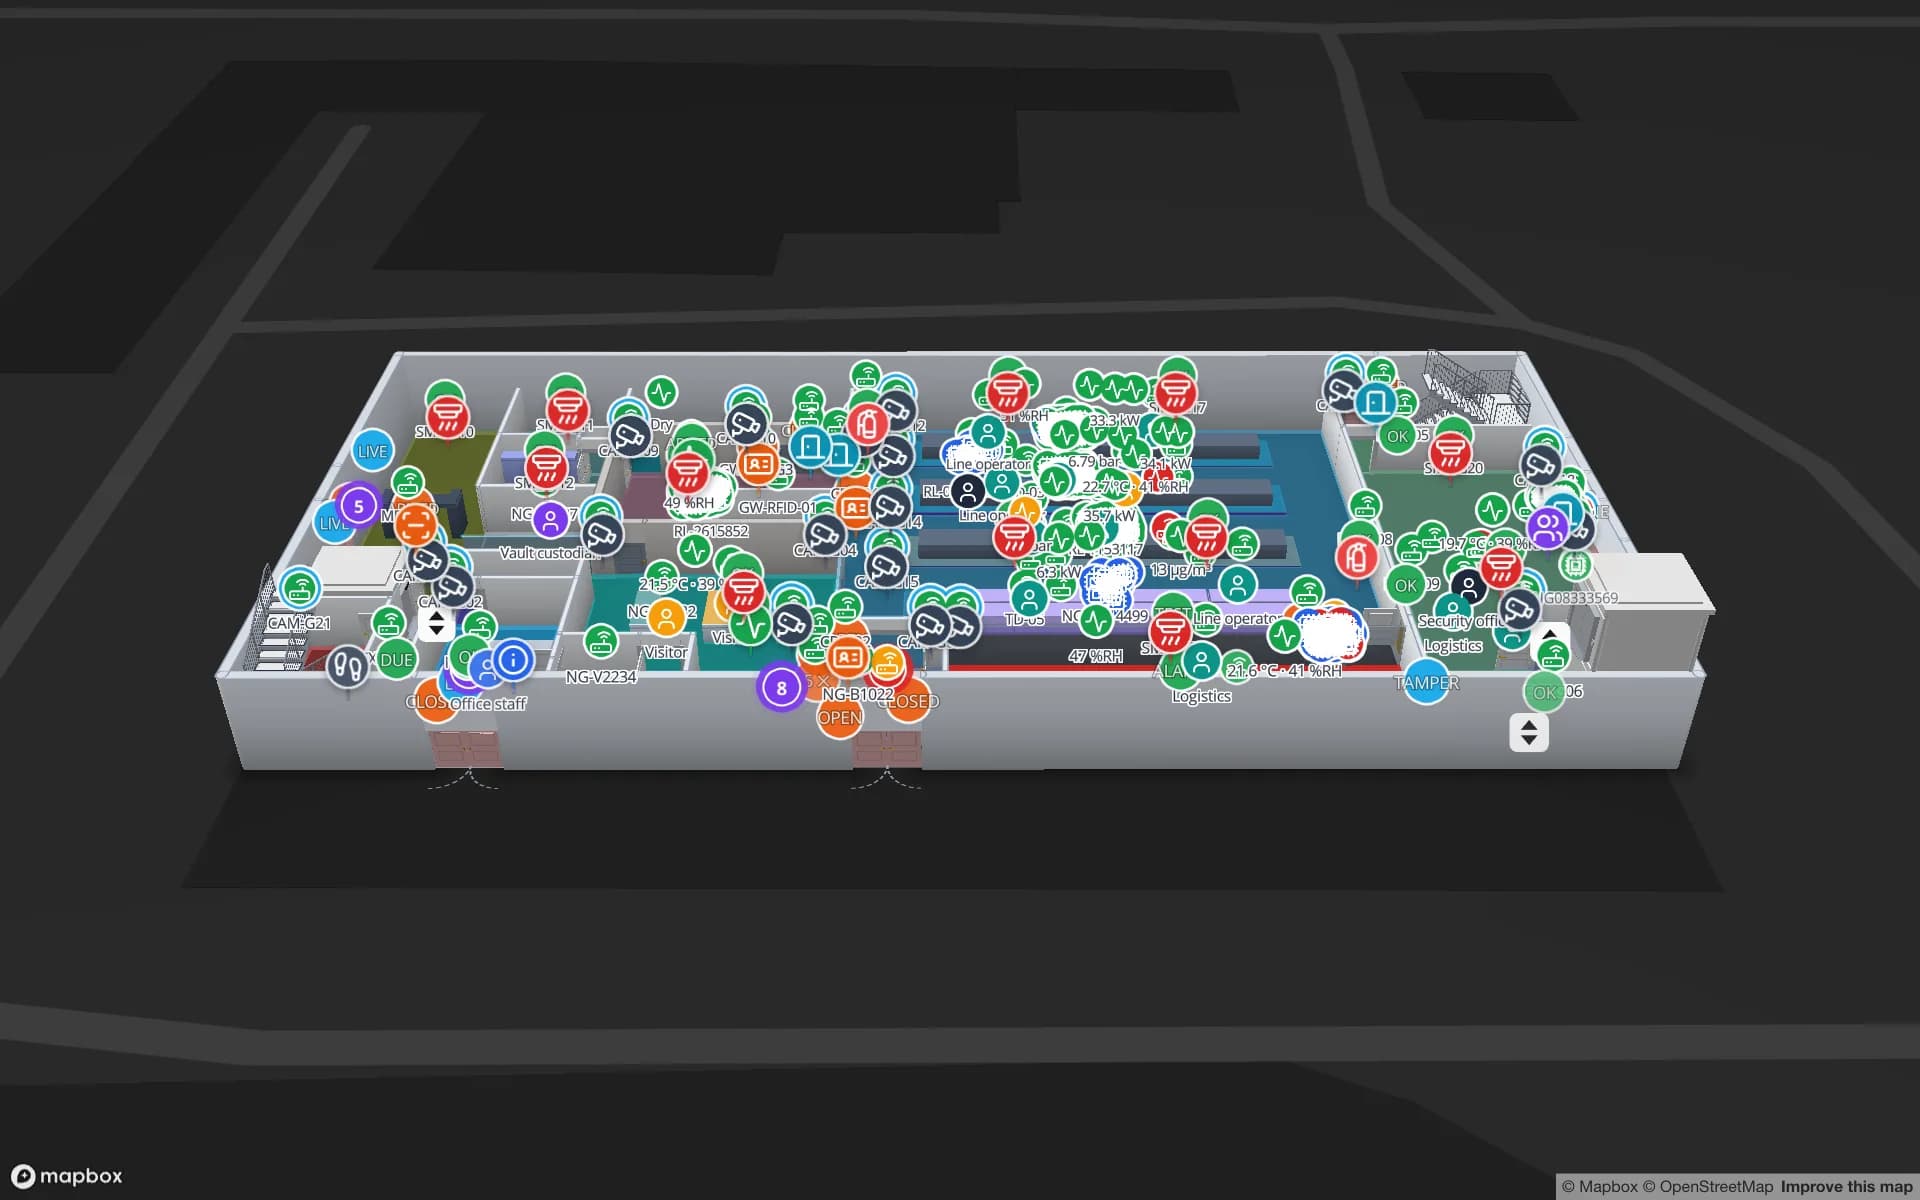
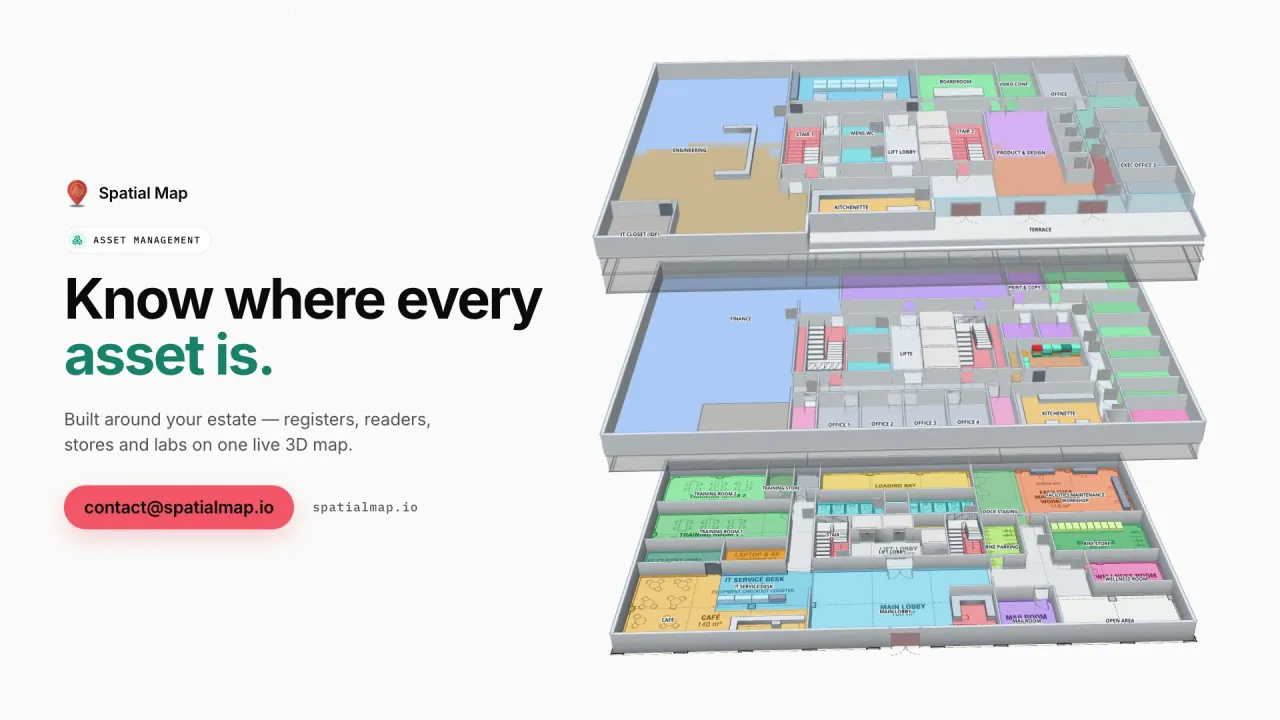
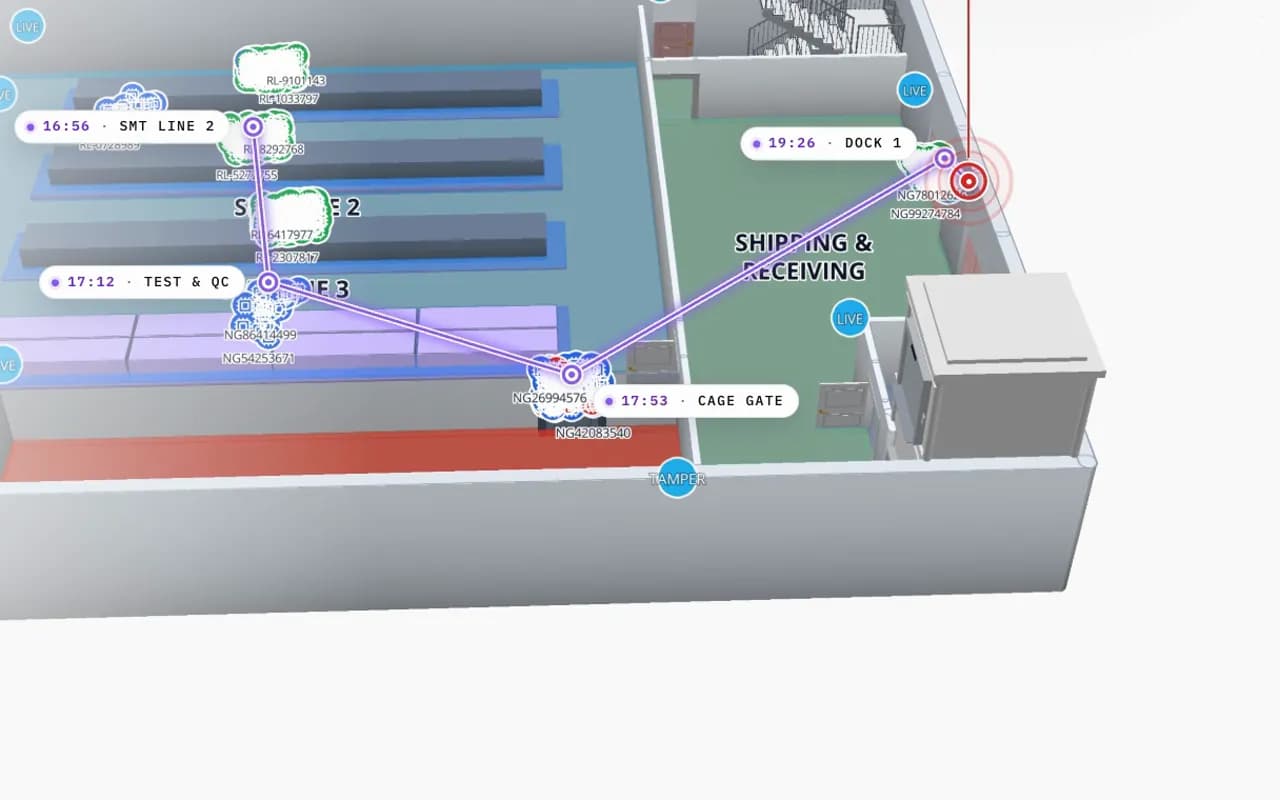
Northgate Electronics in 3D: an RFID read trail drawn from SMT line 2 through test and QC to the cage gate and dock 1, with the time of each read
Northgate Electronics — Assembly & Secure Store
Northgate Electronics (demo): one tagged unit’s read trail from SMT line 2 through test & QC to the cage gate and the dock, with the time of each read.

Several technologies, one building

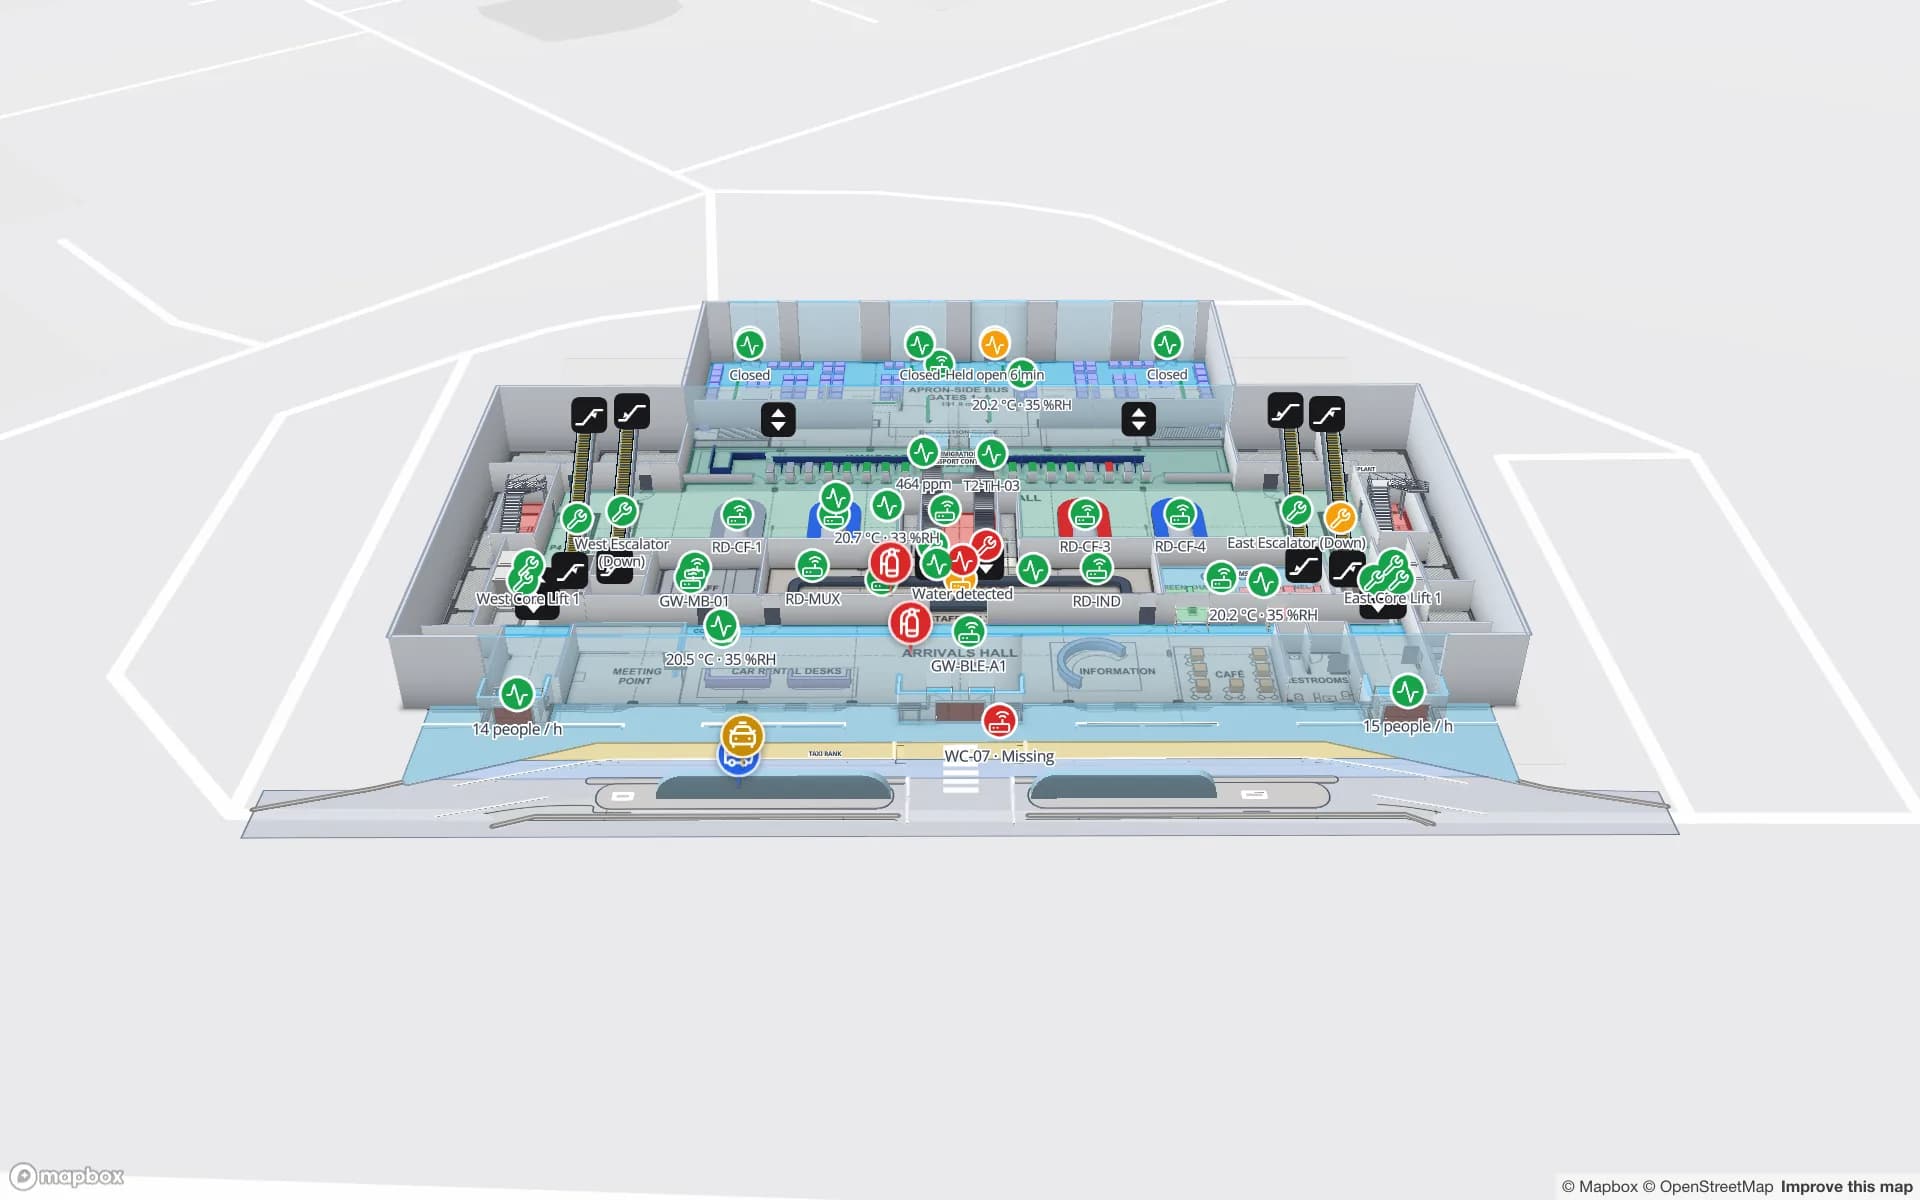
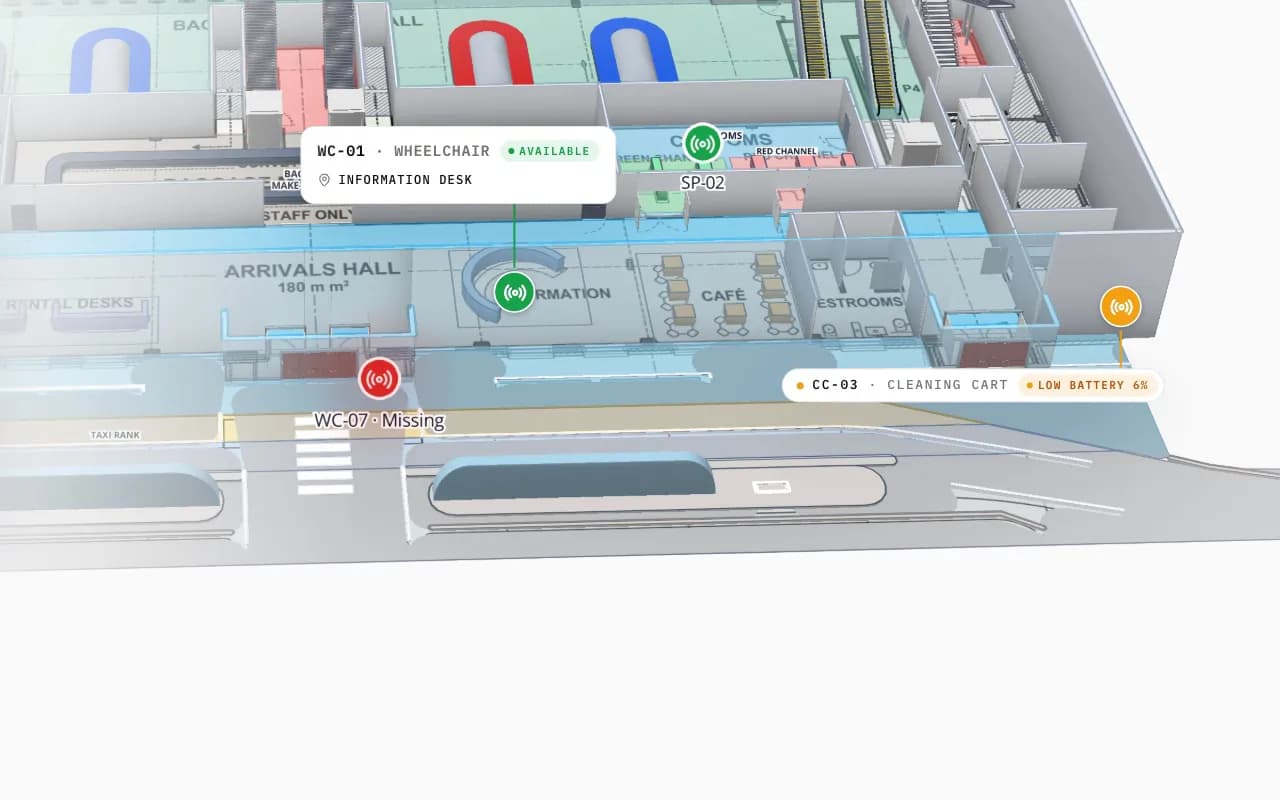
In the Eastport Cross-Dock demo, 1,180 RFID pallets sit at the dock door or lane that last read them, while BLE tags locate forklifts and crews on the same dock and every gateway shows its health. At Silverbay Airport Terminal 2, loan wheelchairs and staff are located across the terminal next to gates and queues. Each feed is its own table and its own layer, so a supervisor can switch technologies on and off without switching tools.

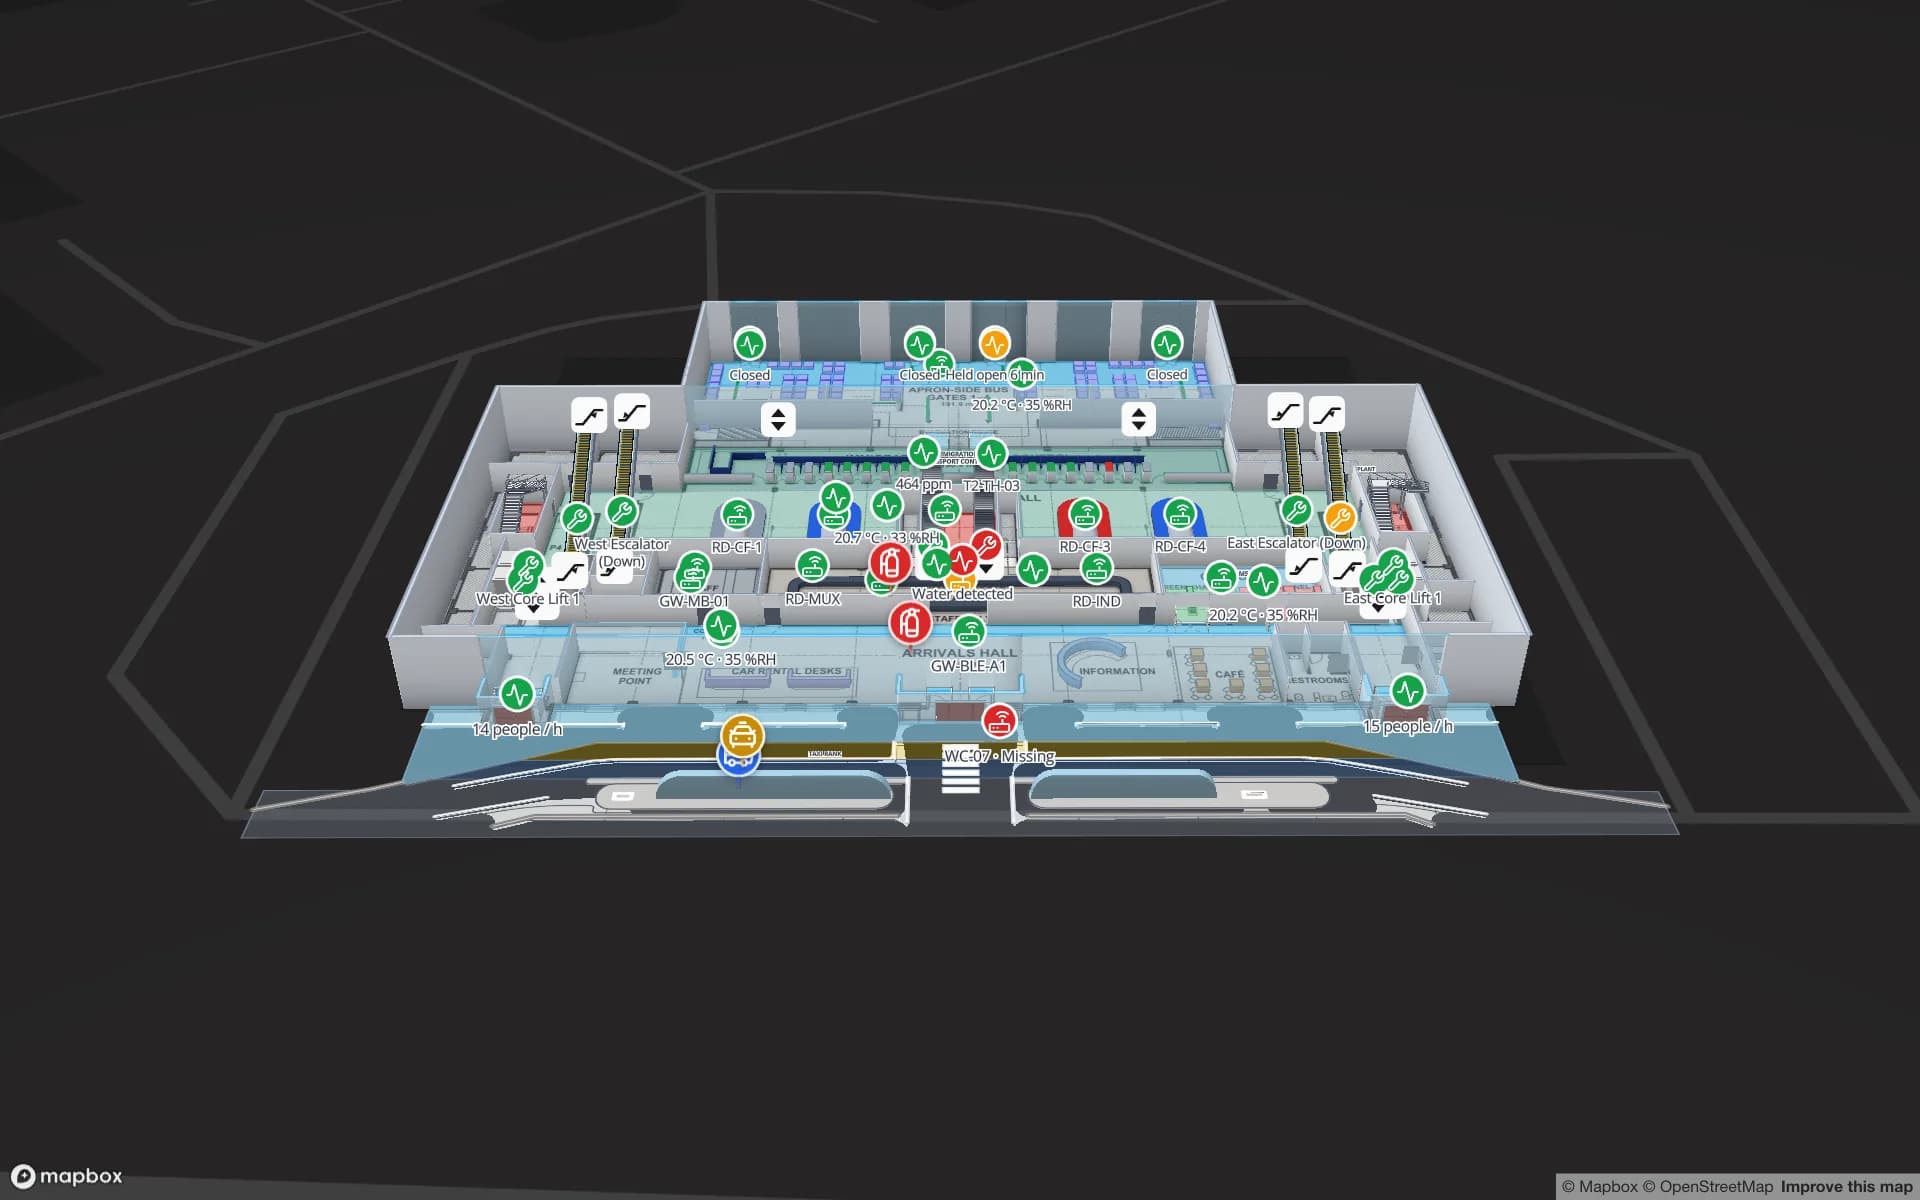
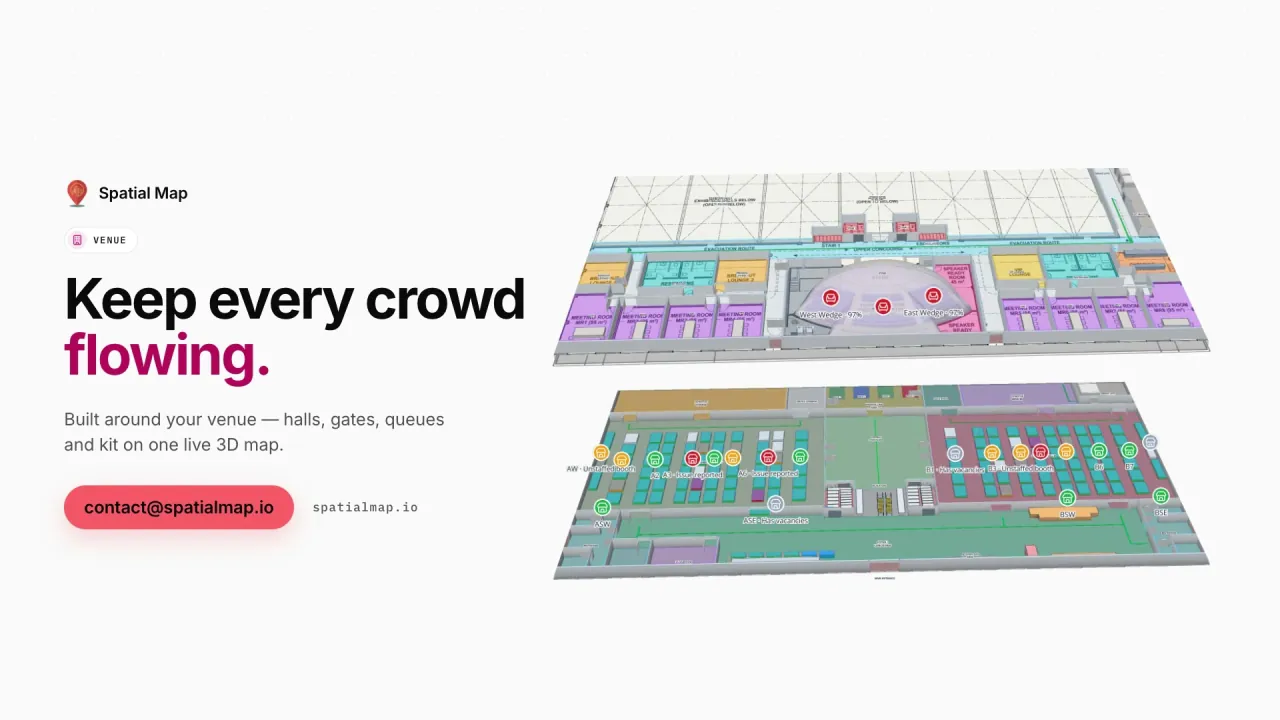
Silverbay Airport Terminal 2 in 3D: the view moves into the arrivals hall, where a loan wheelchair and other tagged equipment are marked on the floor plan
Silverbay International Airport — Terminal 2
Silverbay Airport Terminal 2 (demo): the view moves into the arrivals hall, where a missing loan wheelchair and other tagged equipment are shown in place.

Where the line is

Spatial Map does not talk to tags, readers, gateways or anchors, and it has no device drivers. It does not compute positions from signal strength, angle of arrival or time of flight; your engine does. It shows the location your system reports, a few seconds behind it. Alerts appear in the app only, with no email, SMS or push, and nothing is written back to your WMS or ERP. If your engine needs a relay to batch, convert and post its output, that is a small custom development job.

RFID vs BLE vs UWB at a glance

General characteristics as they are widely published. Real results depend on the vendor, the tags, the building and the installation, so pilot in your own site before you plan around a number.

Passive UHF RFIDBLEUWB
What your system reportsA read at a reader, portal or antenna zoneRoom or zone presence; x/y with a positioning engine and enough gatewaysx/y, often with height, from an anchor network
Tag powerNone; the reader’s field powers the tagBattery, often a coin cellBattery; life depends heavily on the update rate
Typical location detailPresence at a read point, not a continuous trackRoom or zone; a few metres in a well-planned setupOften quoted below a metre with dense, surveyed anchors
InfrastructureReaders and antennas at doors and choke pointsPowered, networked gateways or anchorsDense powered anchors and a site survey
Cost per tagLowest: cents for paper labels, more for on-metalHigher than RFIDUsually the highest of the three
Typical fitPallets, cartons and tools passing doors and gatesCarts, wheelchairs, instruments, staff badgesForklifts and vehicles where the position within an aisle matters

More on choosing a technology in real-time indoor asset tracking. Spatial Map shows all three the same way: an ID and a position or read point per row.

How Spatial Map does it

Your RTLS on a 3D map in four steps

  1. 01

    Map the floors

    Import PDF or DWG floor plans and trace rooms, racks, doors, stairs and lifts, or let our team do it.

  2. 02

    Agree names and coordinates

    Name zones exactly as your engine does, and convert local x/y to longitude and latitude in the relay.

  3. 03

    Connect the feed

    Post batched positions or reads with the write API, or let Spatial Map poll your engine’s REST endpoint.

  4. 04

    Link, alert, report

    Bind each table with a data link, add alert rules and reports, and share a read-only view.

RTLS on the map, by site

Cross-docks and yards

RFID pallets by door and lane, BLE forklifts and crews among them, gateways with their health.

Fulfillment centres

Pickers and carts by zone next to 2,204 rack locations coloured by stock.

Airports and venues

Loan wheelchairs and staff across a terminal, replayed for the last handover.

Secure stores

High-value units followed reader by reader, with a read trail for the incident report.

See it on real demo facilities

Fictional names, real floor plans, live sensors, RFID, BLE tags and gateways — open any of them in the browser.

All 13 demo facilities

RTLS software — frequently asked questions

No. Spatial Map is the map, history and reporting layer of an RTLS. Your readers, gateways or anchors and your positioning engine compute positions or zone reads; Spatial Map shows what they report on a multi-floor 3D map.

Any whose engine, gateway software or middleware can post JSON rows over HTTPS or expose a REST endpoint returning JSON, GeoJSON or CSV. Spatial Map has no device drivers, so it is not tied to one vendor or one radio technology.

Yes. Each system writes to its own table and gets its own data link and layer on the same map, so RFID reads at the doors, BLE tags on carts and UWB positions on forklifts can be shown together or one at a time.

Live markers take longitude and latitude, so the relay converts local x/y once, usually with an affine transform from two or three surveyed points, and sends height in metres for the right level in 3D. Zone-level systems only need zone names that match the shapes on the map.

Open maps refresh after each write. The write API takes bulk upserts at up to 60 requests a minute per key, so the relay should batch, for example the tags that moved in the last few seconds. Plan for a few seconds behind the engine, not sub-second.

Yes, in the app. An alert rule such as “not updated for 15 minutes” or “matches for N minutes” is checked every 15 seconds and shows in the bell, as a toast and on the Alerts page, with Show on map. There is no email, SMS or push.

A 7-day free trial covers up to 5 facilities with no credit card. Pro is $60 a month or $600 a year for up to 4 facilities. The relay between your system and Spatial Map, and larger estates, are quoted as custom services or custom development.

Put the positions you already have on a map.

Start a free trial and open the Eastport and Silverbay demos, or send us a floor plan and a sample export from your RTLS and we will show you your own building.