
Data center RFID asset tracking: audits, door portals and reconciliation
Data center RFID asset tracking in practice: on-metal tags, cabinet audits, door portals for removal control, reconciliation with the register, and sensors.
Why data centres move asset tracking to RFID
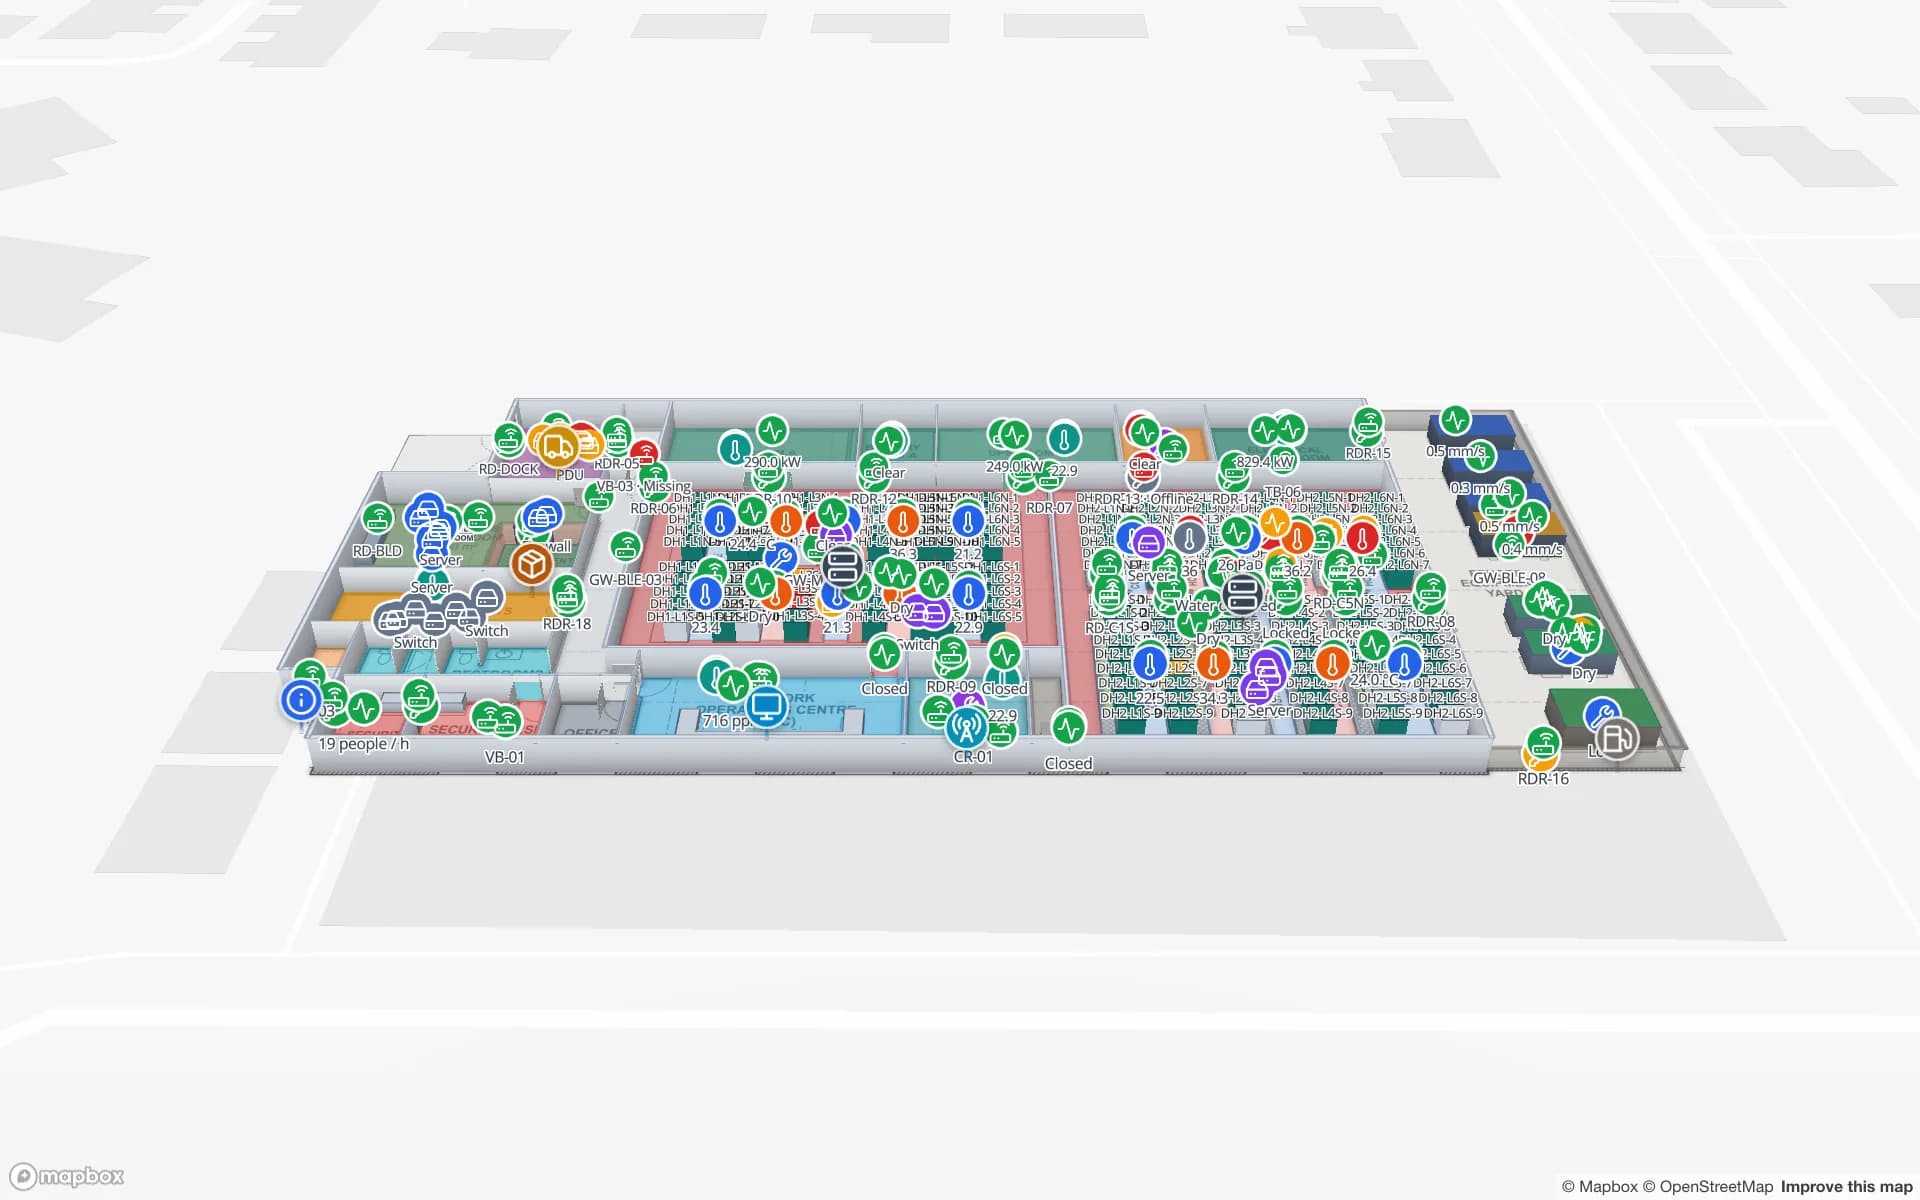
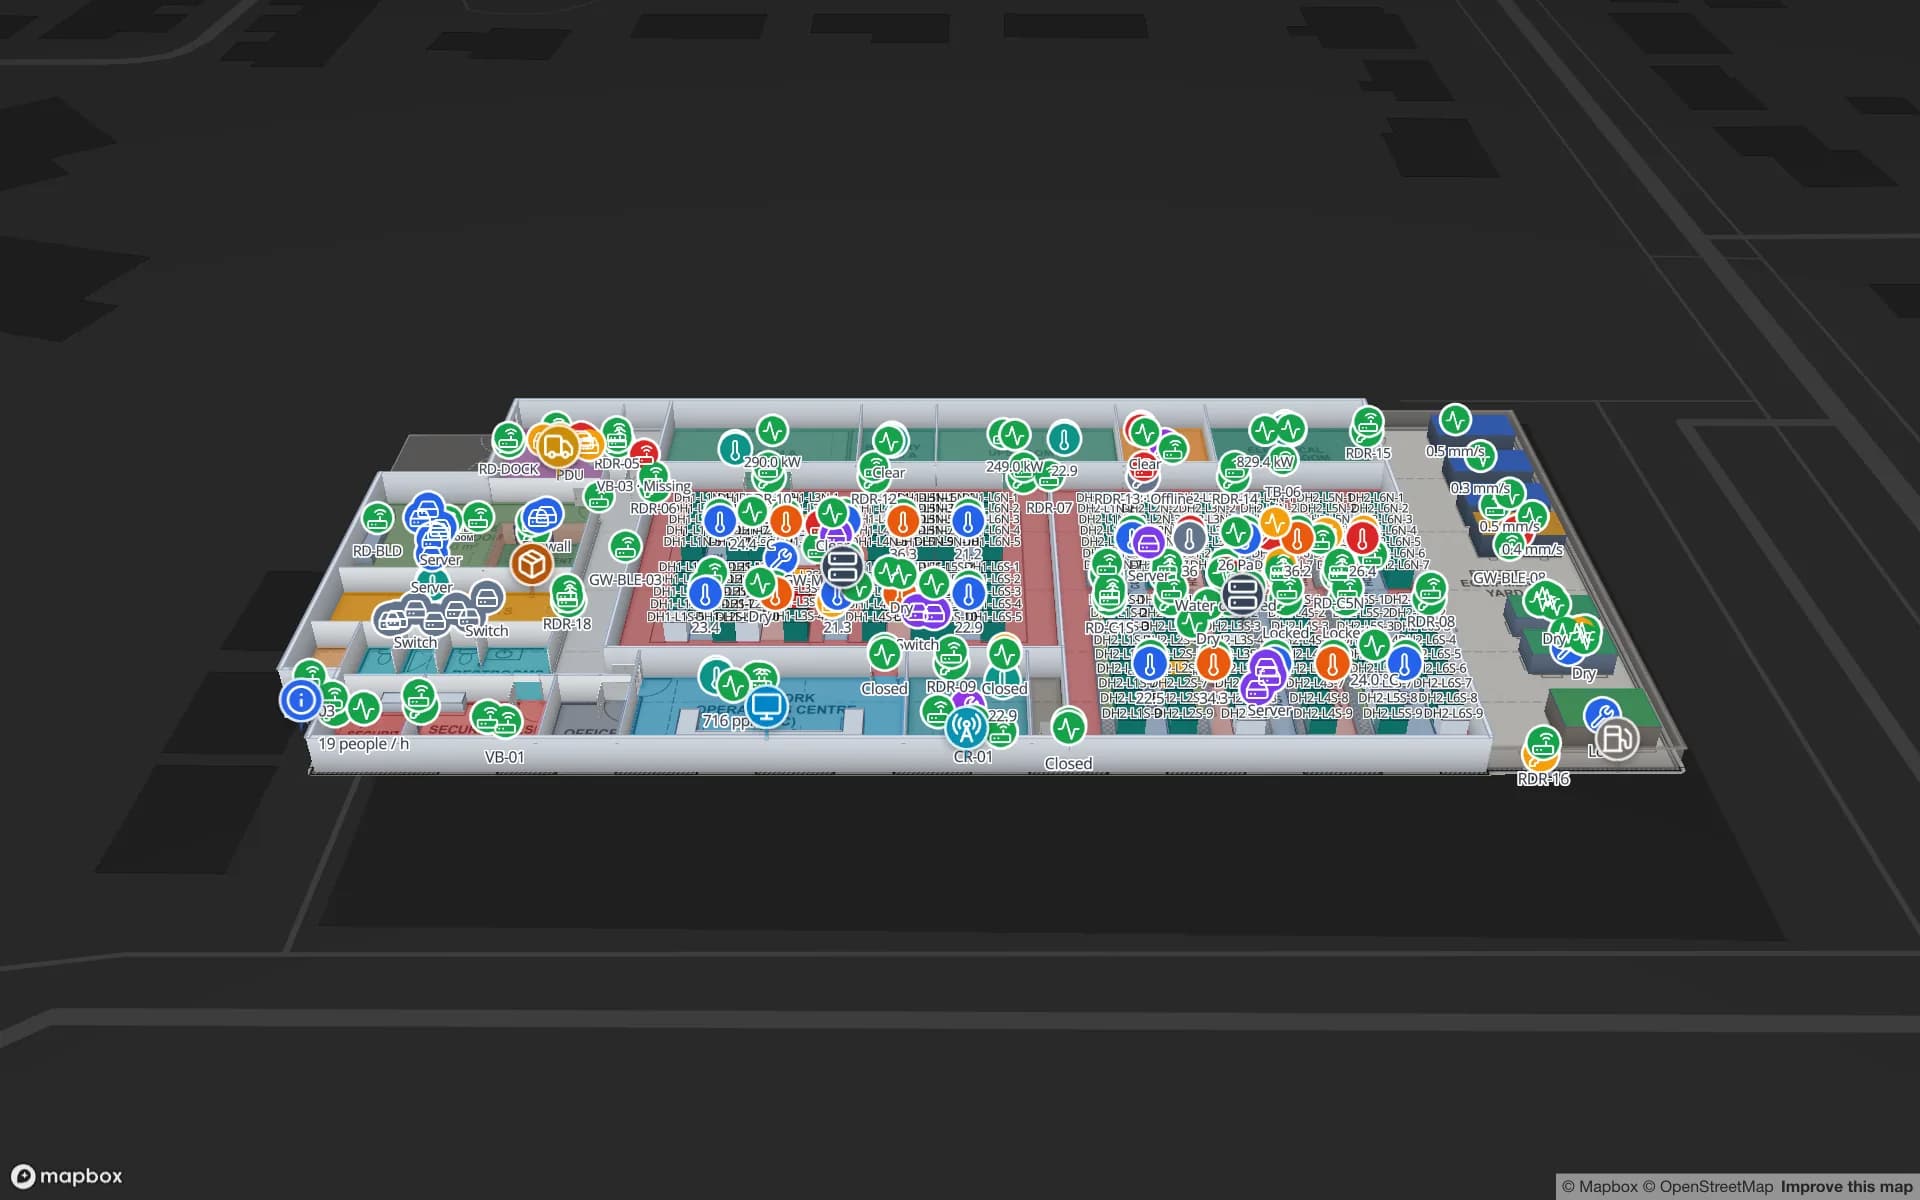
Spatial Map is a live indoor map that shows a data hall cabinet by cabinet, with the RFID reads, asset records and sensor readings you already collect placed on the cabinets they belong to. Data center RFID asset tracking means tagging servers, switches, storage, spares and media with RFID tags, then reading them with handhelds during audits and with fixed readers at doors — so the asset register reflects what is really in each cabinet and what has left the building.
The reason is time and trust. A barcode audit needs a line of sight to every label, one device at a time, often behind cable bundles at the back of a cabinet. RFID reads many tags in one pass without line of sight. Audits that took weeks can be repeated far more often, and the gap between the register and the floor — assets in the wrong cabinet, “ghost” records for hardware long gone — gets smaller each round.
A rack-level audit, step by step
- 1Export the expected list
From the asset register, CMDB or DCIM: asset ID, tag ID, serial, cabinet and U for every device in scope.
- 2Read the cabinet tag first
The handheld app then knows which cabinet the following reads belong to. Close the front and rear doors of the neighbouring cabinets to cut stray reads.
- 3Sweep front and rear
Slowly, top to bottom, at a set reader power. Too much power reads the next cabinet; too little misses deep-mounted units.
- 4Upload the reads
One row per tag read, with the cabinet, time and auditor. Most handheld apps or middleware can send these over HTTP or as a CSV.
- 5Reconcile and fix
Compare reads with the expected list, resolve each exception and update the register. Re-sweep only the cabinets with exceptions.
Reconciliation: the part that pays for the project
| Result | What it usually means | Action |
|---|---|---|
| Read in the expected cabinet | Register is right | Nothing — record the audit date |
| Read in a different cabinet | Moved without a change record | Update the register; check the change process |
| Expected but not read | Removed, hidden, or a dead or missing tag | Look in person; re-tag if the device is there |
| Read but not in the register | Unregistered device, or a tag not linked to an asset | Register it or link the tag |
| Same tag in two places | Stray read from a neighbouring cabinet | Lower power or re-sweep that pair |
Put these exceptions on a map and patterns appear: one row of cabinets that always has stray reads, a cage where devices move without change records, a hall where tags fail on one hardware model. The same is true at the doors.
Door portals and removal control
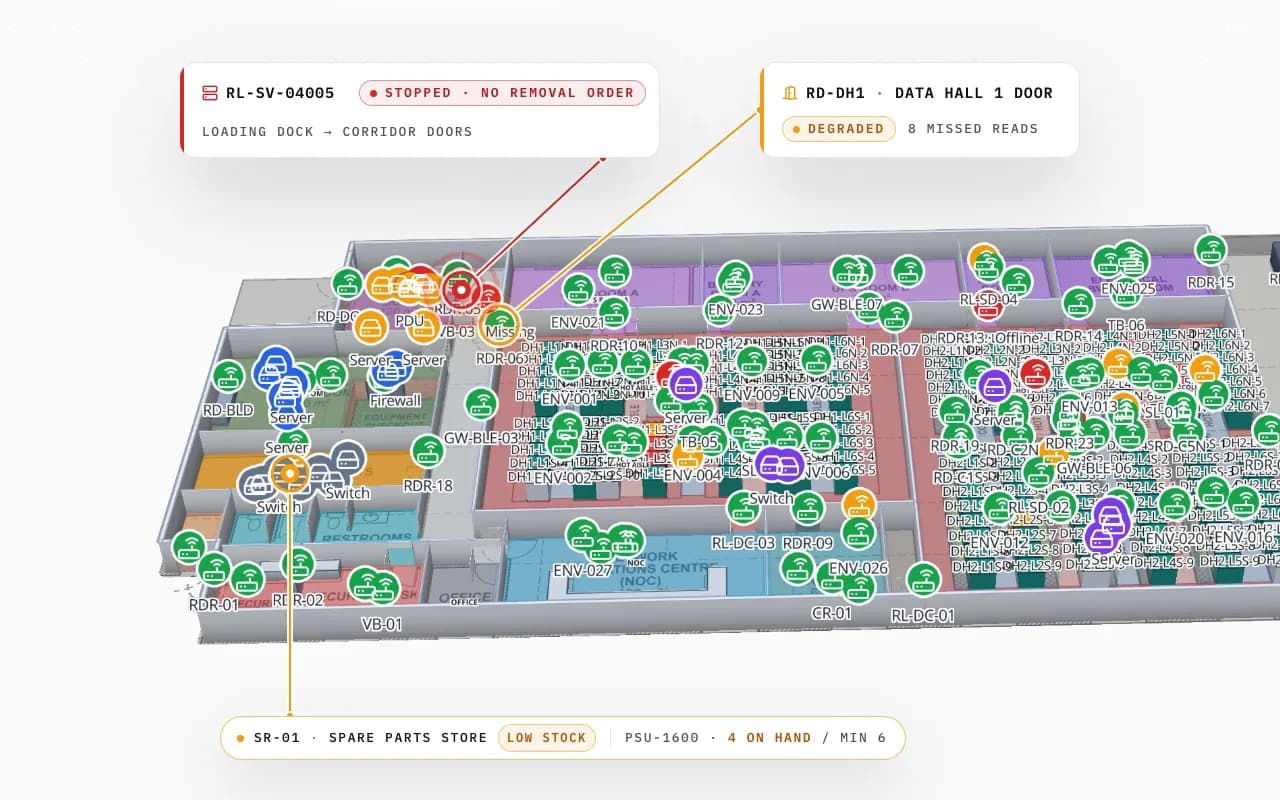
A portal at the data hall door or loading dock turns RFID from an audit tool into a control. Each read is checked against approved removals or change records: a server read at the dock with an open, approved removal is expected; the same read without one is an exception for security to look at. The RFID IT asset audit page covers removal control in more detail, including what to do about reads the portal misses.
Sensors on the same map
Asset location and environment are two halves of the same question: is this equipment where it should be, and is it safe there? Hot- and cold-aisle temperature, humidity, leak detection under the raised floor and door contacts on cages all read better next to the cabinets they describe. A hot spot at the top of one row makes more sense when you can see which devices were added to that row last week.
- Inlet temperature per row or cabinet, coloured by threshold.
- Humidity and leak detectors as markers on the floor plan.
- Reader and gateway health, so a silent portal is noticed before an audit relies on it.
- Spares stock per store, with a low-stock threshold.
How this looks in Spatial Map
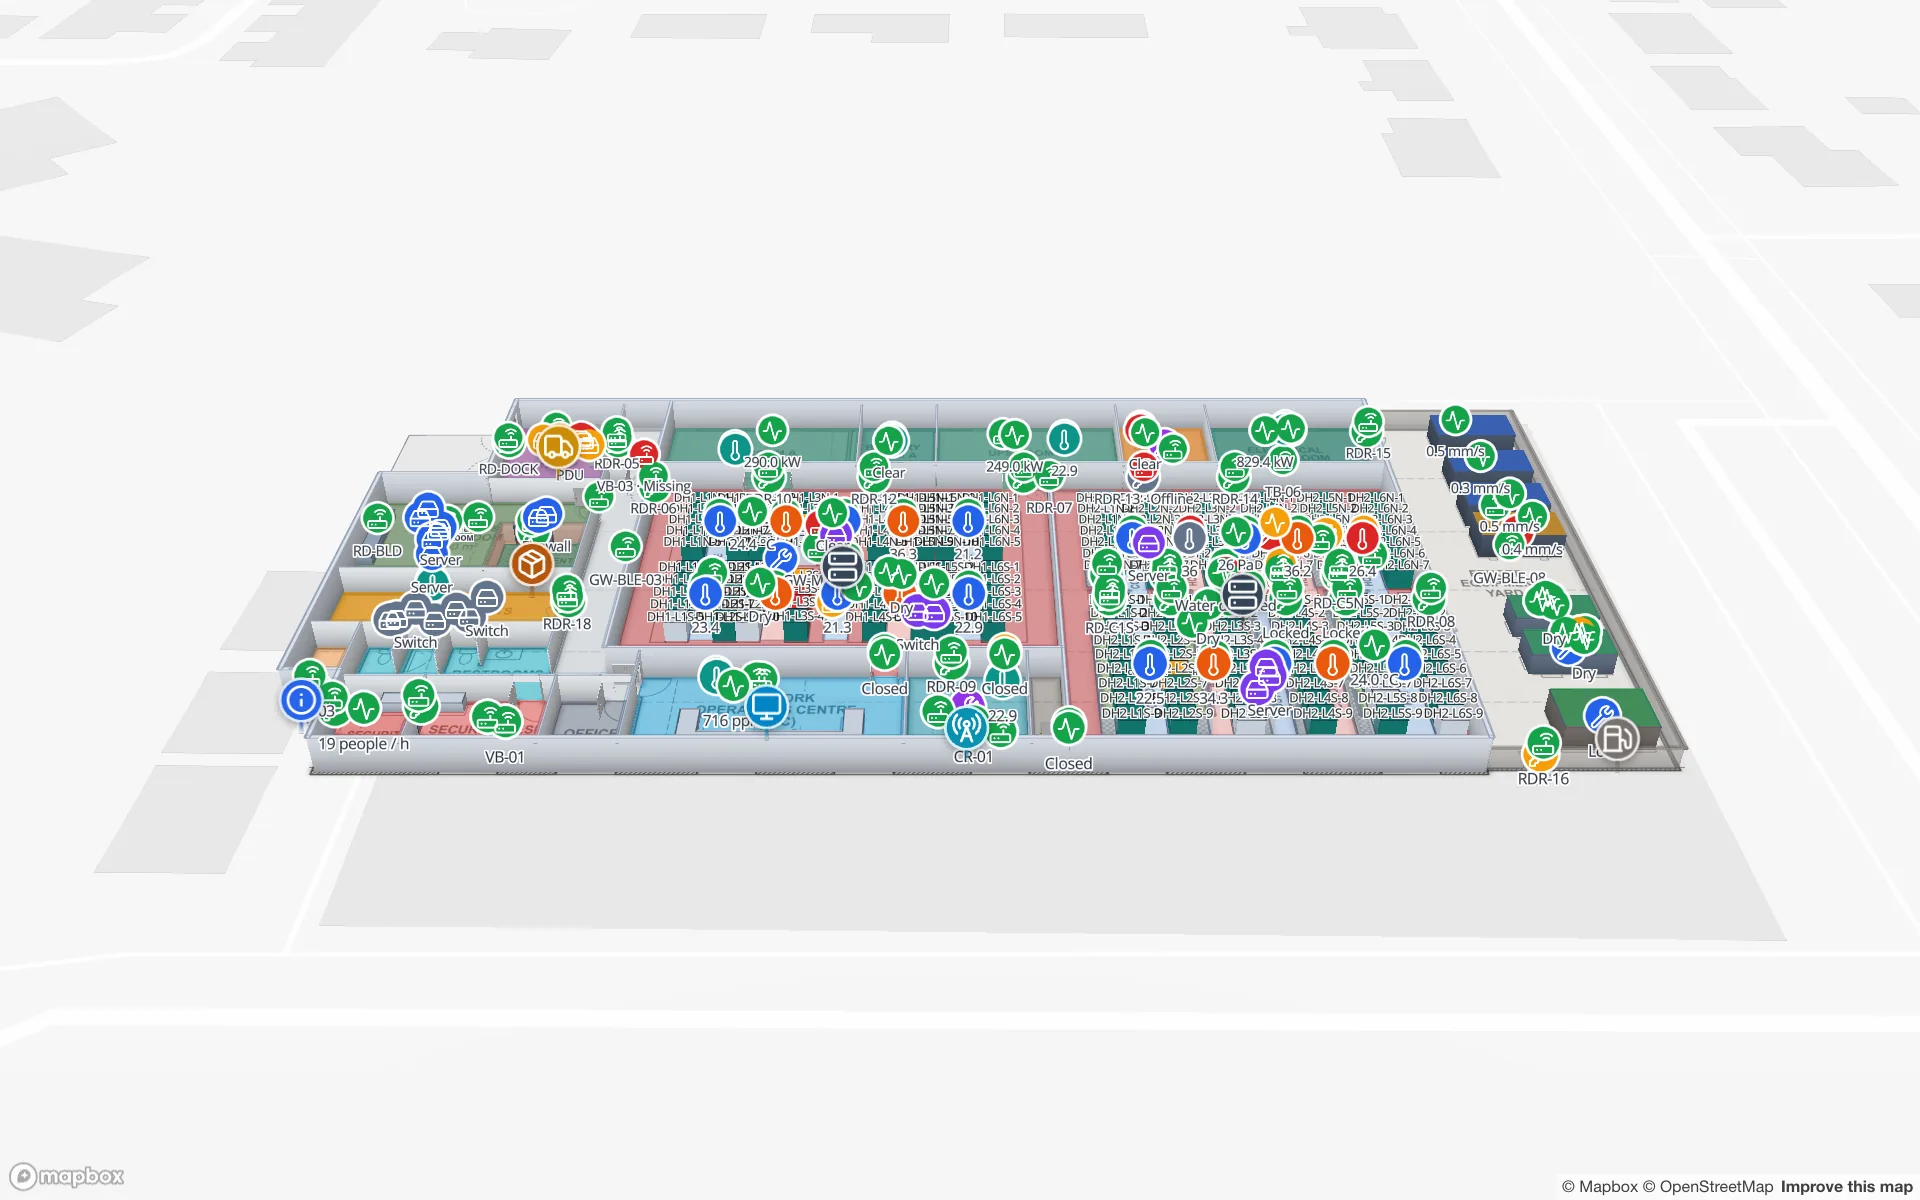
The Ridgeline Data Center demo is mapped this way: data halls, cages and 24 cabinet rows drawn as racks, power and cooling plant rooms, environment sensors in the aisles, and tables for cabinets, IT assets, environment readings, spare parts and changes. Its reports cover cabinet capacity, cooling and environment, IT assets and checkout, security and access, spares, and maintenance and change.
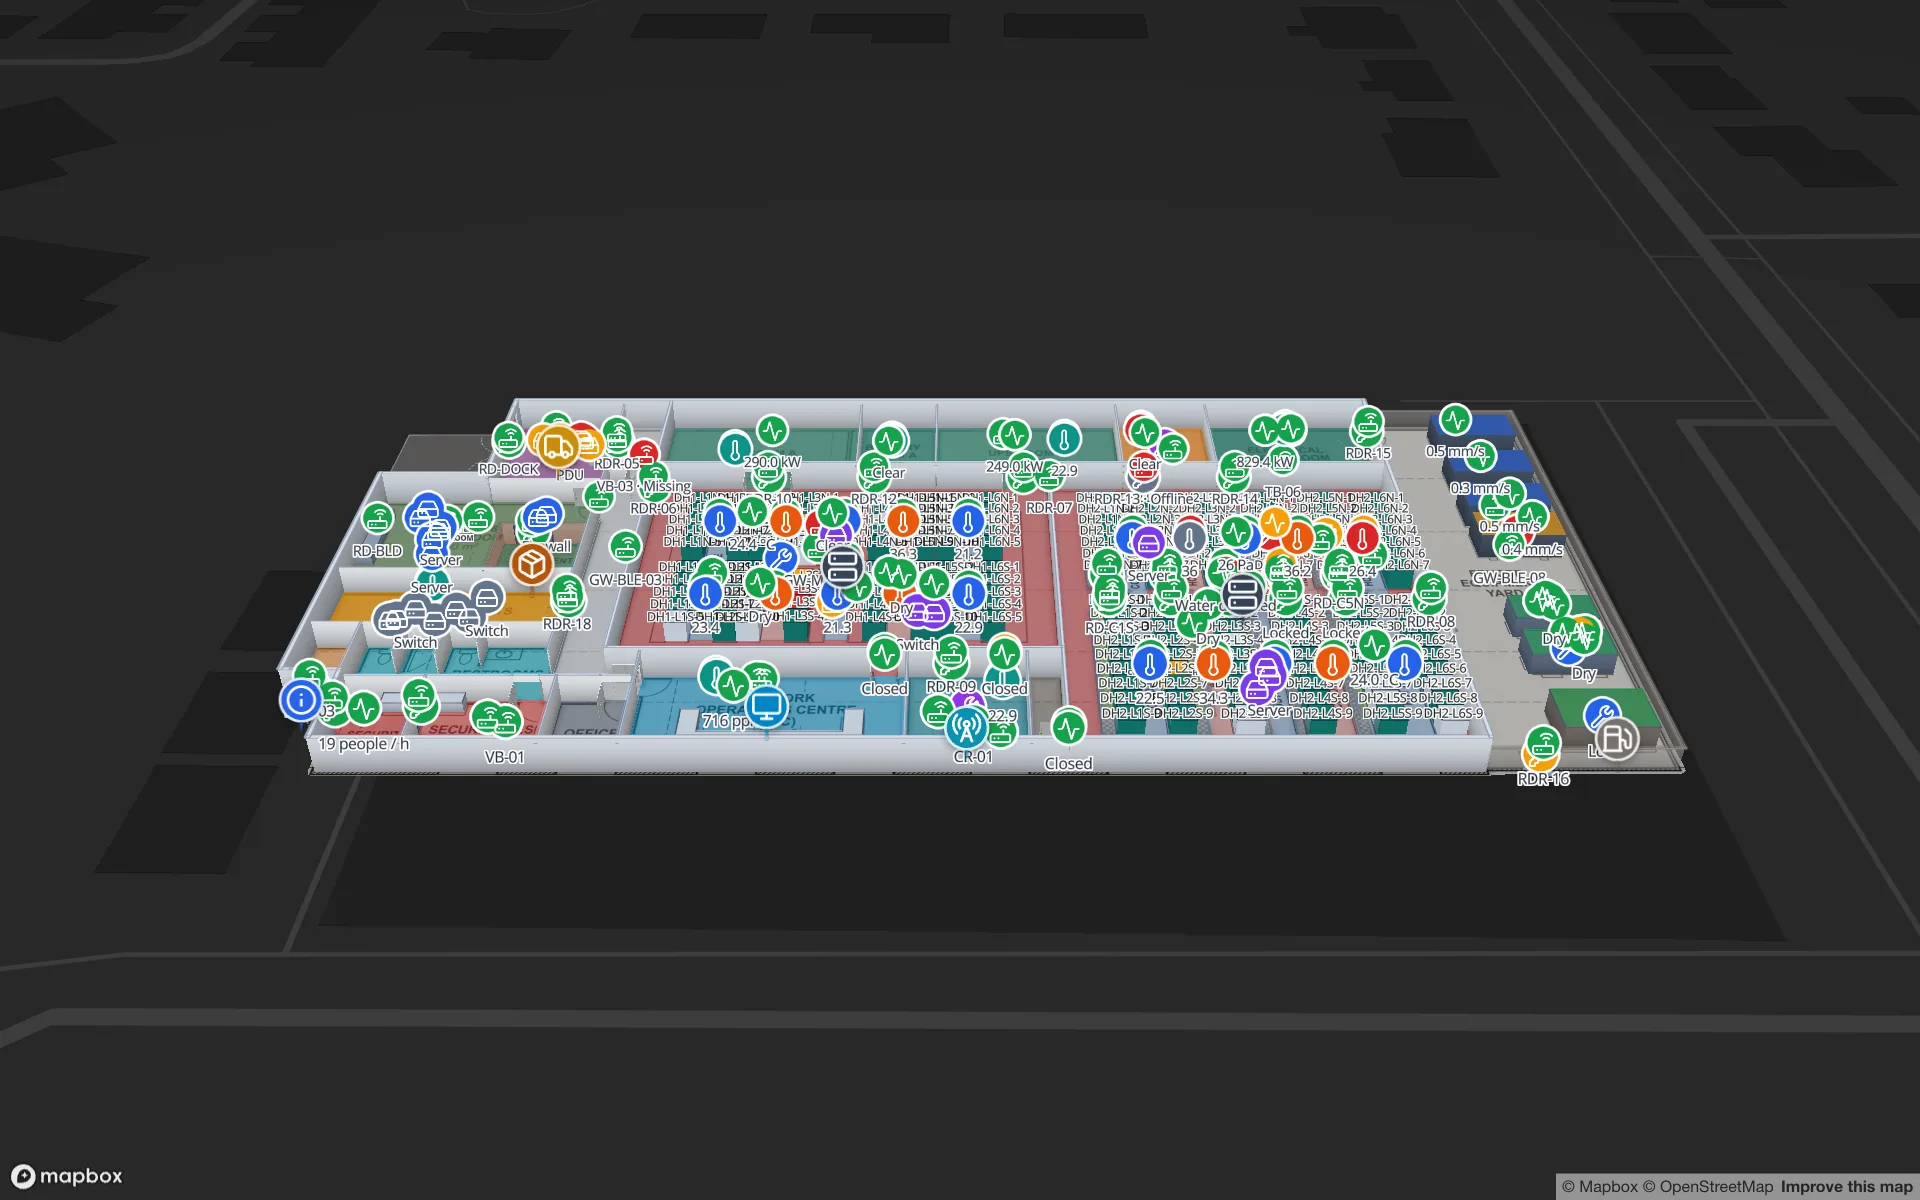
- Reads in — your RFID middleware or handheld app writes rows through a table’s API, or you upload the audit CSV. Spatial Map works with the readers you own; it does not drive them.
- Matched to cabinets — rows link to cabinets by cabinet code, so each cabinet can show its device count or exception status.
- Alerts in the app — rules such as “reader not updated for 30 minutes” or “a dock read whose removal-approved field is false” raise an in-app alert (bell, pop-up, Alerts page) with Show on map. No email, SMS or push.
- Evidence out — every row keeps its history, and reports export to PDF, Excel, CSV or JSON for auditors. There is no write-back to your DCIM or CMDB; corrections go back through an export or your own integration.
For the full building-type view — halls, cages, plant rooms and what to map first — see data center asset tracking map. A 7-day free trial covers up to five facilities with no card; Pro is $60 a month for up to four.
Try the platform your data belongs on.
Spatial Map turns spreadsheets, sensor streams, and CAD drawings into one live 3D facility view — nothing to install, seven-day free trial.
Keep reading
- IndustryIndoor positioning system in India: technologies, rules and where it fitsGPS and NavIC stop at the door. This guide compares indoor positioning technologies for Indian malls, airports, metro stations and warehouses, sums up the radio rules and the DPDP Act, and shows where a map of the building fits.
- IndustryIndoor wayfinding for airports and malls: what actually worksSigns do most of the work; an up-to-date map does the rest. What helps people find their way in terminals and malls, and what blue-dot positioning really gives you.
- IndustryRFID in the Middle East: retail, logistics and cold chainRetail estates, re-export logistics hubs and cold chains in extreme heat drive RFID in the Gulf. What each gains, the usual traps, and region-specific checks.