Detroit · Automotive plants, three Windsor crossings and the river port

Asset tracking in Detroit, for the things that move between plants

Spatial Map shows where tagged equipment, tooling and returnable containers are on a live 3D map of each building, using the reads and positions your RFID and BLE systems already produce. Asset tracking in Detroit is about things that travel: dies and fixtures that go between press shops and tool rooms, returnable racks and totes that cycle between suppliers and assembly, and freight that crosses the Detroit River to Windsor. Each building is its own facility, and all of them can sit in one workspace.

No credit card. Runs in the browser. Pro is $60/month for up to 4 facilities. Book a demo

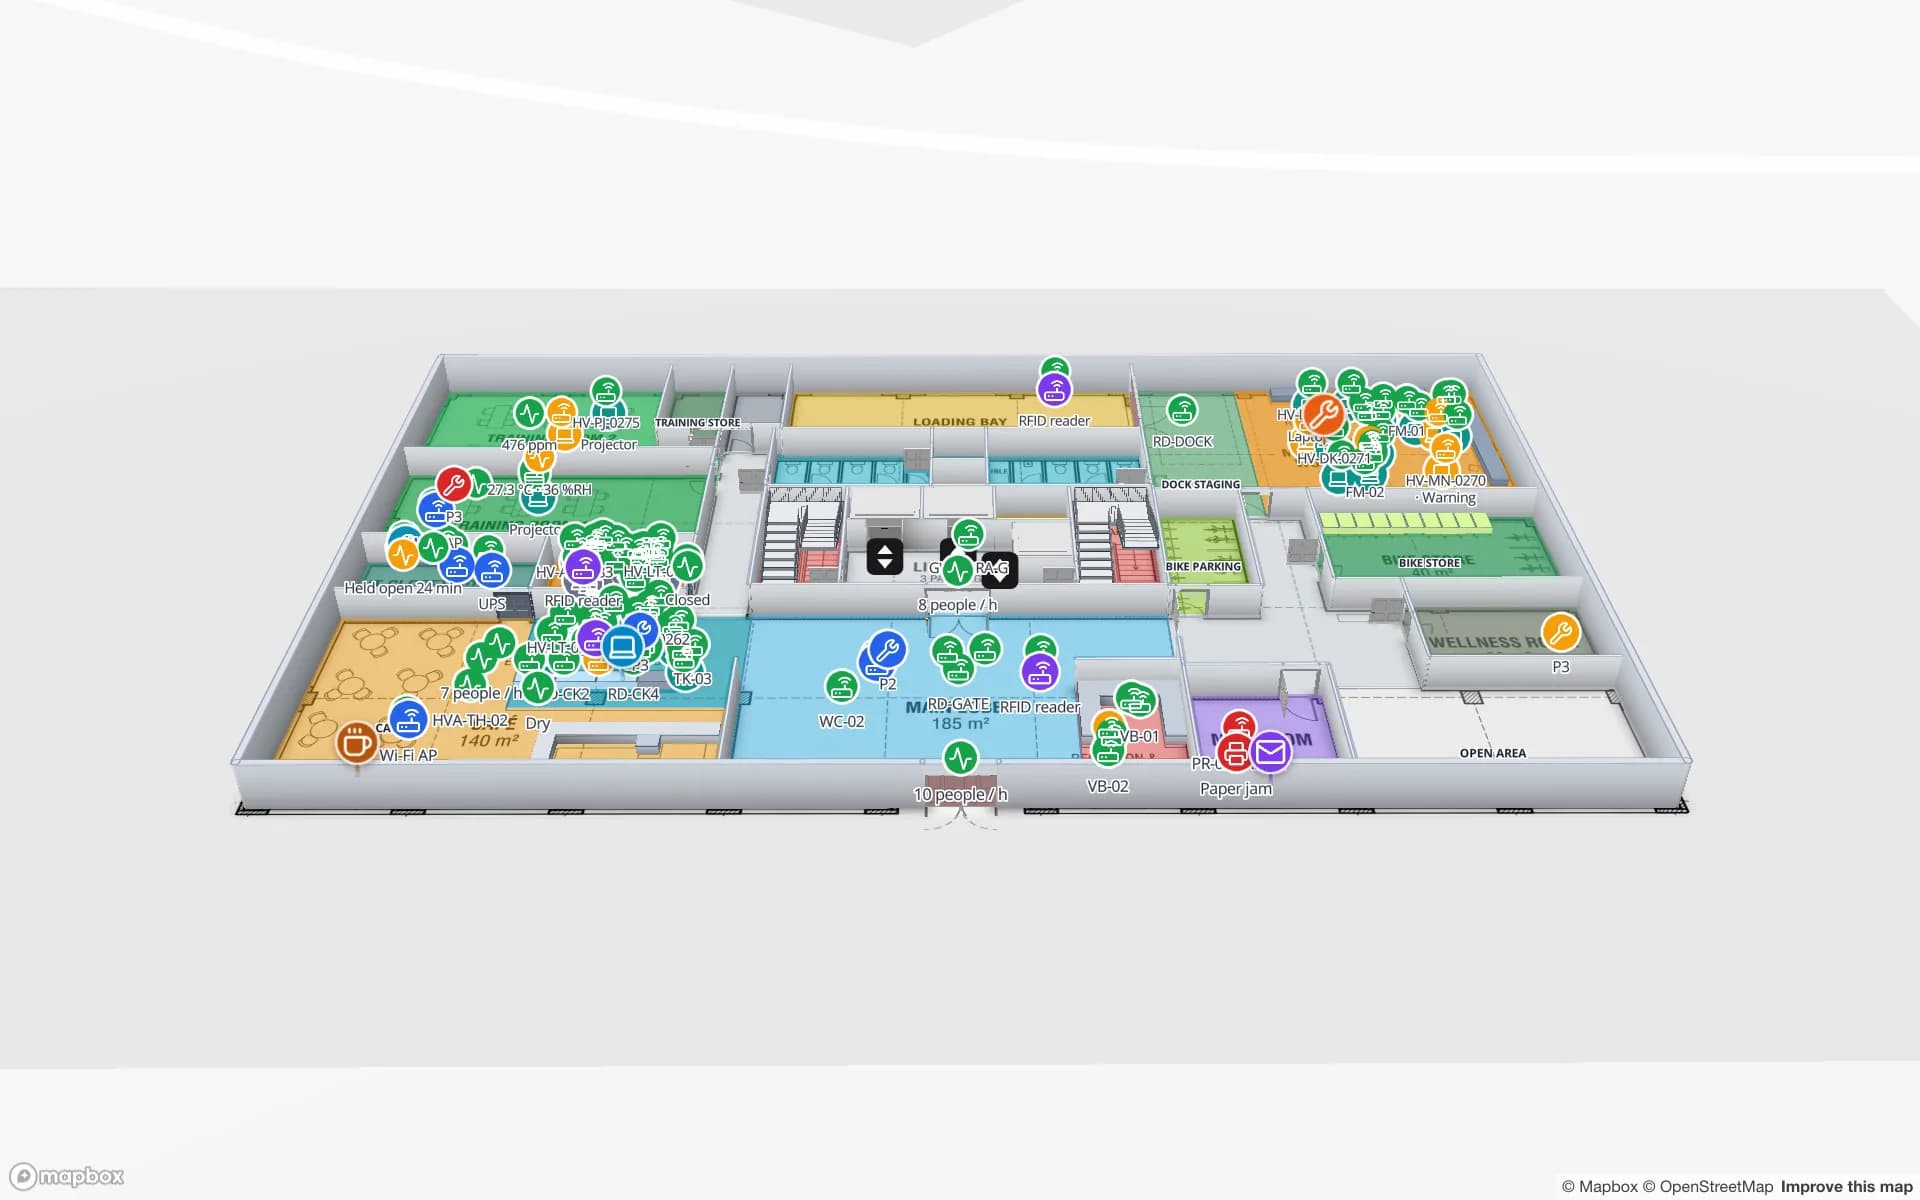
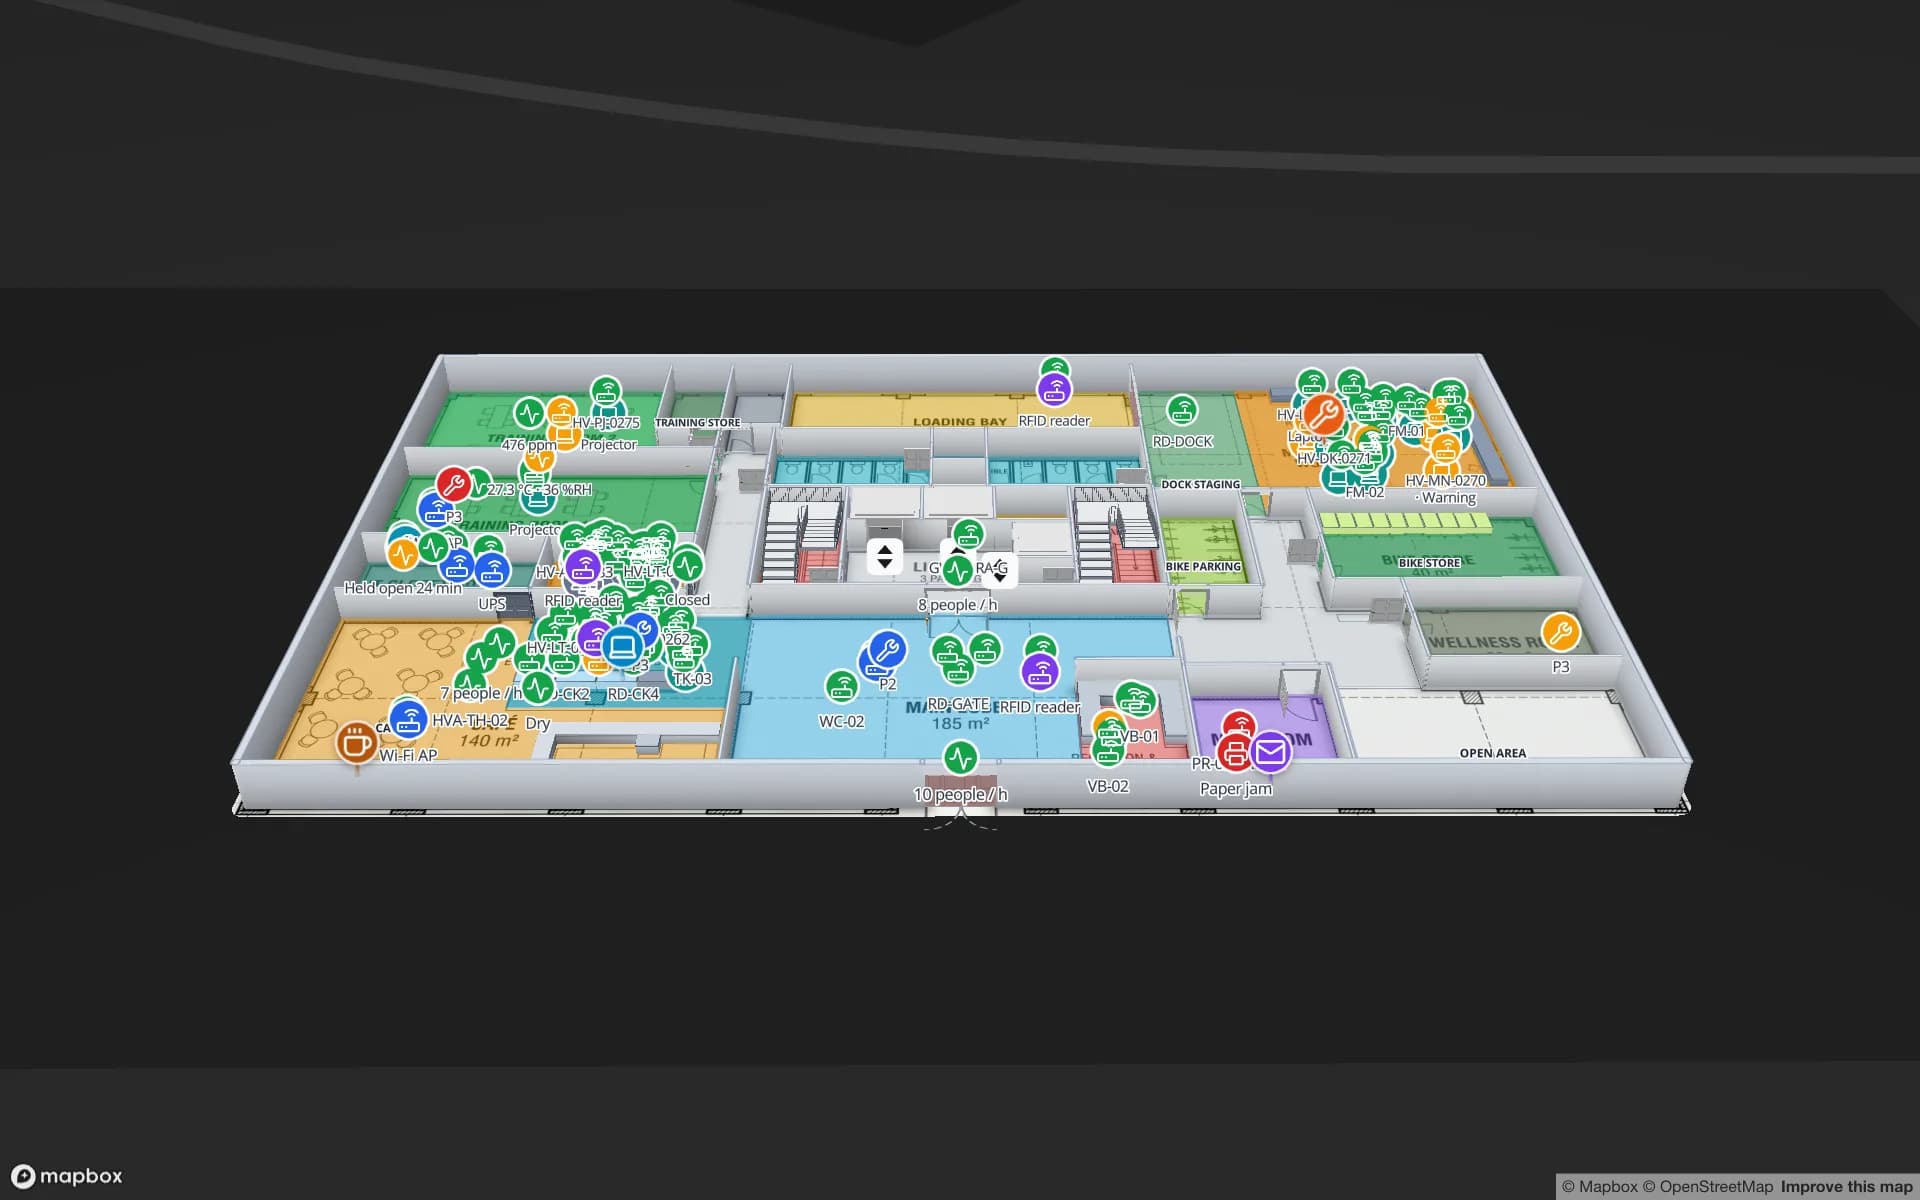
Summit Assembly Plant, a assembly plant demo, in the Spatial Map 3D viewer with live device markers
Summit Assembly Plant
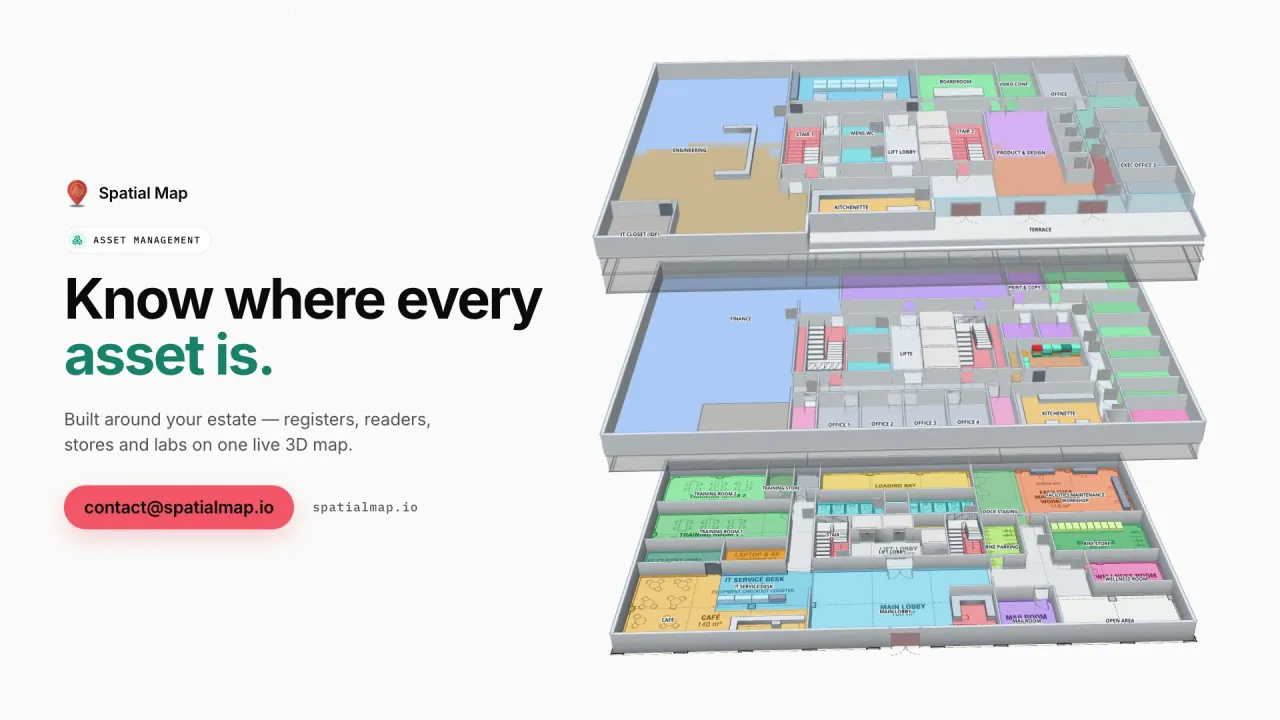
Summit Assembly Plant, a demo assembly plant: lines and workstations, WIP carriers read between stations, 867 raw-material and finished-goods rack locations and the receiving and shipping docks.
Rack locations in the Summit assembly-plant demo
867
Floors in the Summit plant demo
2
How often alert rules are checked, with alerts shown in the app
15 s
Free trial, up to 5 facilities, no card
7 days

Tooling, dies and gauges: the assets that stop a line

Automotive manufacturing in the Detroit area runs on assets that are more valuable and more mobile than the parts they make: stamping dies, molds, welding fixtures, checking gauges and the robots’ end-of-arm tools. A die moves between a press line, a tool room and sometimes a repairer, and when a changeover starts and the die is not where the schedule says, the line waits. This page names no carmaker and quotes no plant figure, because the problem is the same in a tier-one supplier, a tool-and-die shop or a body plant.

Spatial Map keeps the asset register as a table, with tag ID, owner, home location, status and next job, and draws the plant so each press, tool room and storage lane is an area. BLE tags with gateways named after those areas, or RFID tags read at the tool-crib door, tell your system where each item is. The map shows its last-seen area, a style rule colors items overdue for return, and the History player replays where a die has been. RFID tool tracking covers the crib pattern; the Summit demo shows lines, workstations and tools located on a shop floor.


Returnable racks and totes: a closed loop that leaks

Parts reach an assembly plant in returnable steel racks, plastic totes and dunnage that must go back to the supplier, and any loop like that loses containers: they sit in a yard corner, drift to another plant or are used as shelving. A lost rack is a cost nobody sees on a single line item, and a rack shortage shows up as a late delivery.

Tag each rack or tote with a UHF RFID tag or a durable label, read it at the receiving and shipping doors, and the map shows containers by area: how many are empty and waiting, how many are at the supplier, how many have been sitting at one door for days. A count rule raises an in-app alert when empties pile up at receiving, and a table of container IDs can feed a report of containers by location. Test tags on steel and plastic in your own yard first; the post on RFID tags for metal, liquids and apparel lists what to check.

Three ways across the river, and what each means for freight

Detroit sits across the Detroit River from Windsor, Ontario, and there are now three road crossings. The Ambassador Bridge was built in 1929, is privately owned and has four lanes. The Detroit–Windsor Tunnel has been open since 3 November 1930, is 5,160 feet long and does not allow large trucks. The Gordie Howe International Bridge adds a third crossing, with six vehicle lanes plus a walking and cycling path; it is owned equally by Canada and the state of Michigan, and its U.S. port of entry in Detroit’s Delray neighborhood covers about 170 acres with 36 primary inspection lanes.

A new crossing changes routes, not buildings: a plant on either side still has to know which trailer, rack or tool is on which truck and where it is waiting. Spatial Map does not connect to border, customs or bridge systems and does not estimate crossing times. It shows what your own building reports: the trailer in its yard slot, the returnable racks staged for the cross-border run and the tooling headed for a plant in Ontario. The Eastport demo shows yard slots and dock doors, and dock doors and trailer visibility explains the pattern.

The river port and the airport: equipment of every size

The Detroit/Wayne County Port Authority oversees the Port of Detroit, whose marine terminals are in Detroit, River Rouge and Ecorse and, in the words of one reference, are all privately owned and operated; steel is the most valuable commodity moved and ore the largest by tonnage. Detroit Metropolitan Wayne County Airport, run by the Wayne County Airport Authority, has six runways. For a facility team on any of those sites the asset list is the same: forklifts, trailers, handheld scanners and spare parts.

Tag the equipment that leaves the building and the equipment that never should, and a map by area answers “where is it?” for either. The real-time indoor asset tracking post explains how tags, gateways and tables fit together, and BLE or RFID for asset tracking helps choose.

Services for teams in Detroit

Detroit teams tend to follow three starting points:

  • Plants and suppliers start with asset tracking for tooling, racks and totes, then link it to inventory tracking for parts and finished goods.
  • Tool rooms and maintenance shops start with the indoor map and a check-out register at the crib door, often before any BLE tags are bought.
  • Larger plants that need positions of people and vehicles look at RTLS and UWB; a BlueIOT server connects directly and other engines through the write API.
  • Tags, gateways and readers can be sourced on request, quoted per project, with warranty from the manufacturer: see hardware and demo kits on request.
  • Asset back offices, handheld apps and ERP integrations are built as client projects, for example an asset management system. The product runs as cloud or on-premises.

Also served nearby

The same approach covers Dearborn, Warren, Sterling Heights, Auburn Hills, Romulus and Livonia, and the supplier parks along the corridors out of the city. Nothing needs to be installed on site: the map opens in a browser.

How Spatial Map does it

Building a Detroit asset map

  1. 01

    Load the asset register

    Upload a CSV or Excel list of tooling, racks and equipment with tag IDs, owners and home locations as a table.

  2. 02

    Map the plant in areas

    Upload the plan, let AI Map draft the floor, and draw press lines, tool room, yard and docks as named areas.

  3. 03

    Connect tags and reads

    BLE gateways and RFID readers post rows through the table write API, a polled REST endpoint or file uploads.

  4. 04

    Add return and silence rules

    In-app alerts for tools overdue for return, containers piling up at a door and gateways that went quiet.

What Detroit teams track

Dies, molds and gauges

Tooling with its last-seen area, its home location and a History player.

Returnable racks and totes

Containers by area, with empties waiting at receiving and loops running late.

Cross-border trailers and yard slots

Trailers, dock doors and pallets staged for the run across the river.

Shared equipment on the shop floor

Forklifts, carts and portable equipment, with check-out and return by area.

See it on real demo facilities

Fictional names, real floor plans, live sensors, RFID, BLE tags and gateways — open any of them in the browser.

All 13 demo facilities

Asset tracking in Detroit — questions we get

No. It has no link to bridge, tunnel, customs or border-wait systems and does not estimate crossing times. It shows what happens inside your own building, from your own RFID reads, BLE tags and sensors.

It tracks them inside your buildings and yards, wherever your readers and gateways see them: staged, at a door, waiting empty. Once a container leaves your site it is only visible if a reader at the next site reports it into a table you share. Spatial Map does not read other companies’ systems.

That depends on the tag, the mounting and the environment, so ask the vendor for its operating range and test on your own tools. Spatial Map does not make tags; what it adds is visibility, such as an in-app alert when a gateway stops reporting.

Yes. Upload the CSV or Excel register as a table, place items by their home area, and move to live tags later. Many teams run the check-out register from a handheld before any BLE tag is installed.

No. Spatial Map is sold online and our team works with customers in the United States remotely, by video call and through the contact form. There are no local resellers or partners.

In US dollars, the same worldwide: a 7-day free trial for up to 5 facilities with no card, then Pro at $60 a month or $600 a year for up to 4 facilities. Tags and readers, if you ask us to source them, are quoted per project and are not part of the subscription.

Map one Detroit tool room before the next changeover.

Start the free trial and open the Summit demo, or send us the plan of a plant or tool room and your asset register through the contact form.