Chicago · The rail hub, O’Hare cargo and the plants behind them

Asset tracking in Chicago, from the rail hub to the plant floor

Spatial Map shows where tagged equipment, tools, totes and other assets are on a live 3D map of each building, using the reads and positions your RFID and BLE systems already produce. Asset tracking in Chicago has an unusual starting point: the region is the country’s rail crossroads, so the plants, cargo buildings and cold stores around it handle a huge amount of equipment that moves between sites, shifts and customers, and a missing mold or returnable crate stops a line the same afternoon.

No credit card. Runs in the browser. Pro is $60/month for up to 4 facilities. Book a demo

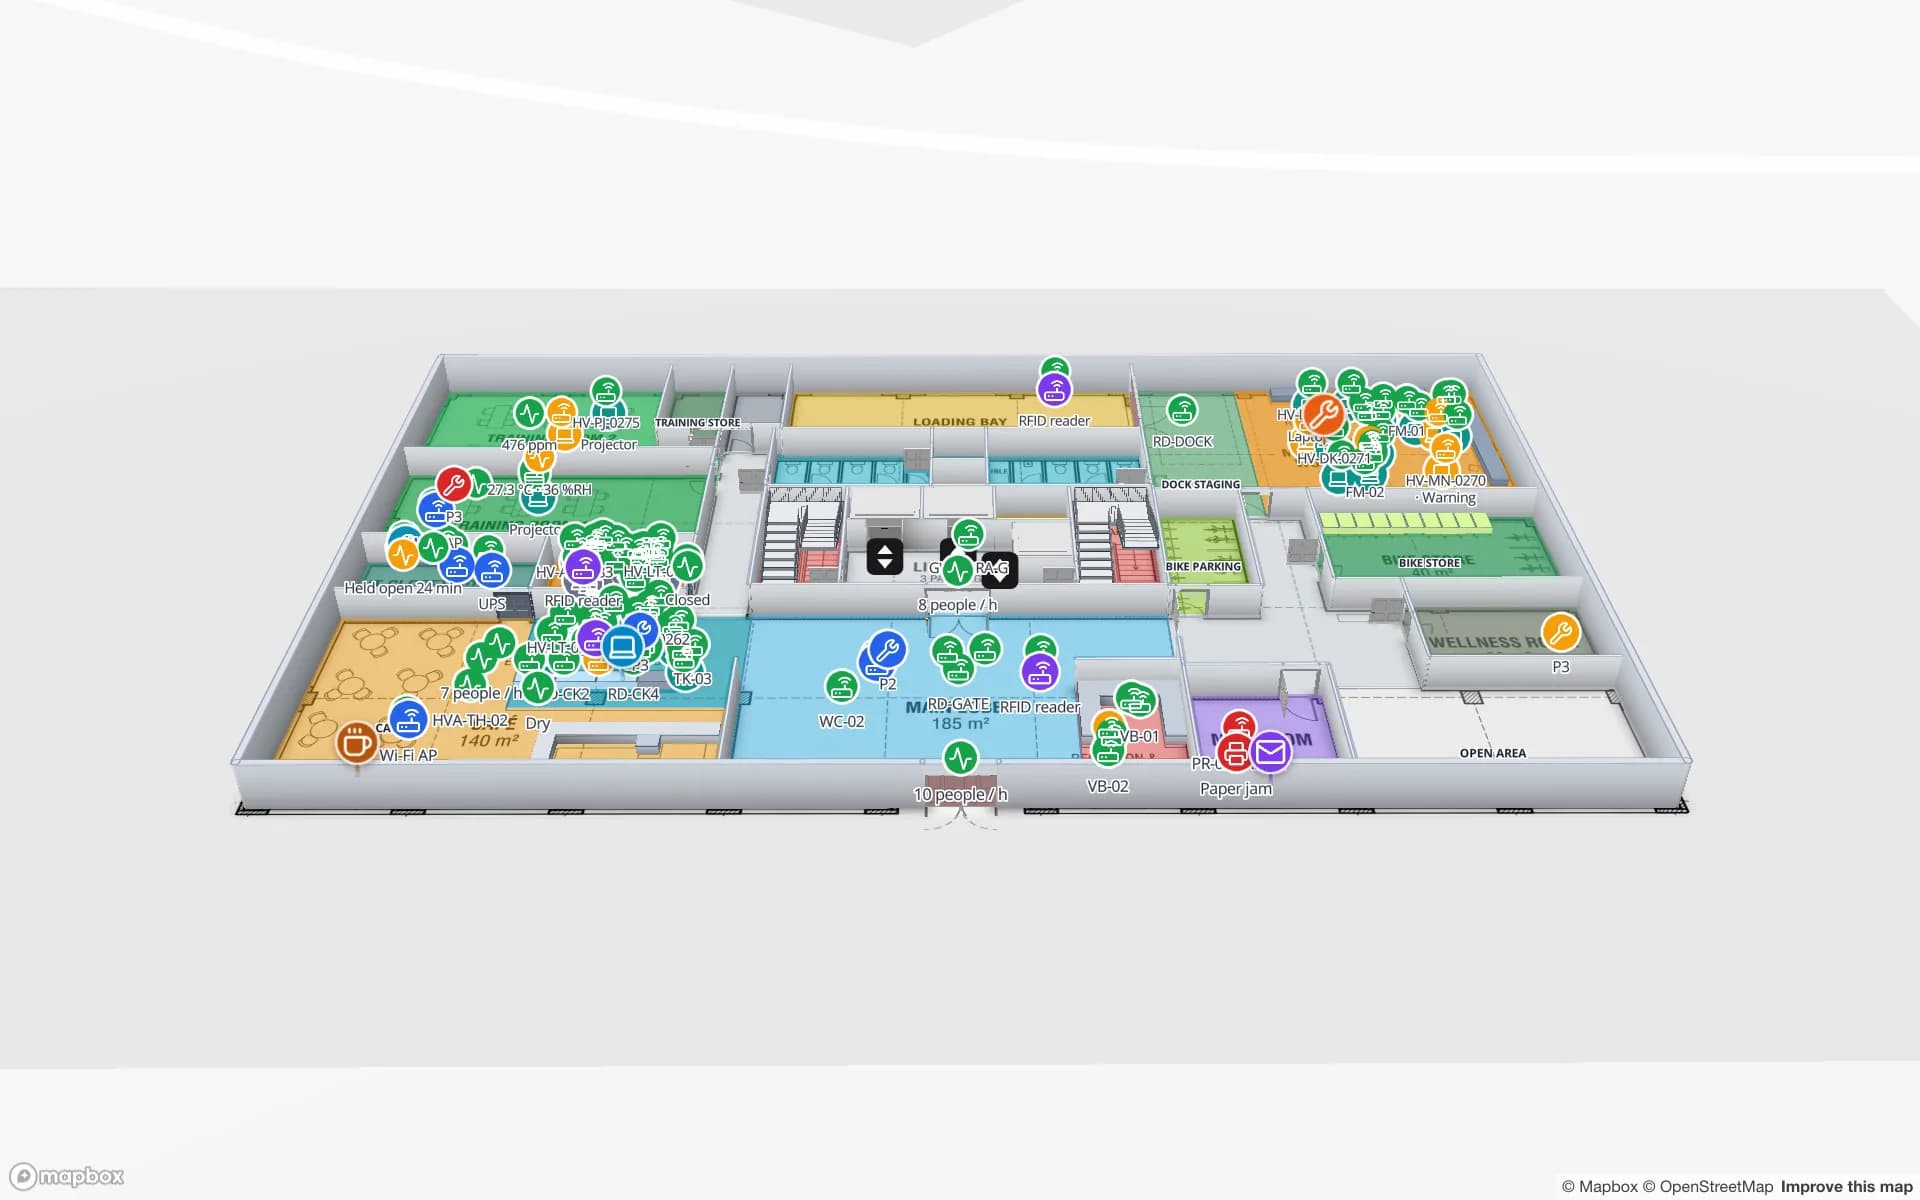
Summit Assembly Plant, a assembly plant demo, in the Spatial Map 3D viewer with live device markers
Summit Assembly Plant
Summit Assembly Plant, a demo factory: assembly lines, workstations, andon calls, WIP carriers and 867 raw-material and finished-goods rack locations over two floors.
Rack locations in the Summit assembly-plant demo
867
Floors in the Harborview office demo, with its asset register
3
How often alert rules are checked, with alerts shown in the app
15 s
Free trial, up to 5 facilities, no card
7 days

The country’s rail crossroads, and what it means for a plant

The Chicago Metropolitan Agency for Planning writes that “a quarter of all freight in the nation originates, terminates, or passes through metropolitan Chicago”, that about half of the nation’s intermodal shipments touch the area, and that the freight cluster accounts for 200,000 jobs. The Association of American Railroads adds that six Class I railroads operate in Chicago, which handles “one in four U.S. freight trains each day”, and that the CREATE program, launched in 2003, runs 70 rail and highway projects worth about $5.8 billion.

A plant that sits in that web lives with the rhythm of the rail network: inbound components arrive in bursts, outbound loads leave on a schedule, and the equipment that makes the product has to be where the next shift expects it. Asset tracking answers a narrow question that costs real time every day: which fixture, mold, gauge or returnable container is where? The Summit demo shows assembly lines, workstations, WIP carriers between stations and 867 rack locations on one plant map, and its WIP carriers are exactly the kind of tagged asset this page is about.


O’Hare’s cargo buildings: pallets, unit load devices and cold rooms

Airport Improvement reports that the final phase of O’Hare’s Northeast Cargo Development cost about $43 million and finished in August 2024. It is a 132,000-square-foot building (122,000 square feet of warehouse and 10,000 of office) that includes cold chain storage for temperature-sensitive pharmaceuticals and food, beside a ramp of more than 200,000 square feet that can handle up to a dozen jumbo freighters a day. The Department of Aviation’s cargo chief puts the airport’s cargo space at about 2 million square feet airside and 2 million landside, and tonnage at just under 1.9 million in 2019 and 2 million in 2023.

Cargo handlers keep a great deal of reusable equipment in motion: pallets, containers, dollies and the loading equipment itself. The map shows each warehouse as its own facility, with its cold rooms colored by live temperature from your sensors, and the register of equipment in a table the map reads. Check-out and return can be a handheld walk-through at a door or a reader at a gate; the asset management solution page covers the pattern, and the Polar Pharma demo shows cold rooms and 1,140 rack locations. Spatial Map makes no compliance claim for cold chain or customs; your quality system stays the record.

Food and beverage plants: returnables, tools and cold rooms

World Business Chicago’s 2022 industry profile describes the region’s traditional food and beverage manufacturing as the largest in the United States; other studies count its jobs differently, so we quote no figure. What is not in dispute is the shape of such a plant: many shifts, wash-down areas, cold rooms, returnable totes and crates that circulate between plant, distributor and customer, and maintenance tools that must be on the right line before a changeover.

Asset tracking on a food floor usually begins with the things that leave the building. Tag the totes, crates or pallets that circulate, read them at the dock door, and the map shows which are out, which are due back and which have not been seen for a week. A style rule colors overdue items on the plan, the History player replays where one has been, and a count rule raises an in-app alert when a line has fewer tools than its plan. RFID tool tracking covers the tool-crib pattern, and the Polar Pharma demo shows how cold rooms and doors appear on a plan.

Offices, labs and campuses: audits, not live positions

Not every asset in Chicago is in a factory. Downtown towers, university buildings and corporate offices hold laptops, test equipment, AV carts and shared instruments across many floors. There, asset tracking is usually an audit: an RFID handheld walk-through updates the register room by room, a reader at the store door catches what leaves, and the map shows each floor with its assets by room.

The Harborview demo shows an asset register with equipment check-out, stores and spares and work orders over three floors, and Westbrook shows lab equipment bookings and chemical stores on a campus building. Spatial Map makes no safety or compliance claim; the RFID IT asset audit page walks through an audit from end to end.

Services for teams in Chicago

Chicago teams tend to pick one of three starting points:

  • Plants and food processors begin with asset tracking for molds, totes and tools, then link it to inventory tracking for the racks.
  • Cargo and cold-store operators start with the dock doors and the cold rooms, then add equipment that moves between buildings.
  • Large plants that must locate forklifts and people continuously look at RTLS and UWB; a BlueIOT server connects directly and other engines through the write API.
  • If you have no tags or readers yet, our team can source RFID readers, antennas and tags on request, quoted per project, with warranty and device support from the manufacturer: see hardware and demo kits on request.
  • Asset back offices, handheld apps and ERP integrations are built as client projects, for example an asset management system; the same page covers POS and booking systems. Run it as cloud or on-premises.

Also served nearby

The same page covers Elk Grove Village, Bedford Park, Joliet and Elgin around the city, and Gary and Hammond on the Indiana side of the metropolitan area. Maps open in a browser, so a building in any of them needs nothing installed.

How Spatial Map does it

Building a Chicago asset map

  1. 01

    Load the asset register

    Upload a CSV or Excel list with tag IDs, owners, home locations and due dates as a table.

  2. 02

    Map stores, lines and rooms

    Import the plan, align it, and draw stores, cribs, cold rooms and lines as areas named like your readers and gateways.

  3. 03

    Connect reads and positions

    RFID middleware, BLE gateways and your ERP post rows through the write API or a polled REST endpoint.

  4. 04

    Add overdue and silence rules

    In-app alerts for totes overdue at a customer, lines short of tools and tags that stopped reporting.

Where Chicago teams track assets

Molds, gauges and WIP carriers

Where each tool is, which line it is on and which carriers sit between stations.

Returnable totes and pallets

Out, overdue and back, read at the dock door and colored on the plan.

IT, lab and office equipment

Check-out, stores and spares tied to the room they belong to.

Cold-store equipment and held stock

Cold-room readings, doors and held pallets in place.

See it on real demo facilities

Fictional names, real floor plans, live sensors, RFID, BLE tags and gateways — open any of them in the browser.

All 13 demo facilities

Asset tracking in Chicago: questions we get

No. Spatial Map is indoor mapping software for buildings and the yards behind your gate; it does not read railroad or intermodal systems. A trailer or container enters its picture when your own yard system reports it at a slot or door.

Often RFID at the tool-crib or dock door, where an item is checked out and back in, and BLE for the few high-value items you want to find between reads. Spatial Map shows either, as long as your system sends a tag ID with a read point, zone or position.

Yes. Temperature sensors send readings to a table, the room is an area on the plan, and a rule colors it when it drifts. Spatial Map makes no compliance claim; your quality system remains the record.

Yes. Your developers can push rows to a table through the write API (HTTPS, bearer API key, bulk upsert, 60 requests per minute per key), or expose a REST endpoint that Spatial Map polls. CSV and Excel uploads work too.

No. Spatial Map is sold online and our team works with customers in the United States remotely, by video call and through the contact form. There are no local resellers or partners.

In US dollars, the same worldwide: a 7-day free trial for up to 5 facilities with no card, then Pro at $60 a month or $600 a year for up to 4 facilities. Larger estates are quoted as custom services.

Track one shared-equipment pool first.

Start the free trial and open the Summit demo, or send us your asset list and the plan of a plant, cargo building or office floor through the contact form.