Yokohama · Honmoku, Daikoku, Minami Honmoku and the truck gate

RFID tracking in Yokohama, from the pier gate to the pallet in the lane

Spatial Map puts RFID reads on a live 3D map of the building where they happen, so a tag at a dock door becomes a pallet in a lane, a carton in a trailer or a rack in a bonded shed. RFID tracking in Yokohama starts with a port that has handled cargo since 1859 and has been rebuilt pier by pier: container ships at Honmoku, car ships at Daikoku, a deep-water terminal at Minami Honmoku. Your readers and middleware do the reading; Spatial Map shows each read in place. The interface is English; names and labels you write can be in Japanese.

No credit card. Runs in the browser. Pro is $60/month for up to 4 facilities. Book a demo

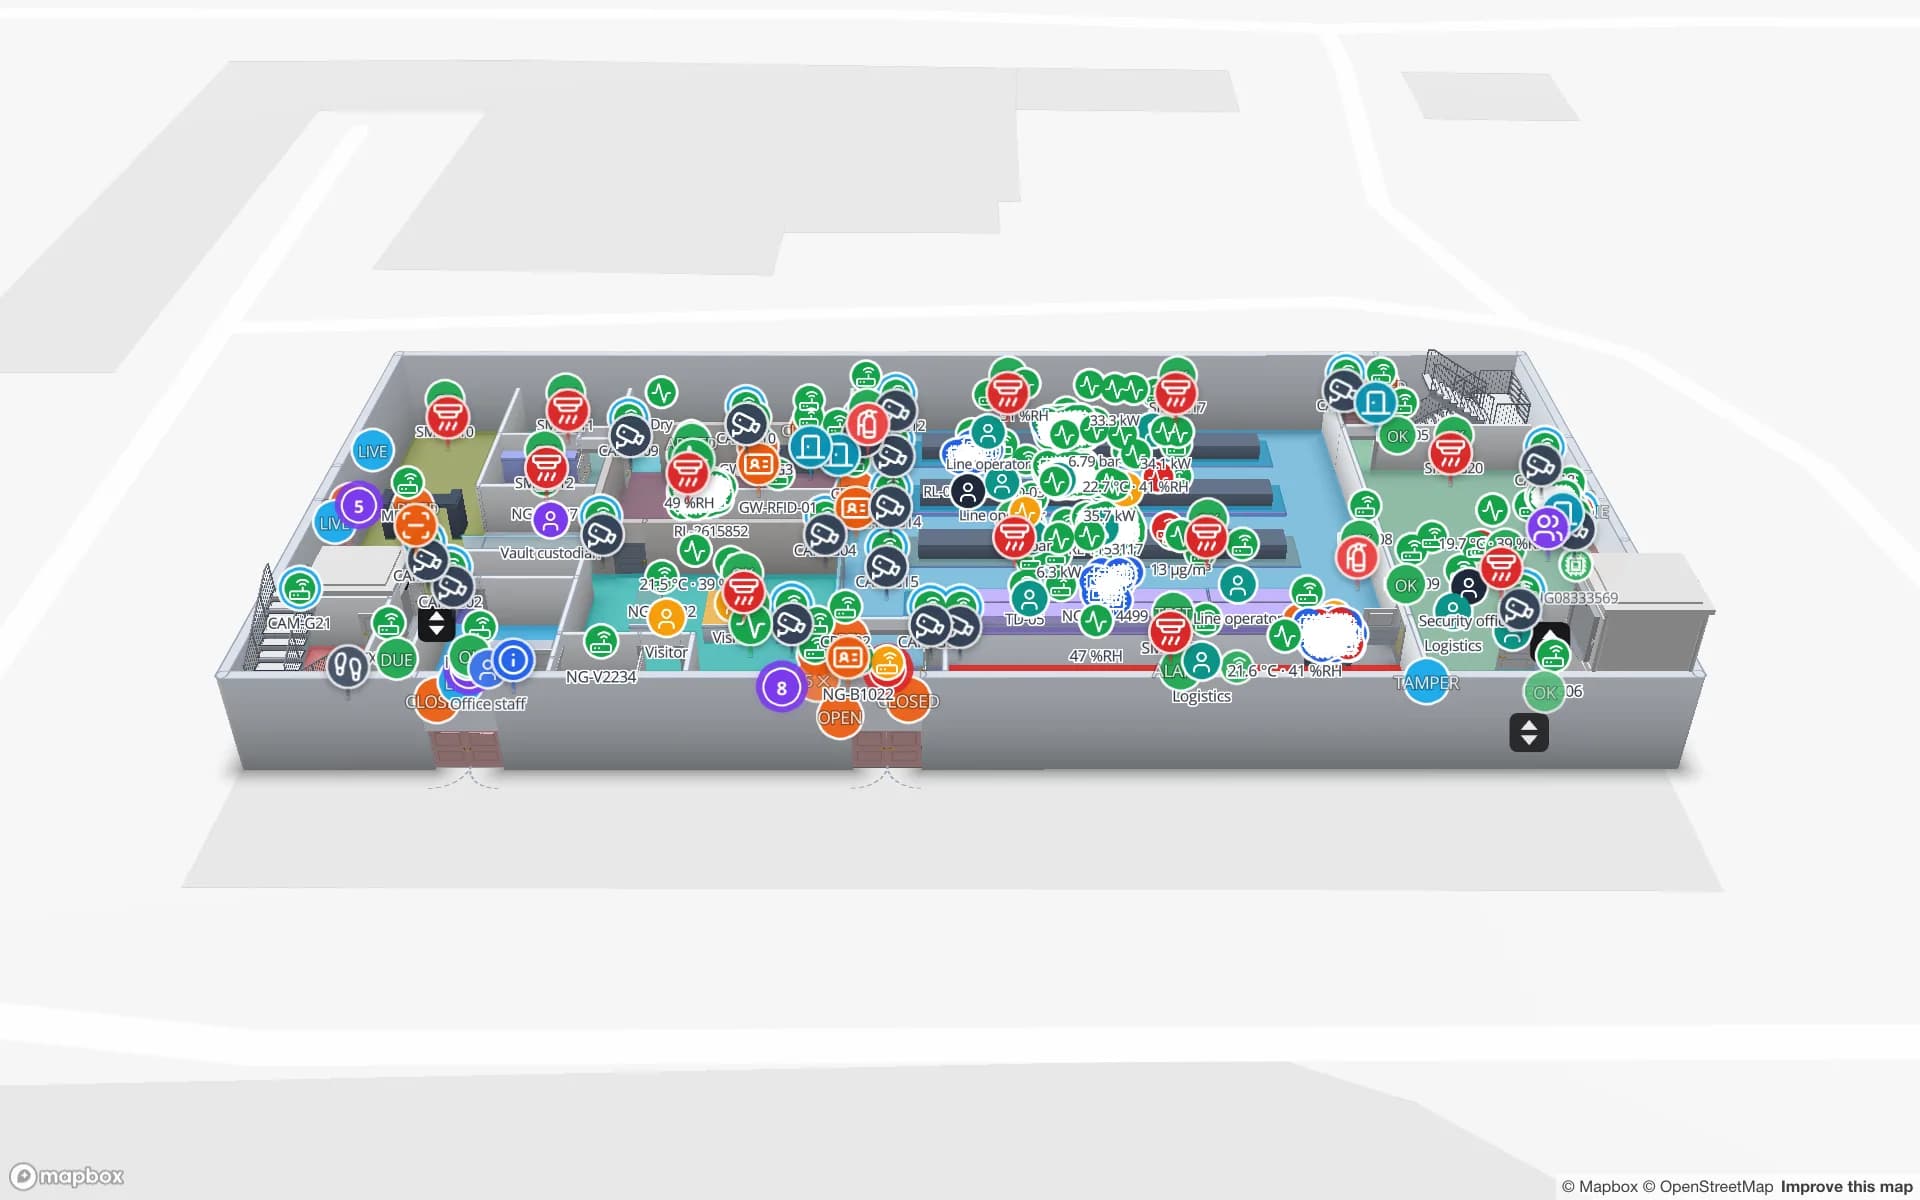
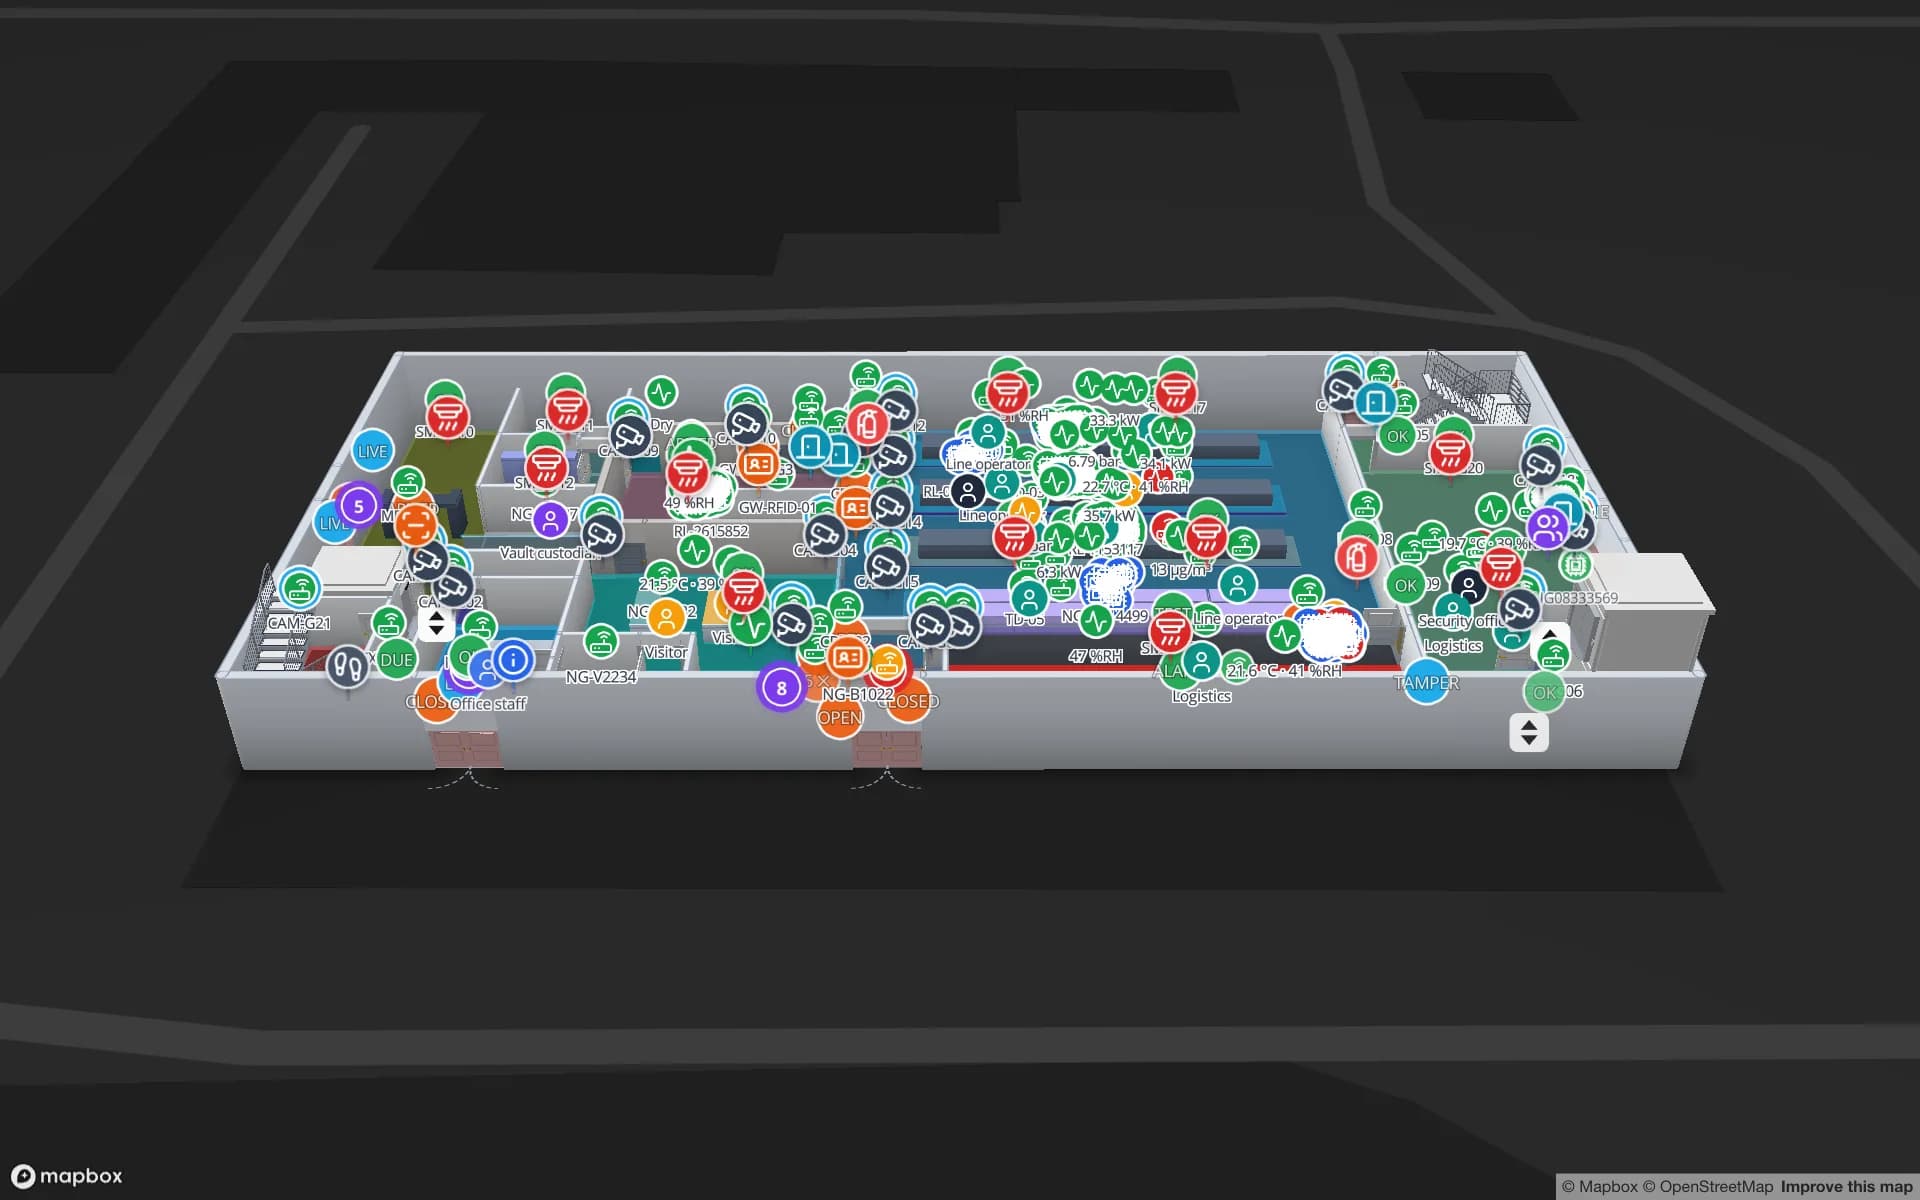
Crestline Fulfillment Center, a fulfillment center demo, in the Spatial Map 3D viewer with live device markers
Crestline Fulfillment Center
Crestline Fulfillment Center, a demo warehouse: two floors with 2,204 rack locations coloured by stock status, dock doors and staging lanes in front of the docks.
Rack locations in the Crestline demo warehouse
2,204
Dock doors in the Eastport cross-dock demo
50
How often alert rules are checked, with alerts shown in the app
15 s
Free trial, up to 5 facilities, no card
7 days

Honmoku: where the first container ship docked in 1968

The City of Yokohama dates the port’s opening to 2 June 1859. Its own chronology records that the first full-container ship docked at Honmoku Pier in 1968, and the city describes Honmoku today as a critical logistics base covering about half of the port’s container throughput, with BC, the main container terminal, in operation since December 2005. The pier has long handled everything from conventional ships to ro-ro and full container ships.

Behind a pier like that sit the buildings where a box is unpacked and cartons are re-palletised for stores and plants. Tag each pallet or carton at receiving, read it at the dock door and again at the lane, and the map shows which are staged, which are in racks and which have left. The Crestline demo shows what the map then holds: two floors, 2,204 rack locations coloured by stock status and the staging lanes before the docks. RFID in warehouses covers dock-door portals.


Daikoku: from containers toward cars, with a bonded logistics centre

Daikoku Pier covers 322 hectares with 25 berths and 5,250 metres of quay. The city’s own page says the pier is changing from container berths to car berths for ro-ro ships, which will handle finished automobiles, trucks and large construction equipment, and that after 2022 five large car carriers can dock at once along a continuous berth of 1,400 metres. Its logistics centre, opened in 1996, was designated the first comprehensive bonded zone in eastern Japan.

A pier that moves from boxes to wheeled cargo changes what its neighbours store: fewer stuffed containers, more spare parts, tyres, accessories and construction-equipment components waiting for a destination. Spatial Map does not track vehicles through the pier, and it has no link to port or customs systems. What it can do is map the sheds around it: pallets and returnable racks by lane, a bonded area coloured by a status column that your own system provides, and dwell time per lot. Customs status stays in your records; the map only shows the column you send it.

Minami Honmoku and the truck gate

Minami Honmoku Pier was begun in 1990, and its deep-water container terminal, with 16 metres of water, opened in 2001 as the country’s first of that kind. Gate queues are a recurring problem at terminals like it, and Japan’s transport ministry developed CONPAS, a system for the Keihin ports that adds truck reservations, an IC-card ID for faster gate processing and advance checks of container information. Trials at Yokohama reported that about 14 % of incoming trailers booked slots and that total waiting time for incoming trailers fell by about 10 %, and the system began operating at Minami Honmoku in March 2021.

CONPAS manages the terminal gate. Once the truck is through, a different clock starts in your own yard: which trailer is at which door, which pallets are staged for it, which door is idle. Yard slots, dock doors and trailers are drawn on the map, and gate reads or a spreadsheet of bookings fill the status columns. The Eastport demo shows 50 dock doors, 44 yard slots and 1,180 RFID pallets, and yard visibility at dock doors explains the setup. Spatial Map does not connect to CONPAS or book slots; your booking system stays.

Reading tags in a port shed: what to test first

Port sheds are tough for UHF RFID: metal racks and trailers, wet floors, cartons wrapped in film, and doors wide enough for a forklift stacked three pallets high. Read rates depend on tag choice, antenna placement and how the cargo is stacked, so test with your own pallets before buying readers for every door. The posts on read rates and missed tags and tags for metal, liquids and apparel list what to check.

Start with one door and one lane. Draw the building from the plan you already hold, with AI Map drafting walls, doors and racks for a person to review, name the read point as your middleware does, and post the reads through the table write API. A reader that stops reporting is as important as a tag that is missed, so add an alert rule “not updated for N minutes” on the reader table; it appears in the app. The RFID gates page explains portal placement.

Services for teams in Yokohama

Yokohama teams tend to begin in one of these places:

  • Forwarders and distribution centres on Honmoku and Daikoku start with inventory tracking at dock doors, because a pallet in the wrong lane costs a trailer slot.
  • Pier-side workshops and equipment yards add asset tracking for returnable racks, cages, forklifts and spare parts.
  • RTLS and UWB matters for large yards where trailers and reach trucks must be located continuously; most sheds do not need it first.
  • If you have no readers or tags yet, our team can source RFID readers, antennas and tags on request, quoted per project, with manufacturer warranty: see RFID readers and tags on request.
  • WMS bridges and Android handheld apps are built as client projects, for example an RFID inventory system. The product runs as cloud or on-premises.

Also served nearby

The same page covers Kawasaki, Yokosuka, Fujisawa and the logistics areas of Kanagawa along the bay. Buildings anywhere in the Kanto region are mapped the same way and cost the same.

How Spatial Map does it

From a Yokohama shed plan to live reads

  1. 01

    Pick one shed

    A pier-side warehouse, a bonded area or a cross-dock, wherever a misplaced pallet costs most.

  2. 02

    Draw doors, lanes and racks

    Upload a PDF, DWG (AutoCAD R2004–R2018, placed as a picture) or image, align it at real scale and let AI Map draft the floor for review.

  3. 03

    Post the reads

    RFID middleware and WMS rows arrive through the write API, a polled REST endpoint or CSV and Excel uploads.

  4. 04

    Add door and silence rules

    In-app alerts for pallets staged too long, a bonded lot past its limit and readers that stopped reporting.

What Yokohama teams track

Pier-side warehouses

Rack-level stock by bin, with staging lanes before the dock doors.

Cross-docks and yards

Dock doors, yard slots and RFID pallets staged for the right trailer.

Parts and accessories sheds

Spare parts and returnable racks read at doors, with a shrink view of what left.

Temperature-sensitive stock

Cold rooms coloured by live temperature, with held pallets marked.

See it on real demo facilities

Fictional names, real floor plans, live sensors, RFID, BLE tags and gateways — open any of them in the browser.

All 13 demo facilities

RFID tracking in Yokohama: questions we get

No. The app is in English, Spanish, French, German, Arabic and Chinese. Lot numbers, rack codes, area names and report titles you write can be in Japanese and appear as written.

No. It has no link to CONPAS, port community, customs or terminal systems. It shows what happens inside your own building, from your own RFID reads and WMS rows, so it complements those systems rather than replacing them.

It can colour an area by a status column you provide, such as “bonded” or “released”, and show how long each lot has stood there. The customs status itself stays in your own system, and Spatial Map makes no compliance claim.

UHF RFID in Japan uses the 920 MHz band, so readers and tags built for other regions do not automatically work. Confirm band and power with your supplier; if you ask us to source devices, say that the project is in Japan. Details are on the Japan page.

No. Spatial Map is sold online and our team works with customers in Japan remotely, in English, by video call and through the contact form. There are no local resellers or partners.

In US dollars, the same worldwide: a 7-day free trial for up to 5 facilities with no card, then Pro at $60 a month or $600 a year for up to 4 facilities. RFID hardware, if you ask us to source it, is quoted per project and is not part of the subscription.

Map one Yokohama dock door before the next trailer.

Start the free trial and open the Crestline demo, or send us a shed plan and a sample of your reader log through the contact form.