Nagoya · Aichi plants, aerospace supply, the port and Centrair

Asset tracking in Nagoya: dies, jigs and racks from the press shop to the port

Spatial Map shows where tagged assets are inside a building, on a live 3D map built from your own floor plan and the reads your RFID and BLE systems already produce. Asset tracking in Nagoya is mostly about things that are not the product: the dies, jigs, gauges, returnable racks and forklifts that make the product, and that cost a shift when one goes missing. Aichi leads Japan in manufacturing shipments, and the suppliers, port and airport around Nagoya move those parts every day. The interface is English; names and labels you write can be in Japanese.

No credit card. Runs in the browser. Pro is $60/month for up to 4 facilities. Book a demo

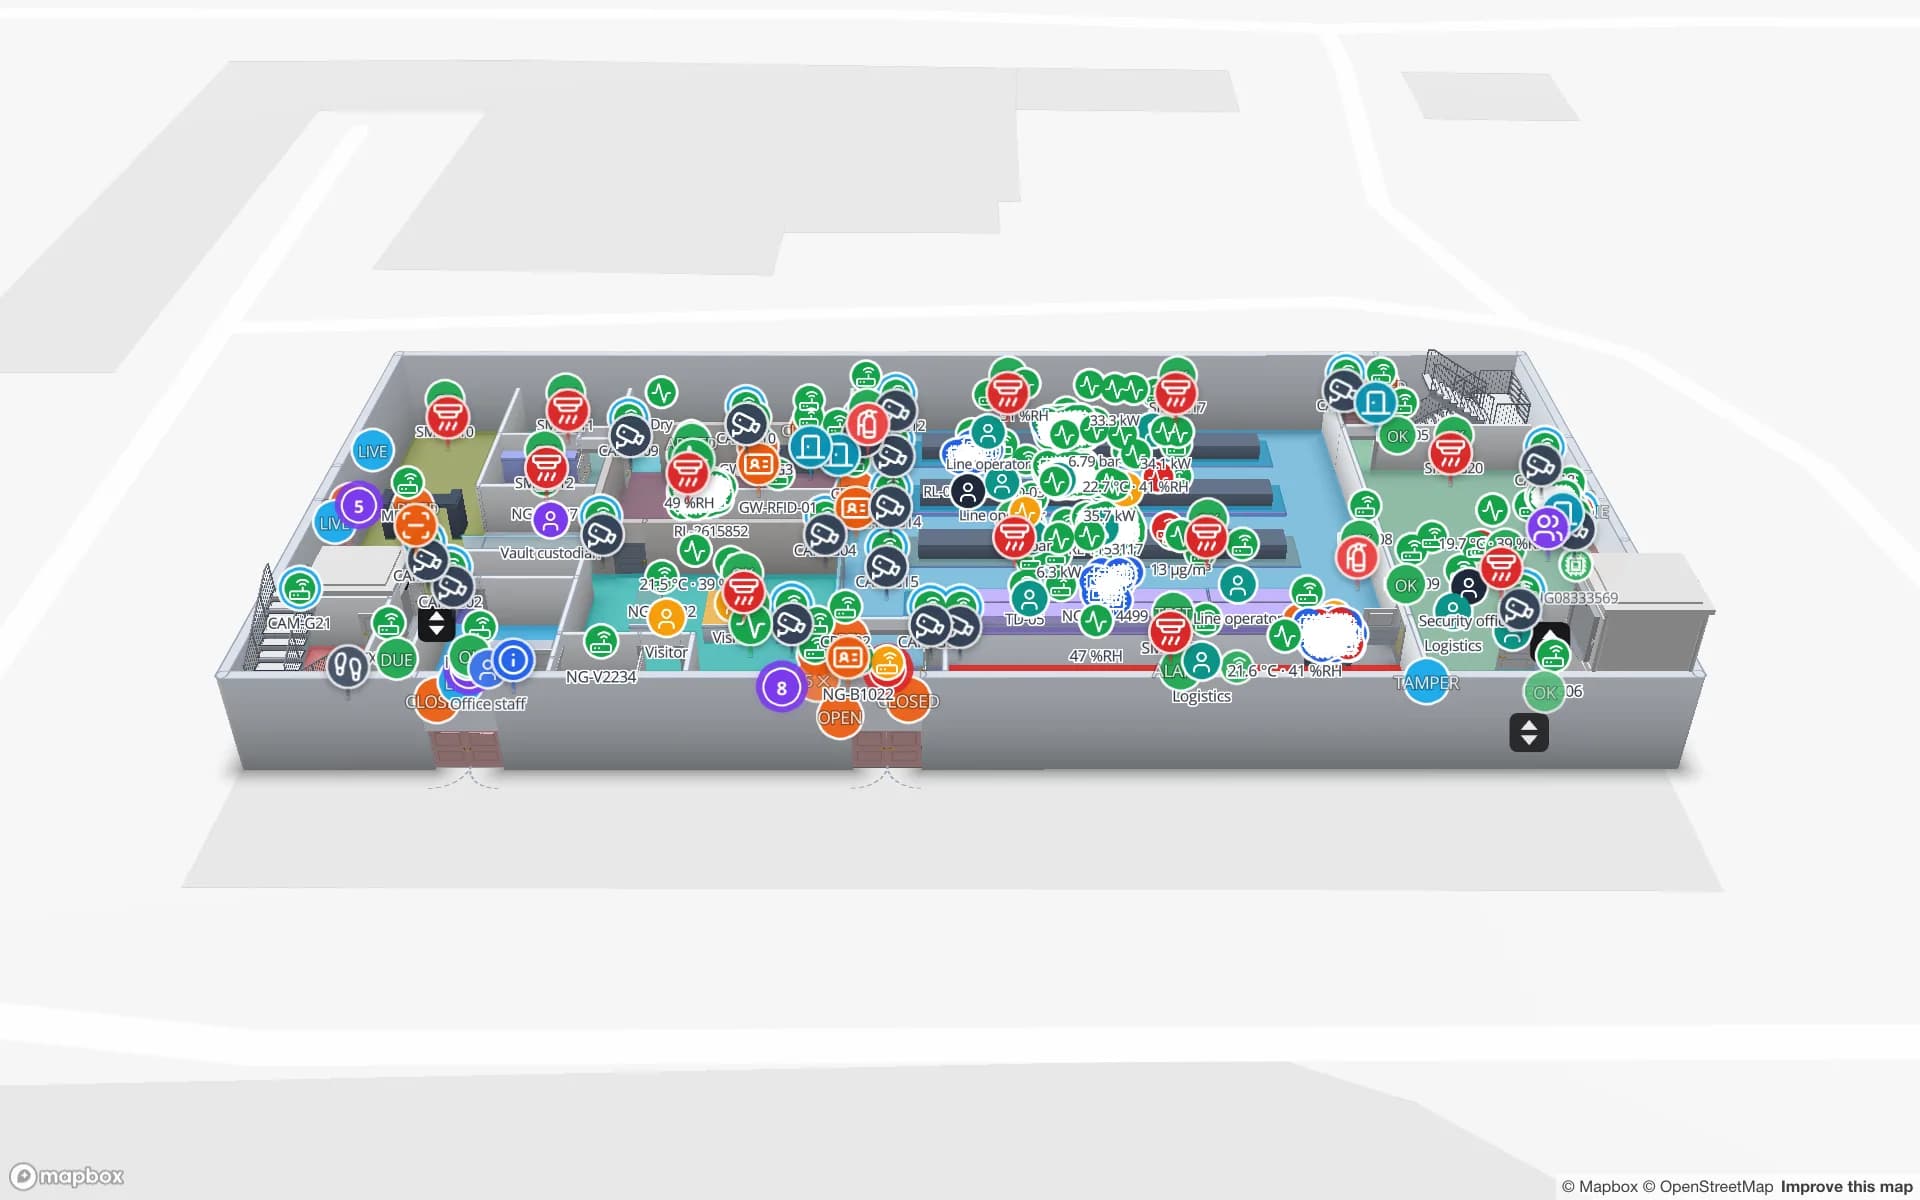
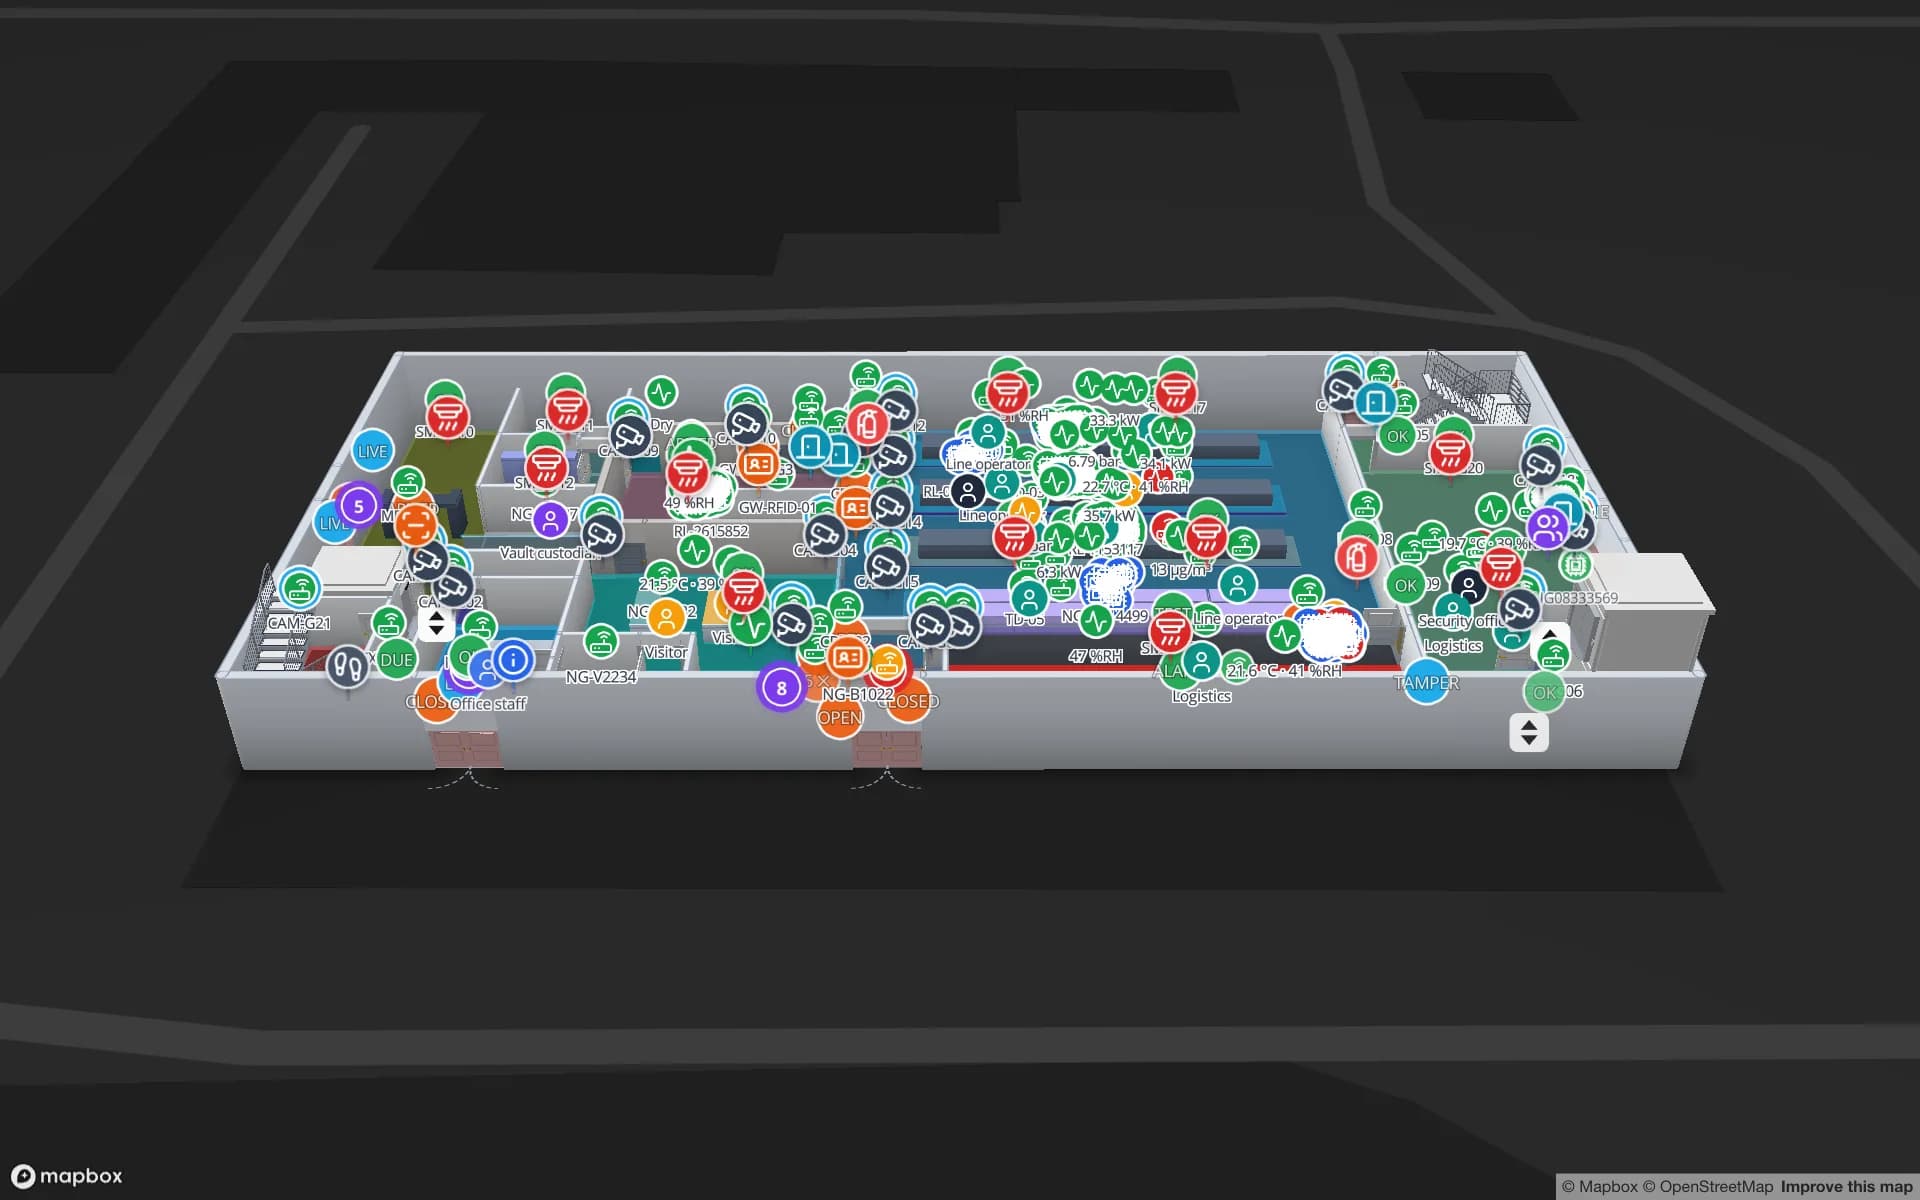
Summit Assembly Plant, a assembly plant demo, in the Spatial Map 3D viewer with live device markers
Summit Assembly Plant
Summit Assembly Plant, a demo plant: 3 assembly lines, 7 docks, 867 rack locations and 351 RFID work-in-progress carriers between stations.
RFID WIP carriers on the Summit demo plant map
351
Rack locations in the Summit demo
867
How often alert rules are checked, with alerts shown in the app
15 s
Free trial, up to 5 facilities, no card
7 days

The prefecture that has led Japan’s manufacturing shipments since 1977

Japan’s trade promotion body JETRO says Aichi has been the first prefecture in the country by total shipment value of manufactured products since 1977, and that shipments of transportation equipment alone make up about 40 % of the national total. A prefecture like that runs on supplier tiers: a press shop feeds a welding line, which feeds an assembly plant, and between each pair sits something that has to come back — a die, a fixture, a returnable rack.

Those objects are the assets worth tracking. A die moves between the press, the repair bench and the store; a gauge goes to the calibration room and comes back; a returnable rack leaves with a delivery and should return empty. Tag each one with a UHF RFID tag or a BLE tag, read it at the door of each room or area, and the map shows where it is now and where it was last read, with history you can replay. The Summit Assembly demo shows a plant with three assembly lines, seven docks and 351 RFID work-in-progress carriers moving between stations. Spatial Map does not read the tags itself; your readers and middleware post rows through the table write API, and the map colours each area from them.
Aerospace supply: the tool crib and the secure store

JETRO’s regional profile says the wider Chubu area, which includes Aichi, makes more than half of the aircraft and aircraft parts built in Japan. For a supplier in that chain, tooling and parts have another dimension: some items are high-value, some are controlled, and “who has it” has to be answered at once. The classic problem is the tool that is signed out and never signed back in.

A map does not make a tool crib safe, but it makes the question quick. Draw the crib, the kitting cages and the secure store as areas, tag the tools and high-value parts, and read them at the crib door and the cage door: the map lists what is out, who last signed it out and which area it was last seen in, and an alert rule such as “not seen for N minutes while signed out” appears in the app. The Northgate Electronics demo shows 863 RFID-tagged high-value units through a secure store with a shrink report, and the tool tracking pattern is the same. Your quality and calibration systems remain the record, and Spatial Map makes no compliance claim.

The port: five container terminals, one of them automated

The Port of Nagoya opened for international trade in 1907, and the Nagoya Port Authority was established as a special local public entity on 8 September 1951. The authority lists five container terminals — Tobishima Pier North, NCB, Tobishima Pier South, Tobishima Pier South Side and Nabeta Pier — with 13 berths and 3,955 metres of berth between them. The South Side terminal has two quake-resistant berths with 16 metres of water; its first berth entered service in December 2005 and its second in December 2008, and the authority calls it Japan’s first automated terminal, with automated guided vehicles and remote-controlled gantry cranes.

That automation stops at the terminal gate, and what happens inside your own sheds is a separate problem. Suppliers keep returnable racks, export crates and spare parts in warehouses between plant and quay, where the question is whether a returnable rack is at the plant, on a trailer or waiting at a door. Draw the dock and the yard as areas, read the tags as racks pass the door, and the map shows each rack’s location and how long it has stood there. The Eastport demo shows 50 dock doors, 44 yard slots and 1,180 RFID pallets on one map. Spatial Map has no link to port, customs or terminal-automation systems.

Centrair: an island airport for parts that cannot wait

Chubu Centrair International Airport opened on 17 February 2005 on an artificial island off Tokoname in Ise Bay, about 35 kilometres south of Nagoya and about 28 minutes by train. Air freight in a manufacturing region is mostly urgent: a replacement part for a stopped line, a sample for a customer, a tool coming back from repair abroad.

Urgent parts are the ones most often lost between receiving and the line. Give each inbound urgent consignment a row in a table with a due time, read its tag at the receiving door, and colour an “expedite” lane on the map by status; an alert rule can flag a consignment still in receiving after N minutes. It is the same pattern as a dock-door turn, only with a clock on every pallet. Inventory tracking covers the receiving side; the RFID gates guide explains where portals go.

Services for teams in Nagoya

Nagoya teams tend to begin in one of these places:

  • Plants and Tier 1 and Tier 2 suppliers start with asset tracking for dies, jigs, gauges and returnable racks, because a missing fixture stops a line.
  • Warehouses and forwarders near the port start with inventory tracking at dock doors, then add racks and trailers.
  • RTLS and UWB matters for large assembly halls and yards where forklifts and carts must be located continuously; most plants do not need it first.
  • If you have no readers or tags yet, our team can source RFID, BLE and UWB devices on request, quoted per project, with manufacturer warranty: see hardware and demo kits on request.
  • Where a handheld app, an ERP or WMS bridge or a tool sign-out screen is needed, our team builds it as a client project, for example an asset management system. The product runs as cloud or on-premises.

Also served nearby

The same page covers the Mikawa area including Okazaki, Kariya and Anjo, Ichinomiya and Komaki, Tokoname and Chita, Gifu and Yokkaichi. Plants anywhere in Chubu are mapped the same way and cost the same.

How Spatial Map does it

From a Nagoya plant plan to a live asset map

  1. 01

    Pick the assets that stop a line

    Dies, jigs, gauges, returnable racks or forklifts: start with the ones whose loss costs most.

  2. 02

    Map the rooms they move through

    Upload the plan, photo or sketch; AI Map drafts walls, doors, racks and areas for a person to review, and you name read points as your middleware does.

  3. 03

    Post reads and sign-outs

    Reader middleware, a tool sign-out sheet or a handheld app posts rows through the write API, a polled REST endpoint or CSV and Excel uploads.

  4. 04

    Add rules for what must come back

    In-app alerts for assets out of their area, not seen for N minutes, or readers that stopped reporting.

What Nagoya teams track

Dies, jigs and fixtures

Where each one is between the press, the bench and the store, with a history you can replay.

Tool crib and secure store

High-value tools and parts read at the crib door, with what is out and a shrink report.

WIP carriers and line-side stock

Carriers between stations, raw-material racks and held lots.

Port-side docks and yards

Returnable racks and pallets staged for the right trailer.

See it on real demo facilities

Fictional names, real floor plans, live sensors, RFID, BLE tags and gateways — open any of them in the browser.

All 13 demo facilities

Asset tracking in Nagoya: questions we get

No. The app is in English, Spanish, French, German, Arabic and Chinese. Asset names, die numbers, room names and report titles you write can be in Japanese and appear as written.

Not directly. Spatial Map is not an equipment-automation system. Your MES, RFID middleware or sign-out screen posts rows to a table, or exposes a REST endpoint that Spatial Map polls, and the map shows them in place.

It makes no compliance claim. It shows where tagged tools and parts are and who last signed them out, with history and in-app alerts, but your quality system, calibration records and customer audits remain the record.

Yes, as read-only share links limited to chosen floors and layers, with an expiry date and a view cap, or as separate facilities with their own roles. Spatial Map does not merge two companies’ systems.

No. Spatial Map is sold online and our team works with customers in Japan remotely, in English, by video call and through the contact form. There are no local resellers or partners.

In US dollars, the same worldwide: a 7-day free trial for up to 5 facilities with no card, then Pro at $60 a month or $600 a year for up to 4 facilities. Larger estates are quoted as custom services; RFID hardware, if you ask us to source it, is quoted per project.

Put the dies and racks of one Nagoya plant on a map.

Start the free trial and open the Summit demo, or send us a plant plan and a sample of your tool sign-out sheet through the contact form.