Osaka · Hanshin Port, Yumeshima and Kansai airport

Warehouse tracking in Osaka, from island terminals to the cold room

Spatial Map shows where pallets, cartons and equipment are inside a building, on a live 3D map built from your own floor plan and your own RFID, WMS and sensor data. Warehouse tracking in Osaka is shaped by land that was made: Osaka Bay’s container terminals and its airport stand on reclaimed islands, and the distribution buildings that serve them sit close by. The interface is English; names and labels you write can be in Japanese.

No credit card. Runs in the browser. Pro is $60/month for up to 4 facilities. Book a demo

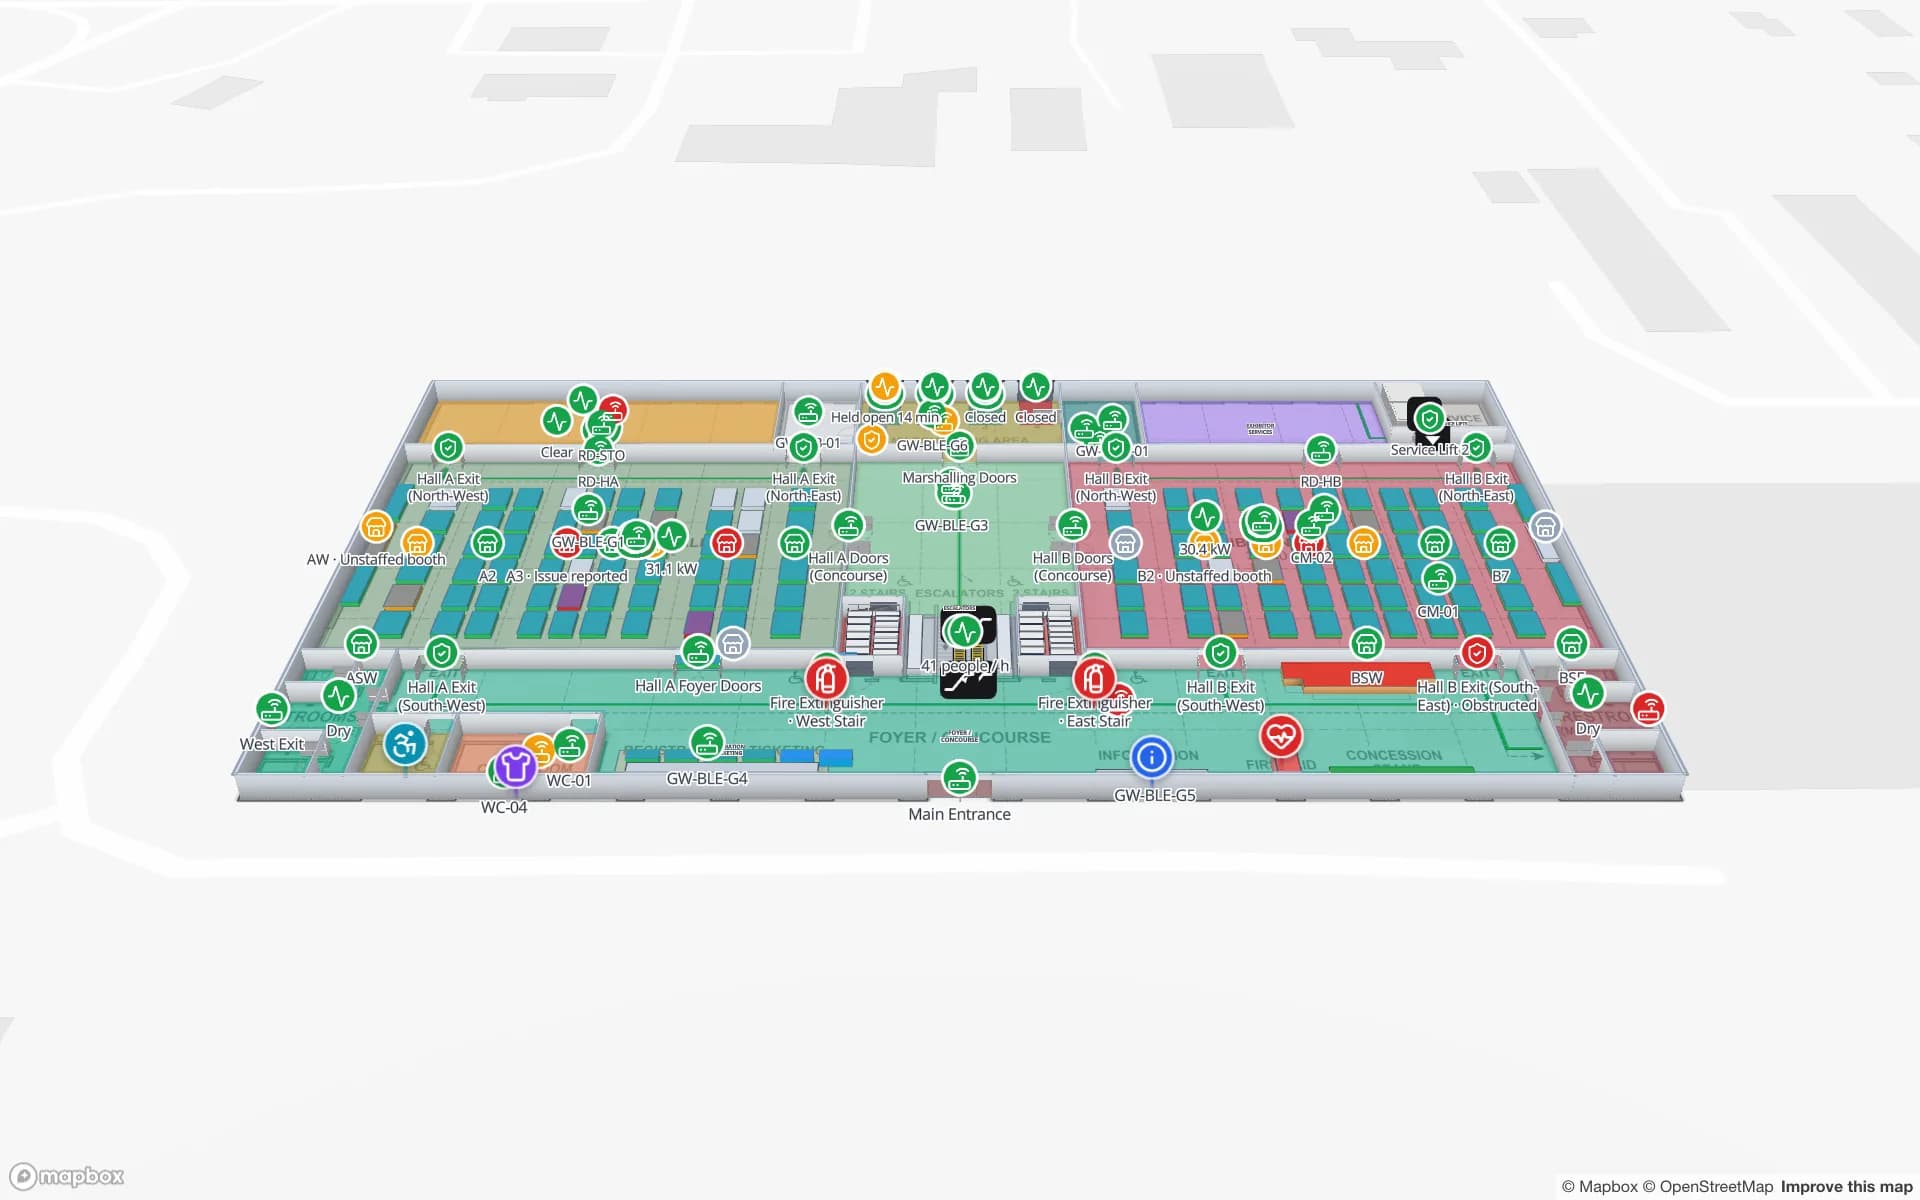
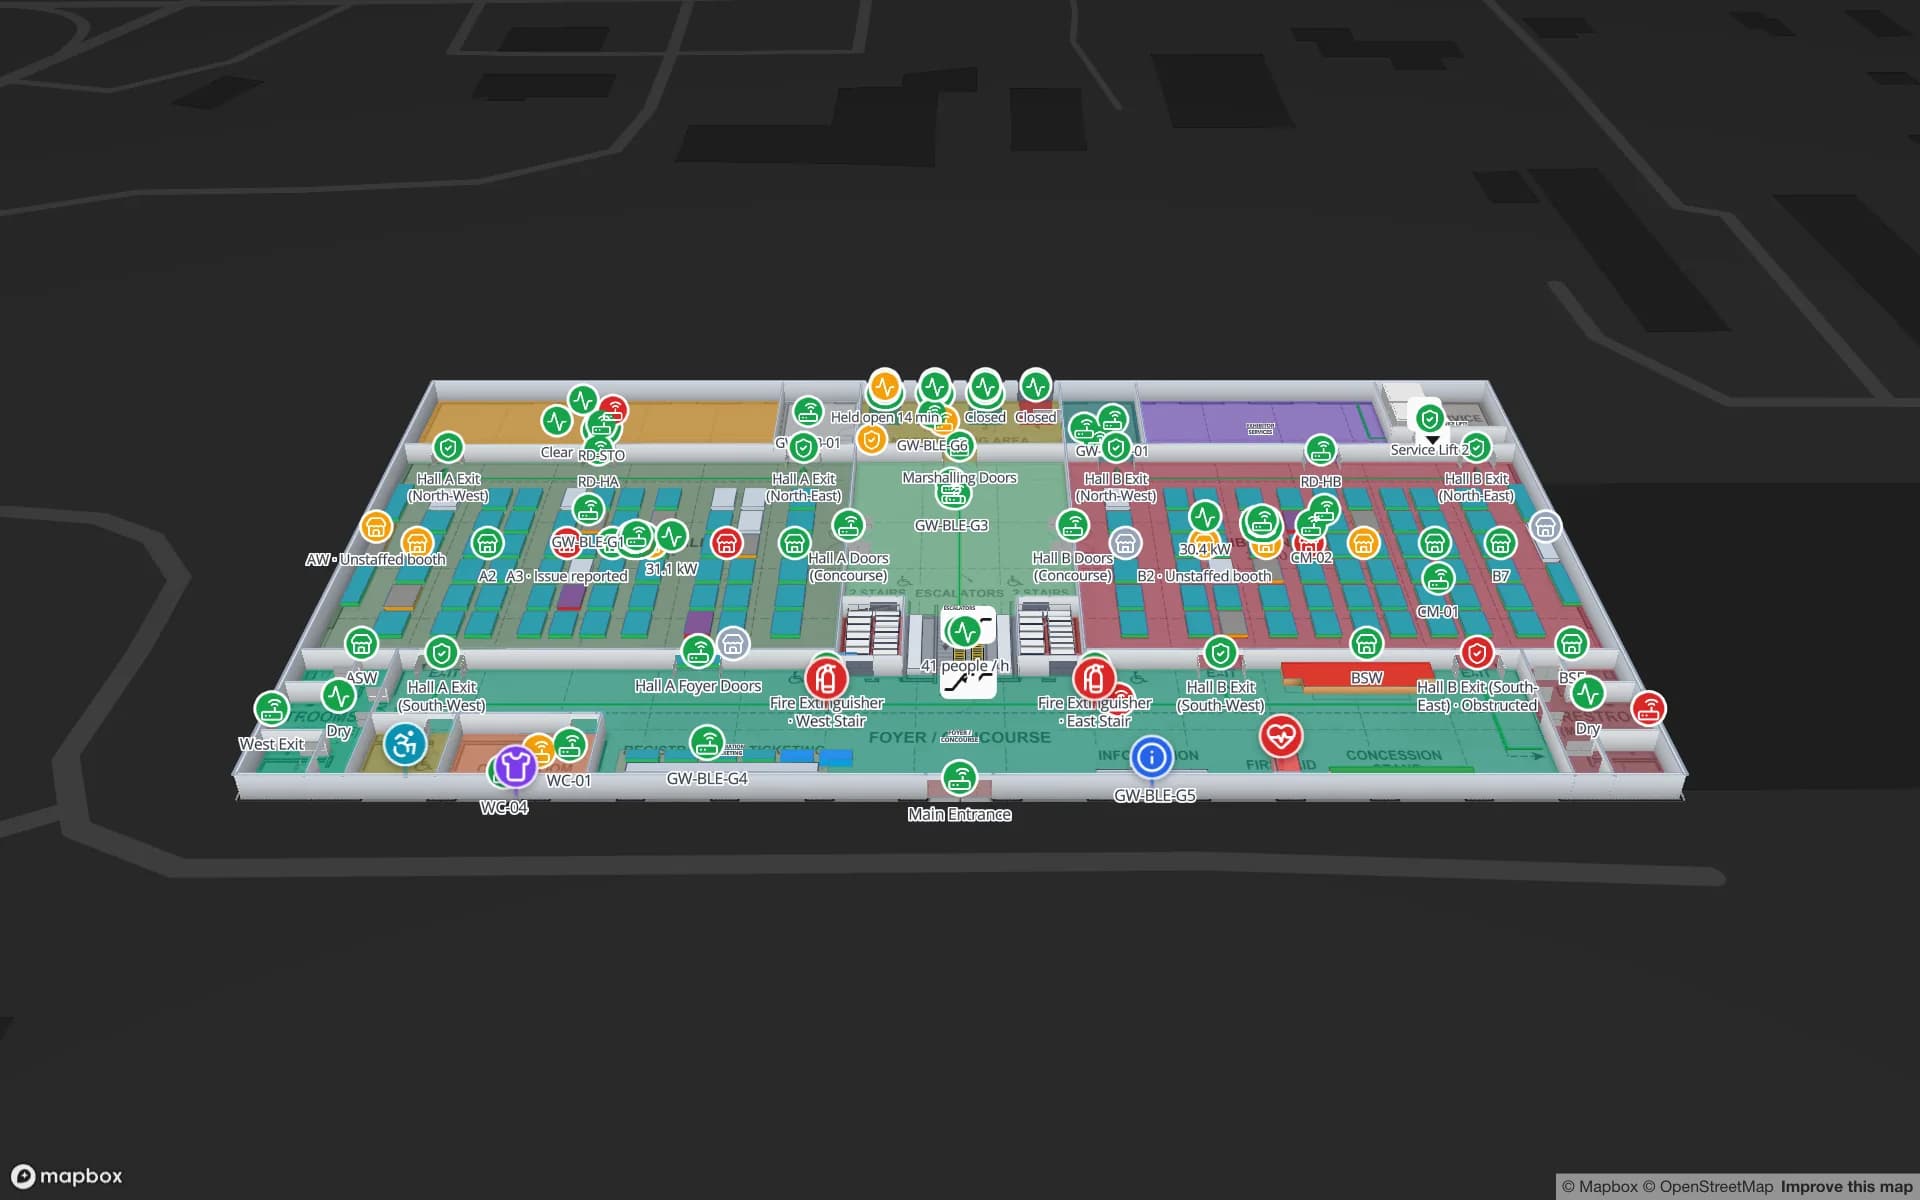
Crestline Fulfillment Center, a fulfillment center demo, in the Spatial Map 3D viewer with live device markers
Crestline Fulfillment Center
Crestline Fulfillment Center, a demo warehouse: two floors with 2,204 rack locations coloured by stock status and the staging lanes in front of the docks.
Rack locations in the Crestline demo warehouse
2,204
Rack locations in the Polar Pharma cold-storage demo
1,140
How often alert rules are checked, with alerts shown in the app
15 s
Free trial, up to 5 facilities, no card
7 days

Hanshin Port: two cities, one port group, built on islands

The ports of Osaka Bay started to function as a single Hanshin Port in 2007, and in August 2010 the national government selected Hanshin Port, made up of Osaka and Kobe, as a strategic international container port, together with Keihin Port. On the Osaka side the container terminals are at Sakishima (berths C-1 to C-4, C-8 and C-9, with 13.5 to 14 metres of water) and Yumeshima (C-10 to C-12, with 15 to 16 metres). Kobe’s terminals stand on Port Island and Rokko Island, both reclaimed from the sea because flat land is scarce at the foot of Mount Rokko.

Cargo does not stay at the quay. Boxes are unpacked and cartons re-palletised in warehouses a short drive away, and what matters inside those buildings is lanes, racks and doors, not berths. Tag pallets at receiving, read them at the dock door, and the Crestline demo shows what the map then holds: two floors, 2,204 rack locations coloured by stock status and the staging lanes before the docks. Spatial Map has no link to terminal or customs systems; it shows what your own reads and WMS say. RFID warehouse management covers dock-door portals.


Yumeshima: terminals and an Expo site on one island

Yumeshima, an artificial island in Osaka Bay, carries the newest Osaka container terminals and was the site of Expo 2025, which ran from 13 April to 13 October 2025. A site that moves from one use to another leaves a pattern that logistics teams know: staging yards, marshalling areas, loading docks, and crates and fittings that must be accounted for when an event ends or a building is handed over.

The same pattern applies to any large event or fit-out. Draw the staging yard and docks as areas, tag the returnable crates and equipment, read them at the dock, and keep a table of what is expected to come back. An alert rule such as “not returned within N minutes of the handover” appears in the app, and the Lakeside demo shows freight bookings and loading docks beside the halls. Stadium and venue operations explains how.

Kansai International Airport: cargo on a 24-hour island

Kansai International Airport opened on 4 September 1994 on an artificial island in Osaka Bay, which allowed it to operate around the clock. The airport’s own cargo pages list 24-hour operation and a cool chain among the strengths of its cargo business, and a Kansai government investment brochure describes it the same way.

For a forwarder or a pharmaceutical store the cool chain is the part to map. Each cold room becomes an area coloured by the live reading from its sensor, quarantine and held pallets are marked, and an alert rule such as “reading out of range for 10 minutes” is checked every 15 seconds and raised in the app, not by email or SMS. The Polar Pharma demo shows cold rooms, a QC lab and 1,140 rack locations; pharma cold storage and QC temperature monitoring explains the setup. Your quality system remains the record, and Spatial Map makes no compliance claim.

Distribution buildings across Kansai

Between the ports, the airport and the region’s shops and factories stand multi-tenant distribution buildings. Where one has several floors, ramps or cargo lifts, model each level from its own plan and join them with stairs and lifts; data links are scoped per floor, so racks on level 3 are coloured from the rows that belong to level 3. Multi-floor 3D warehouses explains how.

Where a building has several tenants, map it as one facility per tenant, or one facility with areas per tenant, and give each tenant a read-only share link limited to its own floors, with an expiry date and a view cap. A landlord sees the whole building and each tenant sees its own part. Start with the doors if you have no tags yet: dock turns and trailer waits can be logged from a spreadsheet before any reader is bought.

Services for teams in Osaka

Osaka teams usually follow this order:

Also served nearby

The same page covers Kobe, Sakai, Amagasaki, Nishinomiya and Himeji, Kyoto and the towns along the bay. Buildings anywhere in Kansai are mapped the same way and cost the same.

How Spatial Map does it

From a Kansai warehouse plan to a live map

  1. 01

    Pick one building

    A dock-side warehouse, an air-cargo shed or a cold room, wherever a misplaced pallet costs most.

  2. 02

    Map doors, lanes and racks

    Upload the plan, photo or sketch; AI Map drafts the floor for review, and you name read points as your middleware does.

  3. 03

    Connect reads, stock and sensors

    WMS, RFID middleware and temperature sensors post rows through the write API, a polled REST endpoint or CSV and Excel uploads.

  4. 04

    Add door and silence rules

    In-app alerts for pallets staged too long, rooms out of range and readers that stopped reporting.

What Osaka teams track

Port-side warehouses

Rack-level stock by bin, with staging lanes before the dock doors.

Cross-docks and yards

Dock doors, yard slots and RFID pallets staged for the right trailer.

Air-cargo cold rooms

Rooms coloured by live temperature, with held pallets marked.

Event freight and returnable crates

Loading docks, bookings and crate tags read from the dock to the hall.

See it on real demo facilities

Fictional names, real floor plans, live sensors, RFID, BLE tags and gateways — open any of them in the browser.

All 13 demo facilities

Warehouse tracking in Osaka: questions we get

No. The app is in English, Spanish, French, German, Arabic and Chinese. Rack codes, room names, tenant names and report titles you write can be in Japanese and appear as written.

No. It has no link to port community, customs, terminal or airport cargo systems. It shows what happens inside your own building from your own RFID reads, WMS and sensors, so it complements those systems rather than replacing them.

Yes. Read-only share links can be limited to chosen floors and layers, with an expiry date and a view cap, and can be revoked at any time. Members of your workspace have roles that limit which facilities they see.

No. It shows live readings, history and in-app alerts for rooms, but your quality system remains the record, and Spatial Map makes no compliance claim. Alerts appear in the app only, not by email or SMS.

No. Spatial Map is sold online and our team works with customers in Japan remotely, in English, by video call and through the contact form. There are no local resellers or partners.

In US dollars, the same worldwide: a 7-day free trial for up to 5 facilities with no card, then Pro at $60 a month or $600 a year for up to 4 facilities. RFID hardware, if you ask us to source it, is quoted per project and is not part of the subscription.

Map one Osaka dock before the next shipment.

Start the free trial and open the Crestline demo, or send us the plan of a warehouse or cold room and a sample of your WMS rows through the contact form.