Surat · Pandesara, Sachin, Palsana and the PM MITRA park

Asset tracking in Surat, for beams, trolleys and the machines that make cloth

Spatial Map shows where tagged equipment, trolleys and returnable containers are on a live 3D map of each building, using the reads and positions your RFID and BLE systems already produce. For asset tracking in Surat the textile problem comes first: hundreds of thousands of looms and hundreds of processing units share a handful of clusters, and what circulates between them are beams, rolls, trolleys and spares that nobody wants to lose. Each shed or processing house can be its own facility with its own map.

No credit card. Runs in the browser. Pro is $60/month for up to 4 facilities. Book a demo

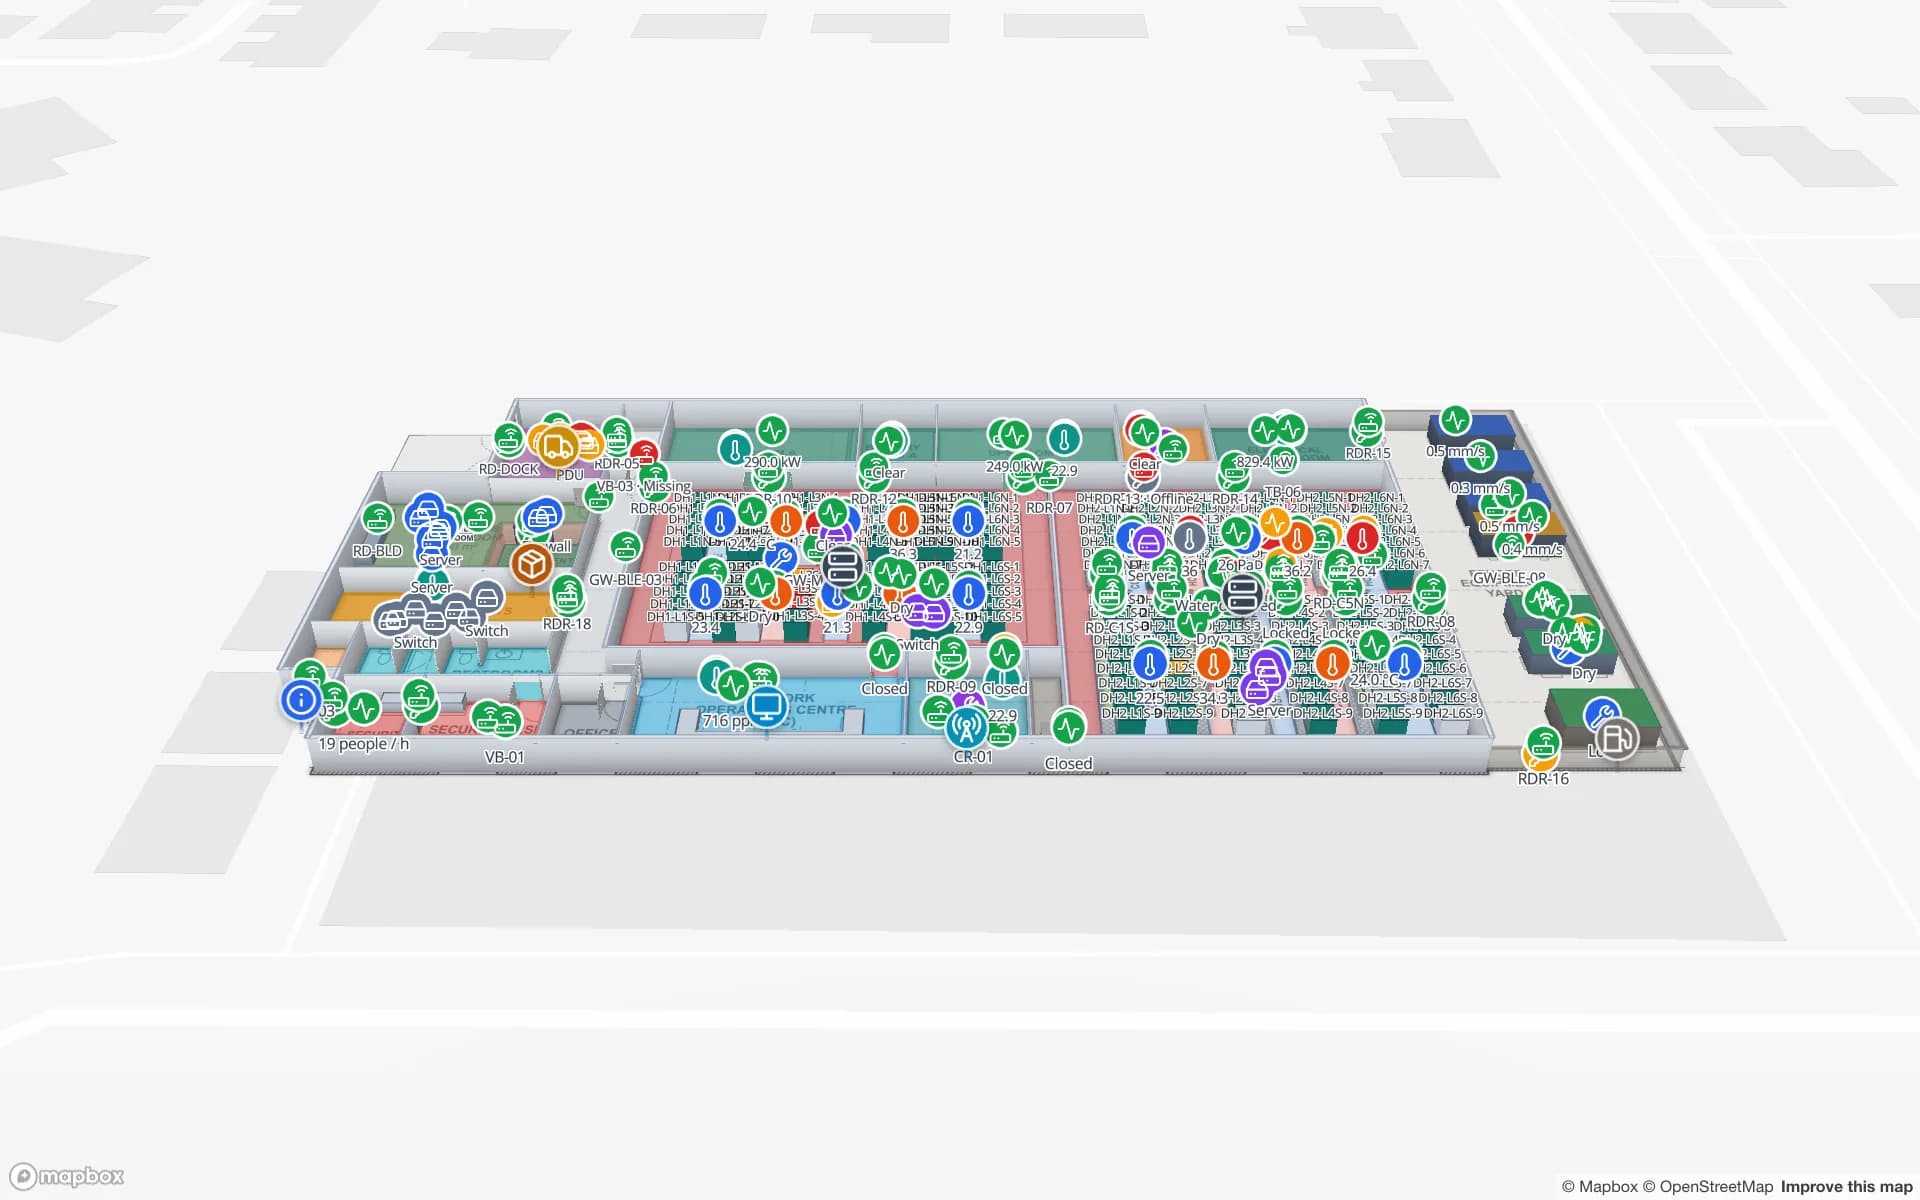
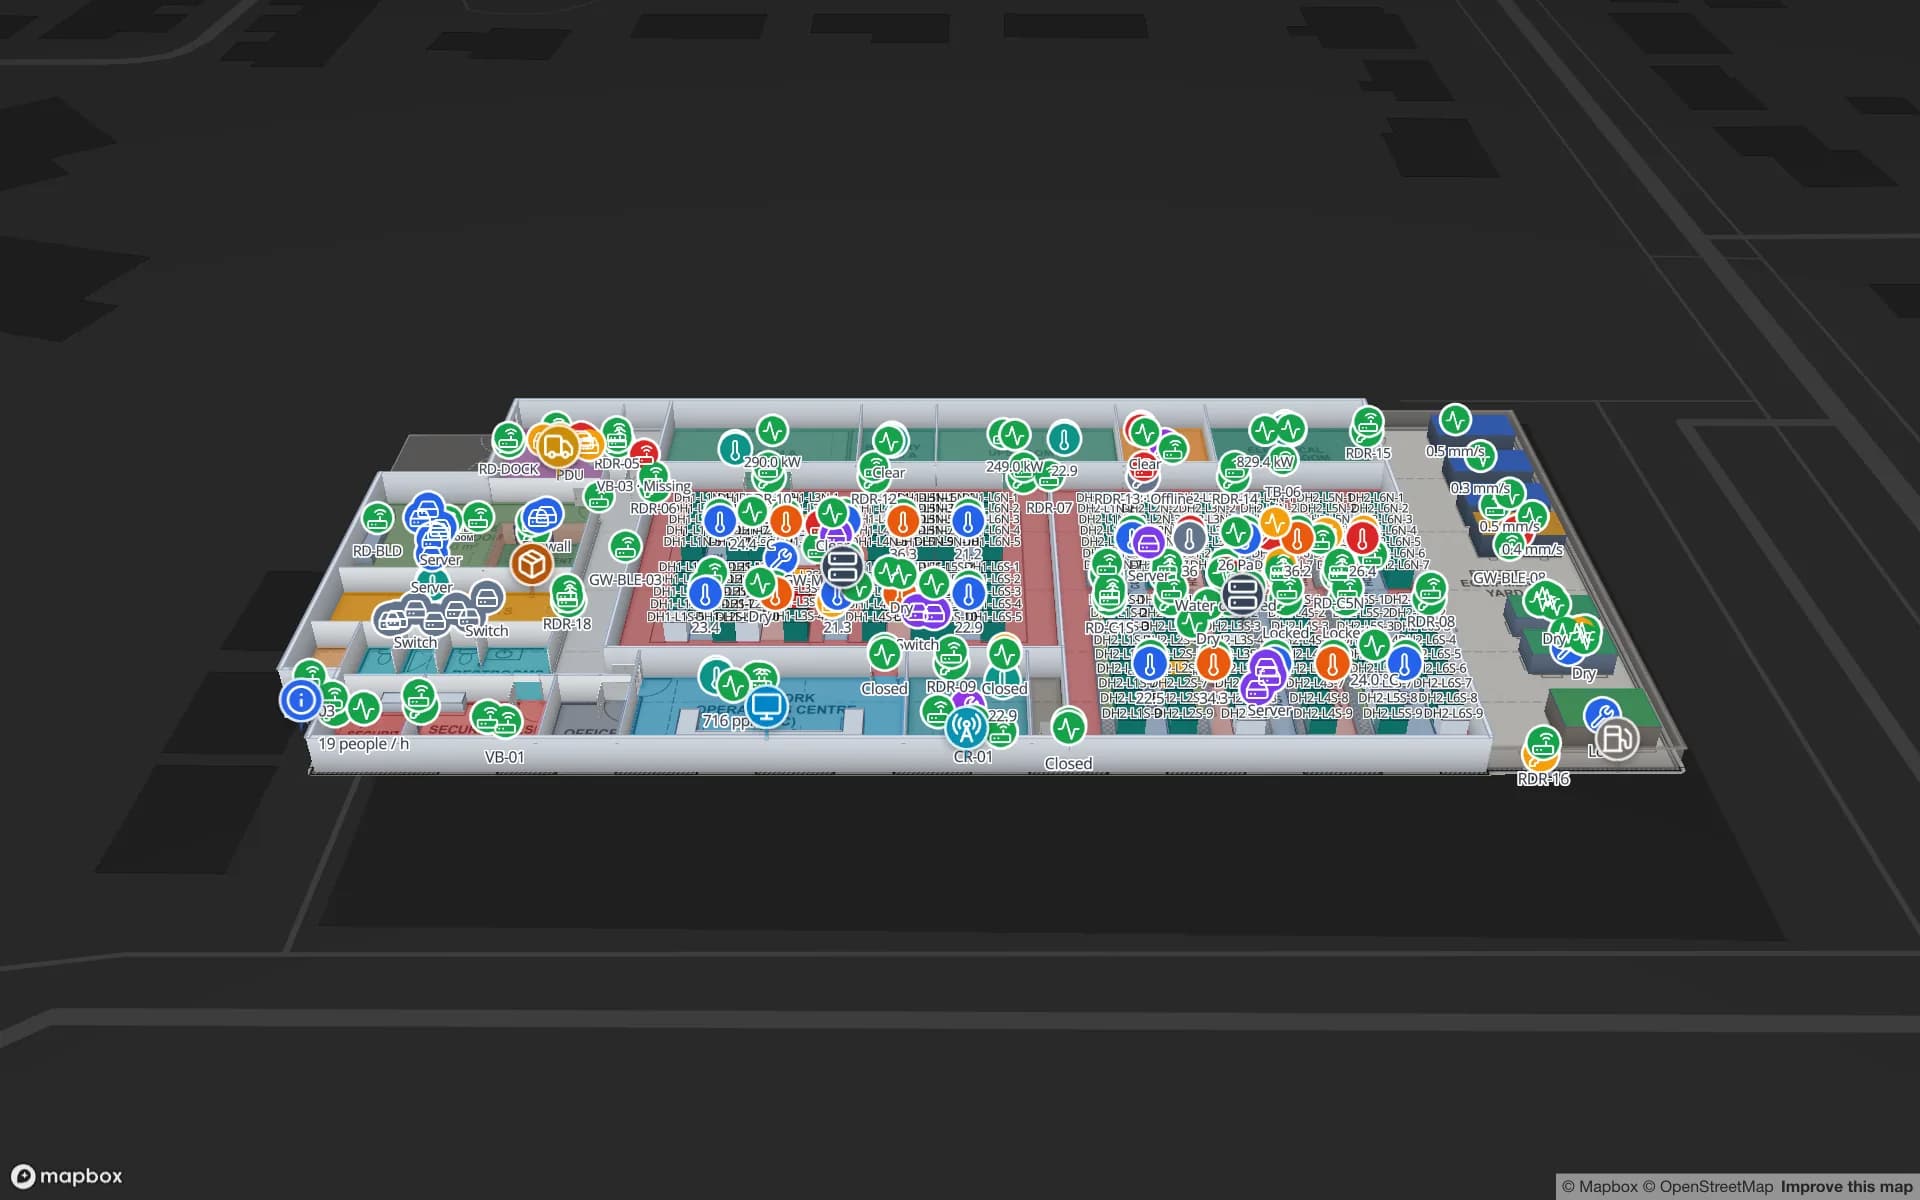
Summit Assembly Plant, a assembly plant demo, in the Spatial Map 3D viewer with live device markers
Summit Assembly Plant
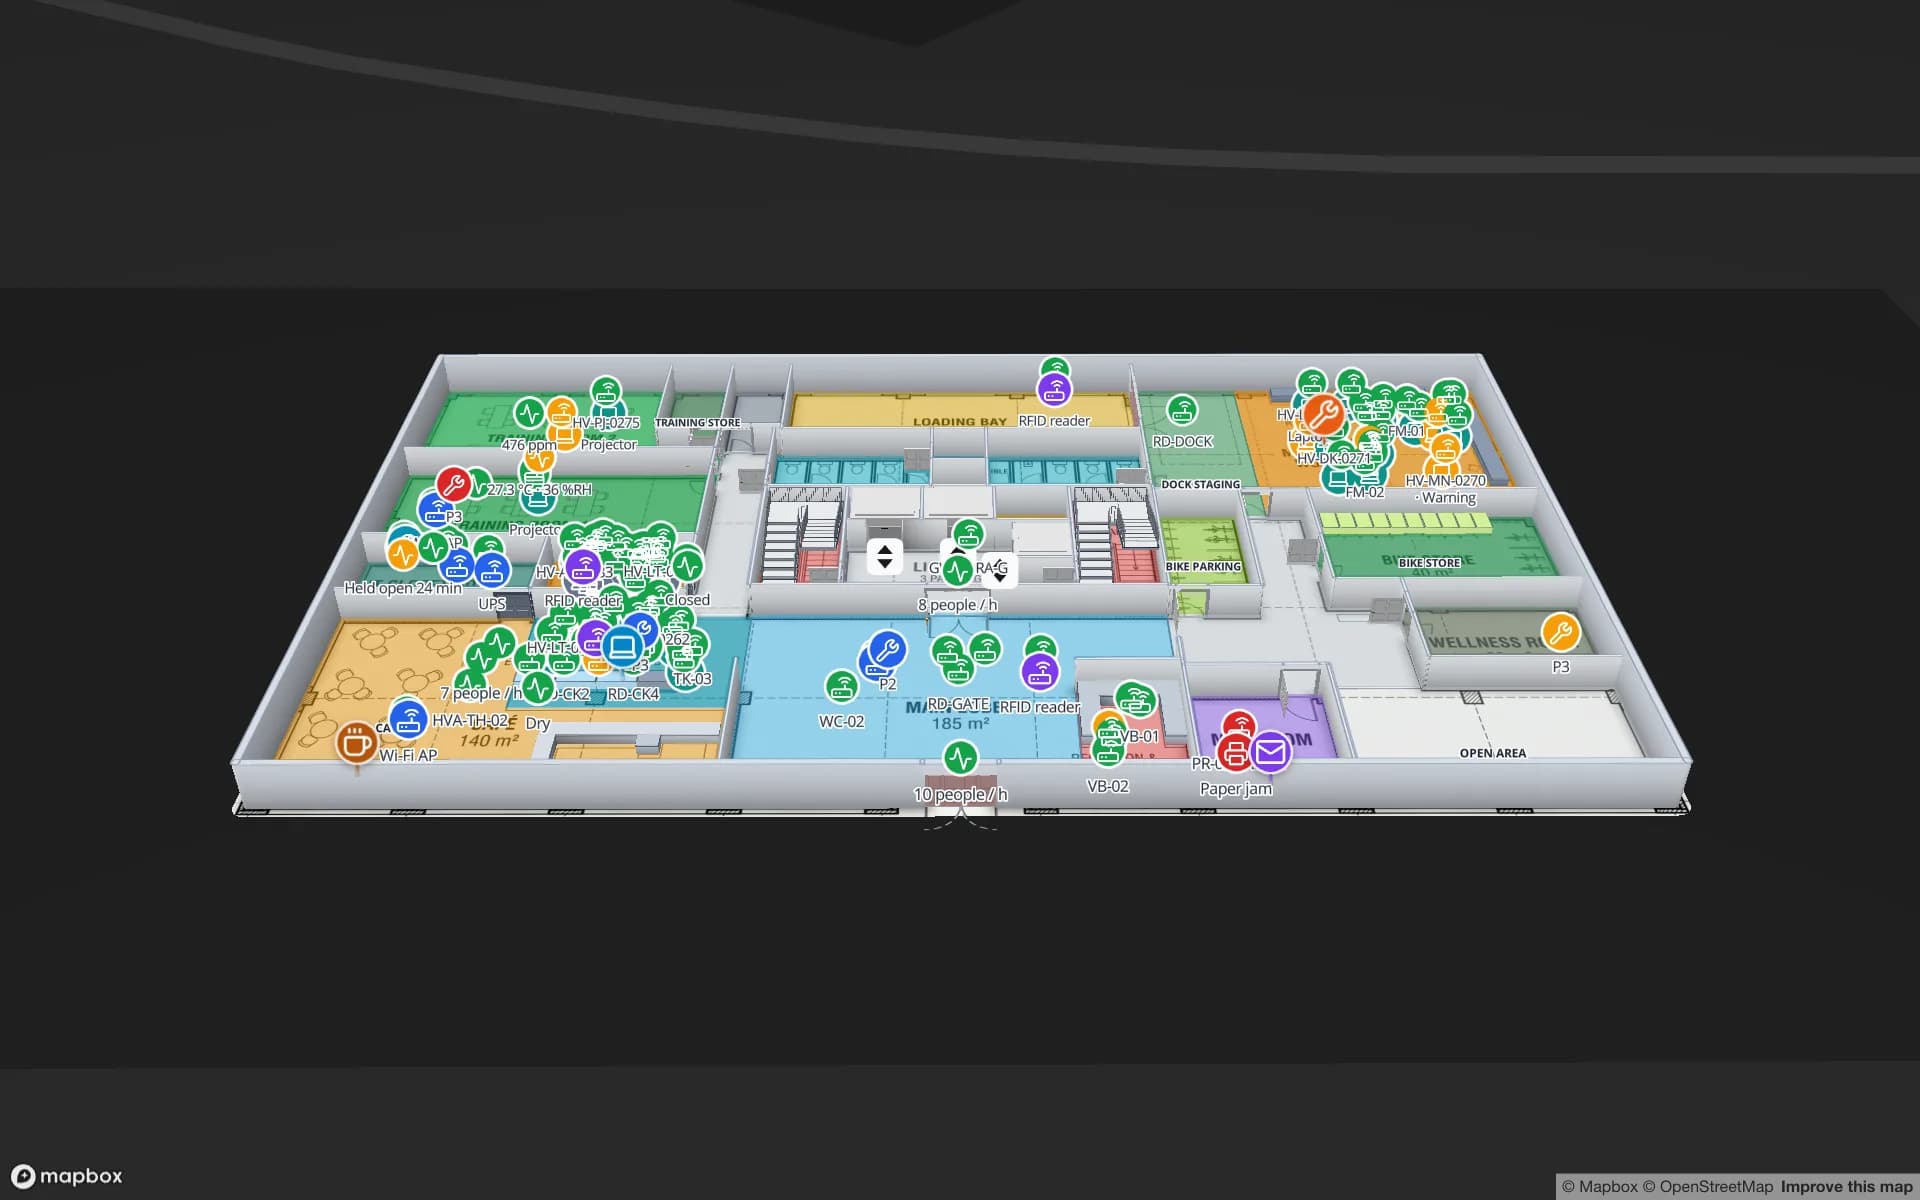
Summit Assembly Plant, a demo plant: assembly lines, workstations, 867 raw-material and finished-goods rack locations, docks and material flow on two floors.
Rack locations in the Summit assembly-plant demo
867
Registered assets across the Asset Management demos
796
How often alert rules are checked, with alerts shown in the app
15 s
Free trial, up to 5 facilities, no card
7 days

Four clusters, six lakh looms

A 2024 report on Surat’s textile clusters put the city’s industry at “six lakh power looms and 450 processing-dyeing and printing units”, spread across Pandesara, Sachin, Kadodara and Palsana; the Gujarat ECO Textile Park is at Palsana. Cloth in these clusters often changes hands several times before it is finished, so a great deal of what a plant owns is not the machinery but the movable things that go with it.

That is where assets go missing. A warp beam goes to a weaver and should come back; a trolley carries rolls of grey fabric through dyeing and finishing; a jigger or stenter needs spares that sit in a store; a returnable core or drum belongs to a supplier. Each is cheap to lose one at a time and expensive to lose by the dozen.
Beams, rolls and trolleys: what to tag first

Start with the things that circulate. Keep the register as a table with tag ID, type, owner, home store and status, and draw the plant so each loom shed, processing line and store is an area. A UHF RFID tag on a trolley or beam, read at the store door and the loom-shed gate, tells the register when it left and came back; BLE tags with gateways named after the areas give a last-seen room for the few items you cannot afford to lose between reads. Steel and wet surfaces affect tags, so test on your own beams first; the post on RFID tags for metal, liquids and apparel lists what to check.

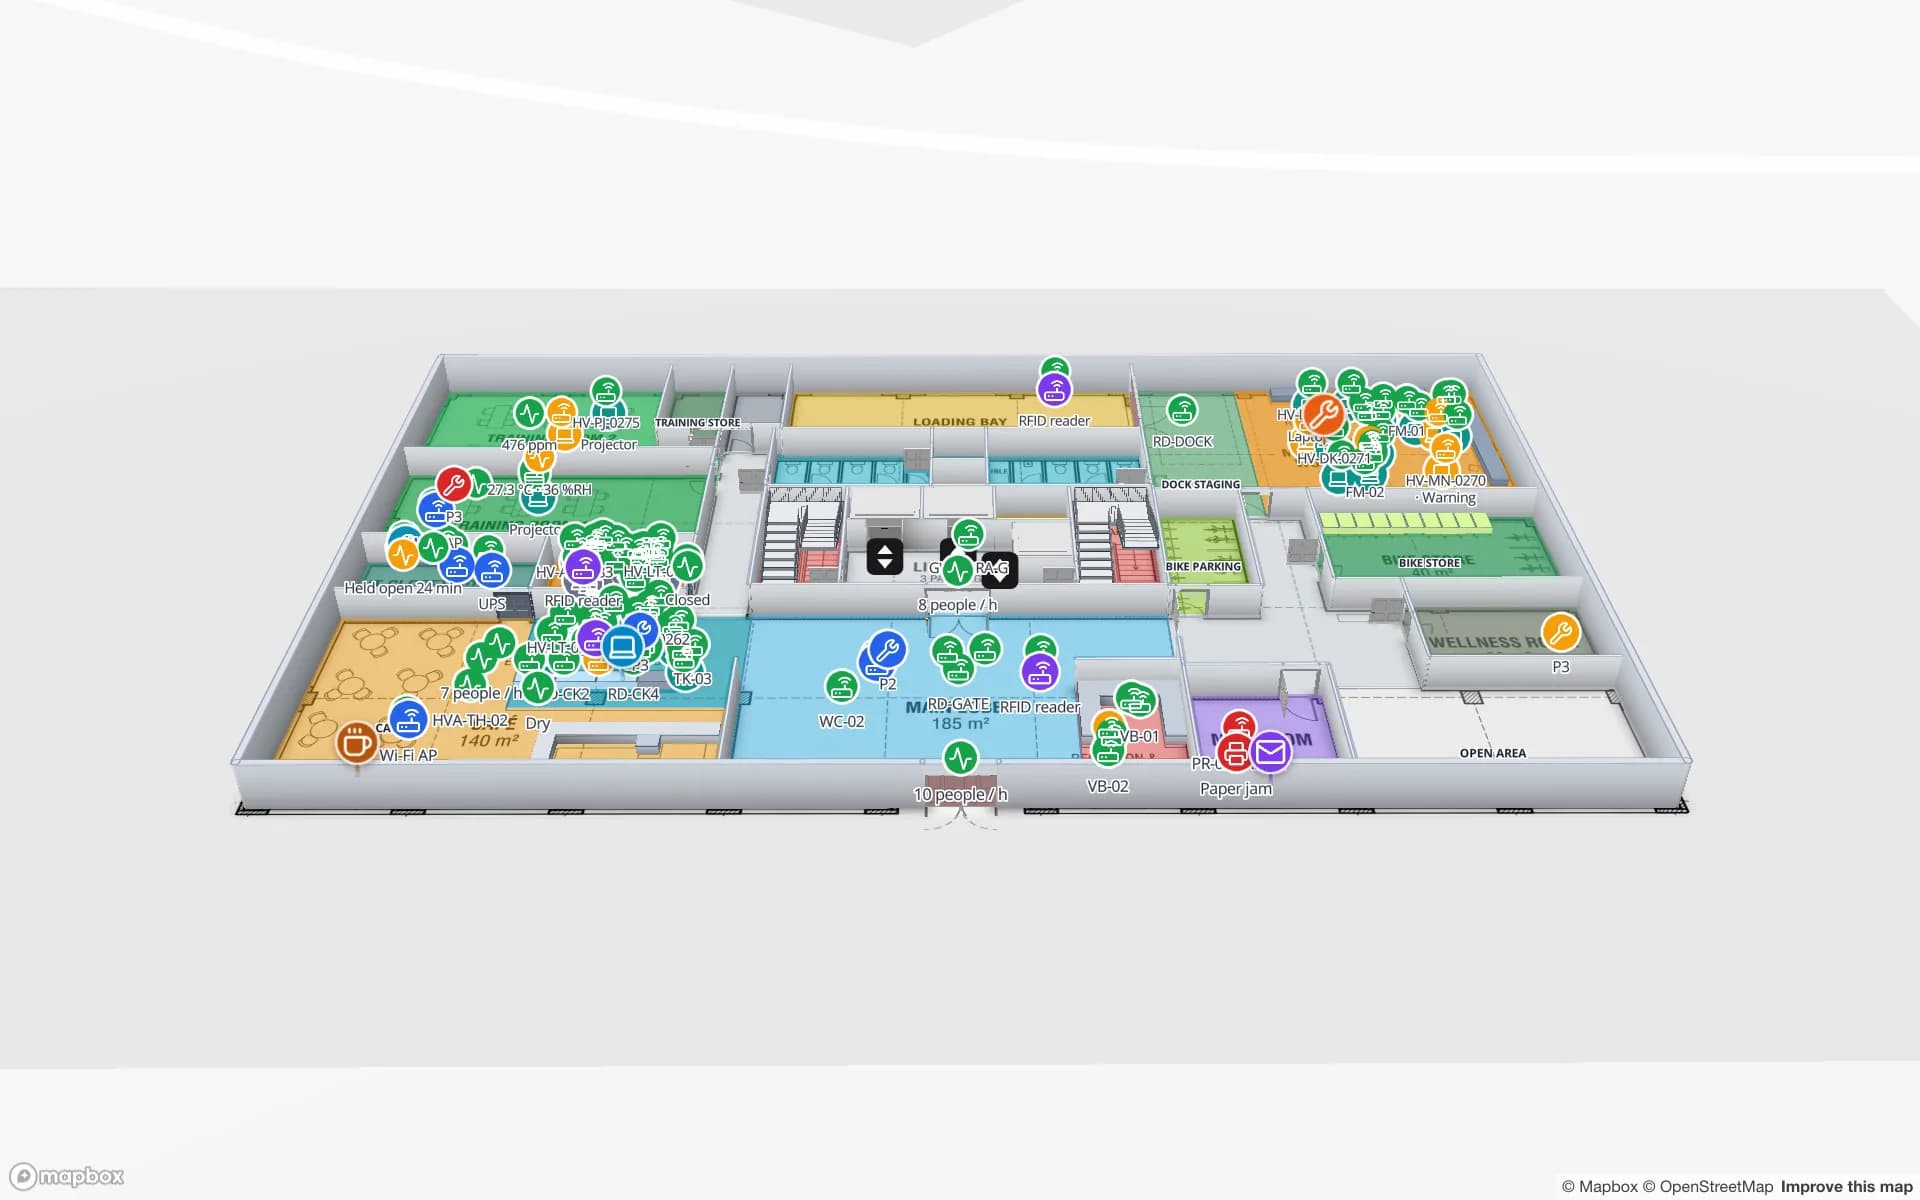
Once the register exists, the map colours items overdue for return, a count rule raises an in-app alert when a line has fewer trolleys than its plan, and the History player replays where one has been. The Summit demo shows lines, workstations and 867 rack locations on one plant map, and the RFID asset management page walks through a register.

Shared utilities: a common boiler, treatment plants and recycled water

Surat’s clusters share infrastructure that most cities leave to each factory. A common boiler that started in Sachin in 2014 was described as the first in India, supplying steam from one plant to many units through overhead pipelines. Sachin has a common effluent treatment plant, and Sachin and Pandesara receive recycled tertiary-treated sewage water for textile use; clusters on the outskirts do not, because of pipeline costs.

Shared utilities are shared assets: pumps, valves, meters, boiler rooms and pipe racks that many units depend on. Spatial Map does not run or control any of them, but it can draw the utility rooms, keep an asset register for the pumps and meters, and colour each by the last reading your own system sends. A rule such as “not updated for N minutes” raises an in-app alert when a meter goes silent. The Ridgeline demo shows plant and environment readings in rooms and cabinets, which is the same idea at a smaller scale.

PM MITRA at Vansi-Borsi: laying out a plant before it is full

The PM MITRA textile park at Vansi-Borsi in Navsari district covers about 1,141 acres and is being developed by the Gujarat Industrial Development Corporation. An official release describes the site as in the vicinity of the Surat textile cluster, and in November 2024 the Union Textile Minister said he would review progress every 15 days. A new park means new buildings, and a new building is the cheapest moment to decide where everything will live.

Import the architect’s plan, align it, and place the machines, stores and utility rooms as areas before anything is installed; draw stairs and lifts if the building has several floors. When equipment arrives it goes into the register with its tag and its planned area, and the map shows what has been installed against what was planned. The guide to turning a CAD floor plan into a 3D map shows the steps.

Services for teams in Surat

Surat teams tend to follow three starting points:

  • Weaving sheds and processing houses start with asset tracking for beams, trolleys and spares, then link it to inventory tracking for finished fabric.
  • Traders and packers start with stock by bin and carton on a bin map, often before any tags are bought.
  • RTLS and UWB matters mainly for very large sheds where vehicles and people must be located continuously; most units will not need it first.
  • If you have no tags, gateways or readers yet, our team can source them on request, quoted per project, with warranty and device support from the manufacturer: see hardware and demo kits on request.
  • Asset back offices, handheld apps and ERP integrations are built as client projects, for example an asset management system; the same page covers POS and booking systems. Run the product as cloud or on-premises.

Also served nearby

The same approach covers Pandesara, Sachin, Kadodara and Palsana, and Navsari to the south. Nothing needs to be installed at any of them: the map opens in a browser.

How Spatial Map does it

Building a Surat asset map

  1. 01

    Load the register

    Upload a CSV or Excel list of beams, trolleys and spares with tag IDs, owners and home stores as a table.

  2. 02

    Map the sheds and stores

    Import the plant plan, align it, and draw loom sheds, processing lines and stores as areas named like your readers and gateways.

  3. 03

    Connect reads and positions

    RFID middleware, BLE gateways and your ERP post rows via the write API or a polled REST endpoint.

  4. 04

    Add overdue and silence rules

    In-app alerts for beams or trolleys overdue at a borrower, lines short of trolleys and tags or meters that stopped reporting.

Where Surat teams track assets

Beams, trolleys and returnable cores

Out and back counted at the store door and shed gate, with overdue items coloured.

Loom and processing machine register

Machines, spares and service due dates by area on the plant plan.

Stores and spares

Equipment check-out, stores and spares by floor, with a count against the register.

Finished-fabric stores

Rack stock by bin for rolls and cartons, with staging lanes before despatch.

See it on real demo facilities

Fictional names, real floor plans, live sensors, RFID, BLE tags and gateways — open any of them in the browser.

All 13 demo facilities

Asset tracking in Surat — questions we get

Most teams do not tag fixed machines at first. Draw each loom shed as an area, keep a register row per machine with its area, and tag the things that move: beams, trolleys, spares and tools. A fixed machine only needs a tag if you want to audit it with a handheld.

That depends on the tag and how it is mounted, so ask the vendor for the operating range and test on your own beams and trolleys. Spatial Map does not make hardware; what it adds is visibility, including an in-app alert when a tag or reader stops reporting.

Only if you receive the readings. If your boiler or treatment system exports meter data, or your integrator can post it, Spatial Map can draw the rooms and colour them by the last reading. It never operates any of that equipment.

Only as far as your own data goes. Keep a status and a date in the register, update it with a handheld scan when an item leaves and returns, and set an overdue alert. A live position inside another unit would need their own readers and map.

Not yet. It is in English, Arabic, Chinese, French, German and Spanish. Machine codes, shed names and report titles can be typed in Gujarati, Devanagari or any other script and appear as written.

No. Spatial Map is sold online and our team works with customers in India remotely, by video call and through the contact form. There are no local resellers or partners.

In US dollars, the same worldwide: a 7-day free trial for up to 5 facilities with no card, then Pro at $60 a month or $600 a year for up to 4 facilities. Hardware, if you ask us to source it, is quoted per project and is not part of the subscription.

Track one pool of beams and trolleys first.

Start the free trial and open the Summit demo, or send us your beam, trolley or spares list and the plan of a shed through the contact form.