Pune · Pimpri-Chinchwad, Chakan, Talegaon and the expressway

Asset tracking in Pune for auto plants, tool rooms and returnable racks

Spatial Map shows where tagged equipment, tooling and returnable containers are on a live 3D map of each building, using the reads and positions your RFID and BLE systems already produce. Asset tracking in Pune is a tool-and-container problem: the engineering and auto plants of Pimpri-Chinchwad, Chakan and Talegaon rely on moulds, dies, gauges and racks that move between machines, stores, suppliers and sister plants, and a missing one stops a line. Each building is its own facility, and all of them can sit in one workspace.

No credit card. Runs in the browser. Pro is $60/month for up to 4 facilities. Book a demo

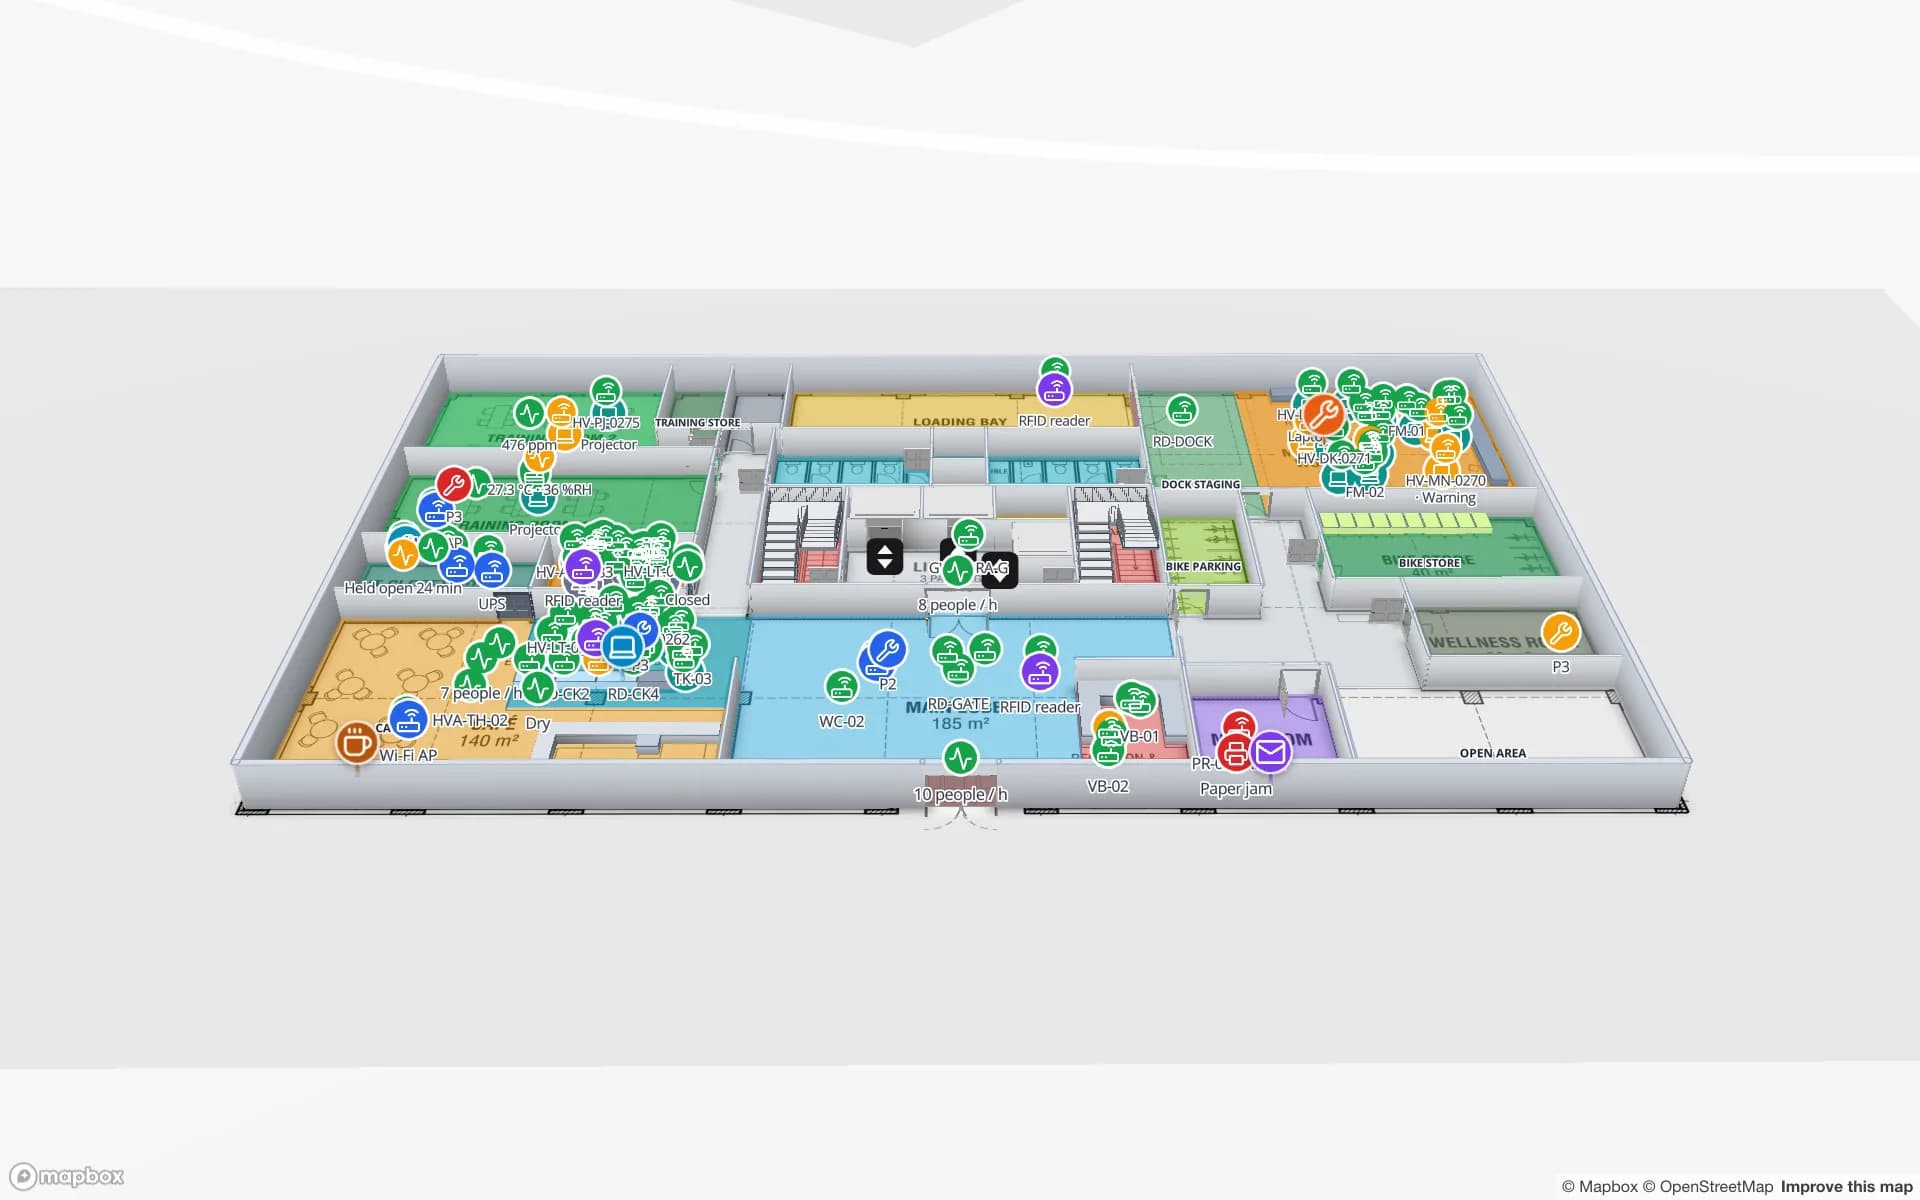
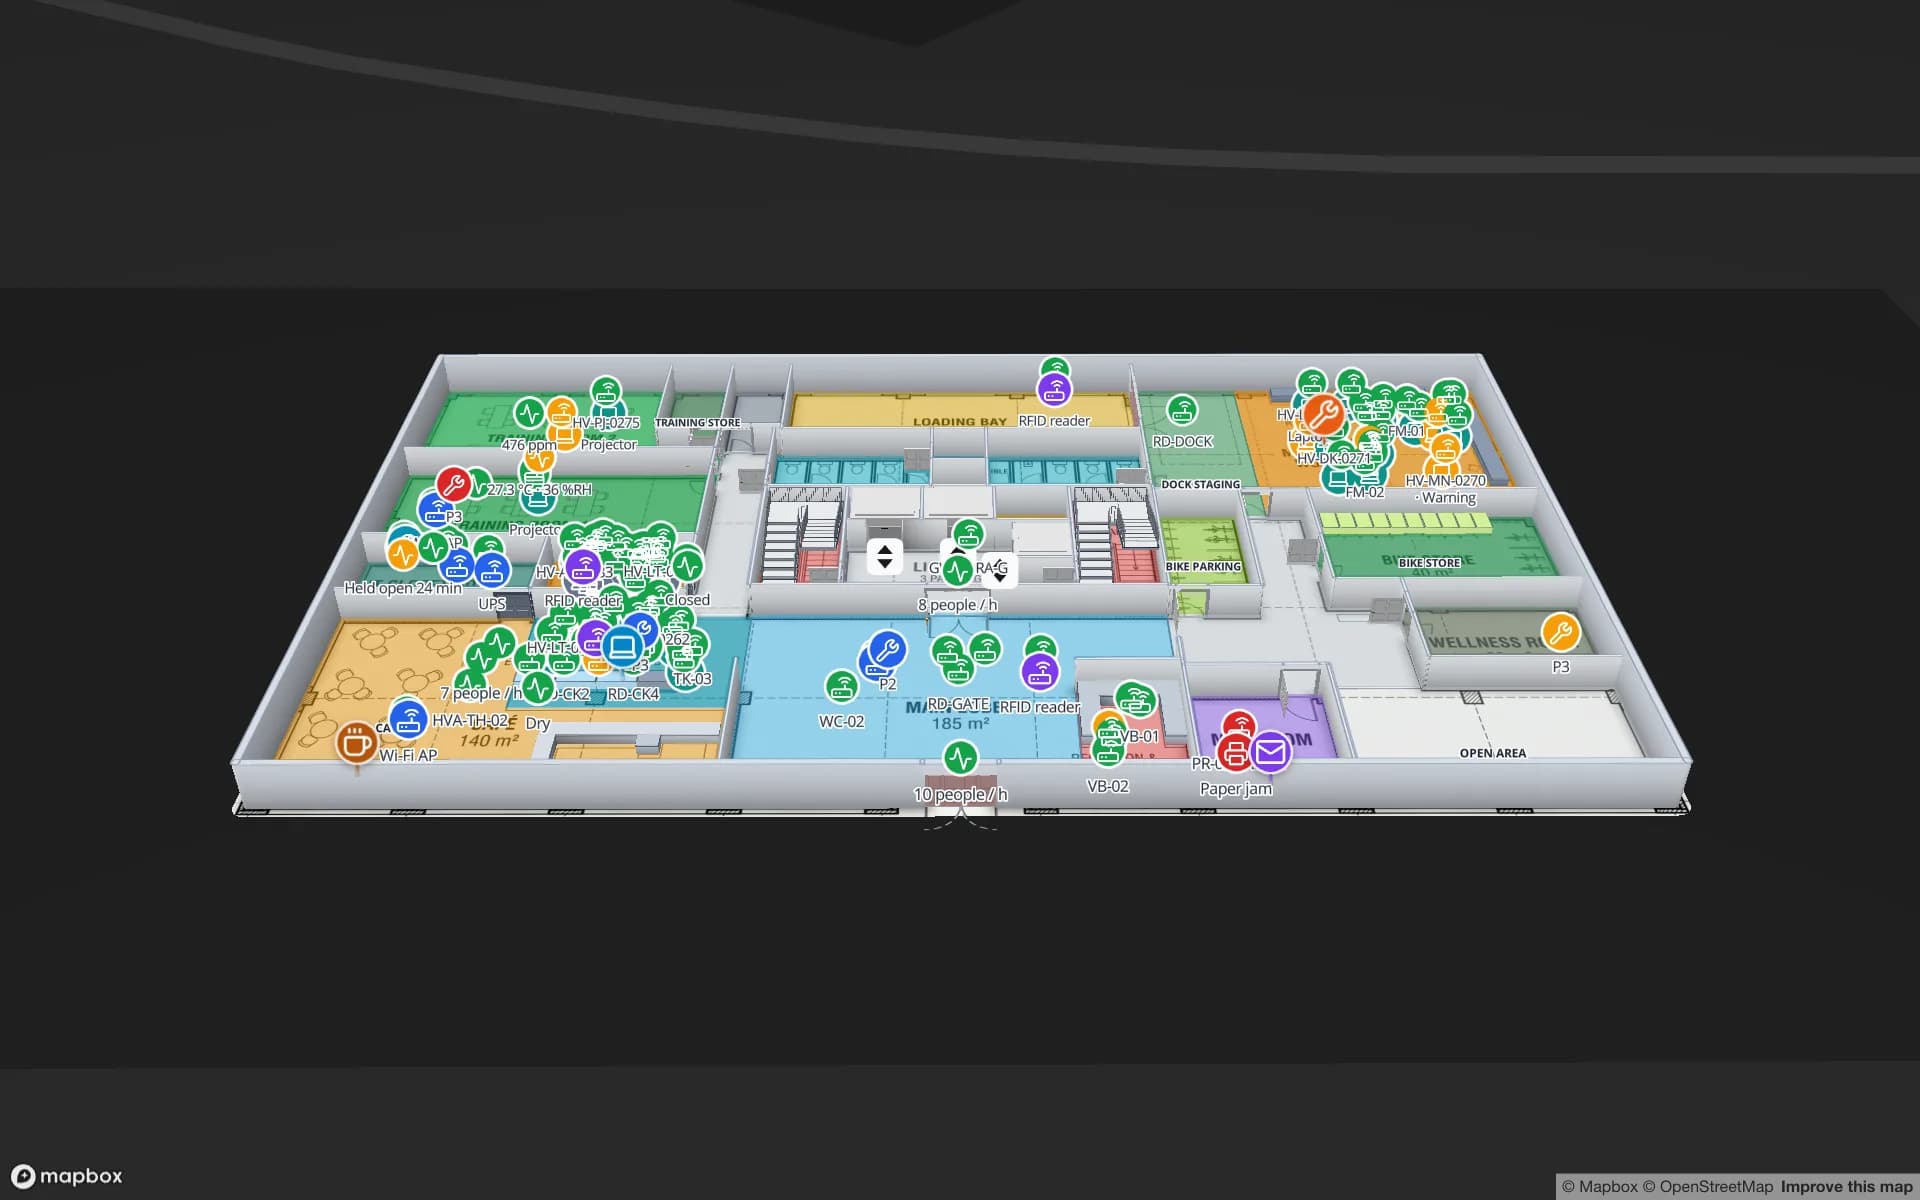
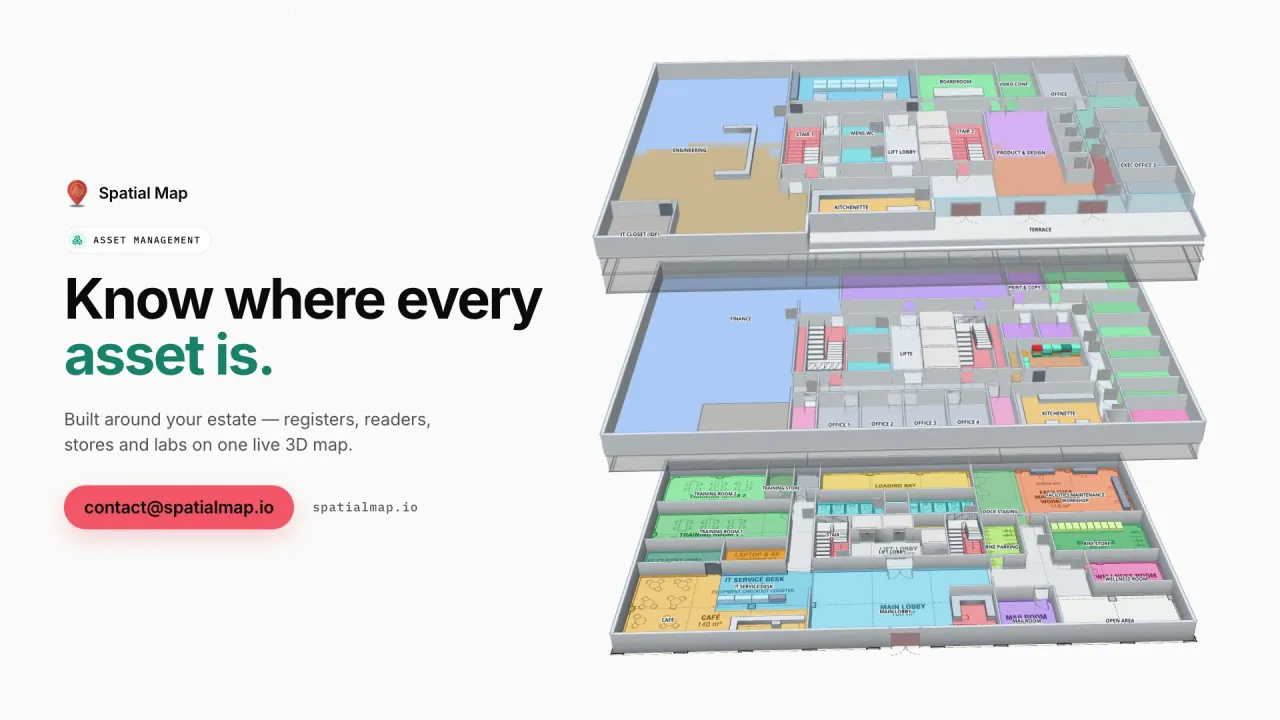
Summit Assembly Plant, a assembly plant demo, in the Spatial Map 3D viewer with live device markers
Summit Assembly Plant
Summit Assembly Plant, a demo plant: assembly lines, workstations, 867 raw-material and finished-goods rack locations, docks and material flow on two floors.
Rack locations in the Summit assembly-plant demo
867
Registered assets across the Asset Management demos
796
How often alert rules are checked, with alerts shown in the app
15 s
Free trial, up to 5 facilities, no card
7 days

Pimpri-Chinchwad to Chakan: an auto belt

Pune’s auto industry has an institution of its own: the Auto Cluster Development and Research Institute in Pimpri-Chinchwad was incorporated in April 2004 and, when it was reported that September, was called the first auto cluster of its kind in India, with auto electronics, CAD/CAM and plastics as its focus areas. Further out, Business Today counted around 750 automobile manufacturing units in the Chakan cluster in 2022, employing close to 250,000 people. MIDC’s own page lists the Pune–Chakan–Talegaon–Satara region at 8,000 acres, with auto and components, engineering, electronics, food processing, logistics and data centres among its sectors.

Plants of that kind share one asset problem. A mould or die is worth more than most of what it makes, it is shared across shifts, and it travels: to the tool room for repair, to a supplier for polishing, back to a machine. The cost of “where is it?” is a stopped press.


Moulds, dies and gauges: the tool crib and the supplier trip

Keep the asset register as a table with tag ID, owner, home store, status and next-due date, and draw the plant so each store, tool room and press line is an area. An RFID tag on the tool, read at the tool-crib door, tells the register when it left and came back; a BLE tag with gateways named after the areas gives a last-seen room for the few items you cannot afford to lose between reads. The map then colours items overdue for return, and the History player replays where one has been. The RFID tool tracking page covers the crib pattern, and the Summit demo shows lines, workstations and 867 rack locations on one plant map.

Where a tool goes to a supplier, Spatial Map stops at your gate. The register can hold a status such as “with supplier” and the date it left, and a handheld scan at the supplier updates it, but the supplier’s own floor is only on a map if they run one. Say that to your team before rollout, so nobody expects a live dot in someone else’s plant.

Returnable racks and the loop between plants

MIDC says it plans to acquire 500 acres at Chakan Phase 5 for an integrated logistics park, and logistics is one of the sectors it lists for the whole region. Whatever is built there, the returnable rack, bin or pallet is the asset that never stops circulating: full to the line, empty back to the supplier, repaired in between. Lose enough of them and a supplier has nothing to ship parts in.

Tag the racks, read them at the gate and at the line-side shelf, and the register shows how many are at each plant, how many are overdue at a supplier and how long a typical loop takes. A count rule raises an in-app alert when a line’s rack count drops below its plan. The Eastport demo shows yard slots, gate lanes and weighbridges for the trailer side of the same loop.

The expressway, and a data-centre park on the way

The Mumbai–Pune Expressway was opened in full in April 2002 and is described as India’s first six-lane access-controlled tolled expressway, built by the Maharashtra State Road Development Corporation; a bypass of the ghat section, the “Missing Link”, was inaugurated in May 2026. It ties Pune’s plants to the Mumbai ports and airports, so a tool or rack is as likely to be in a container at the quay as on the shop floor.

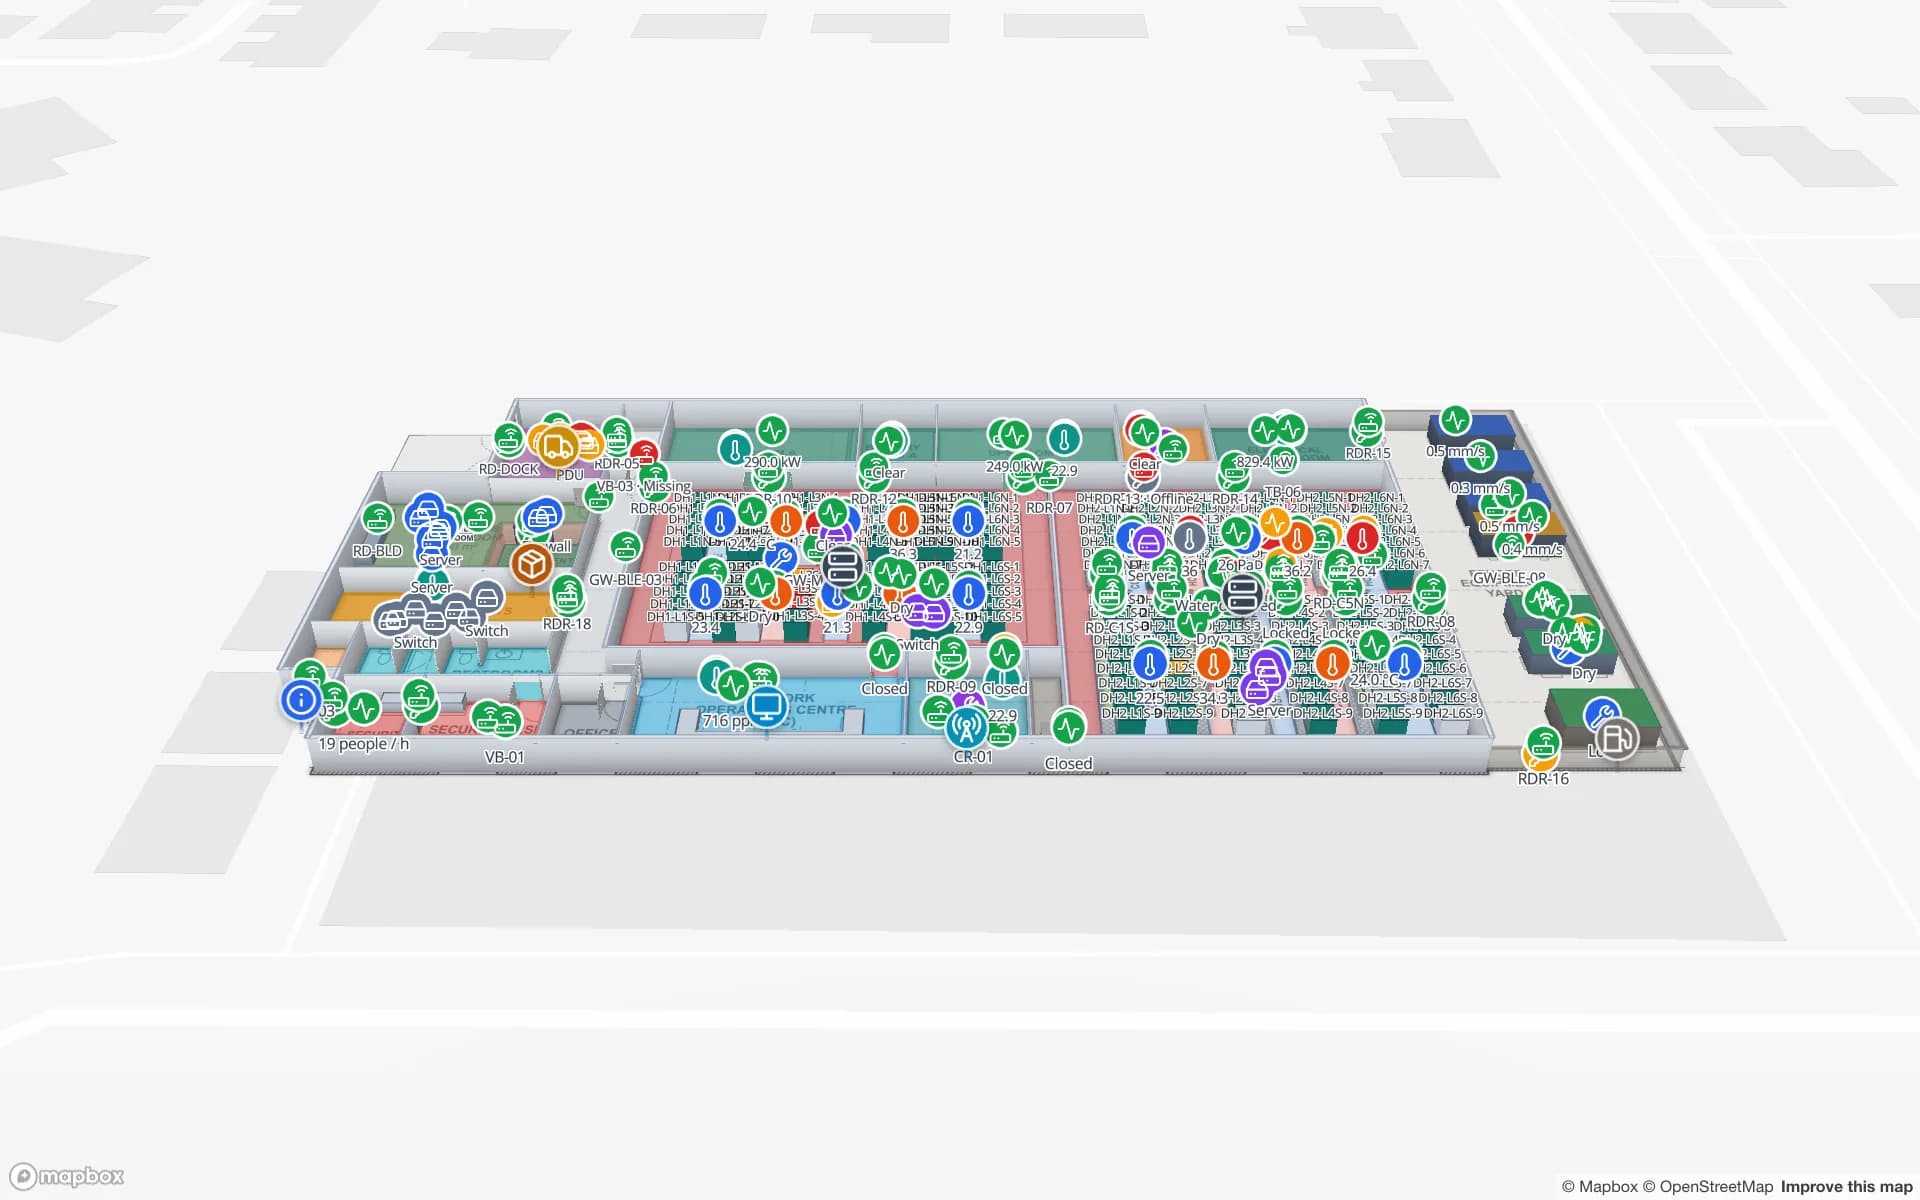
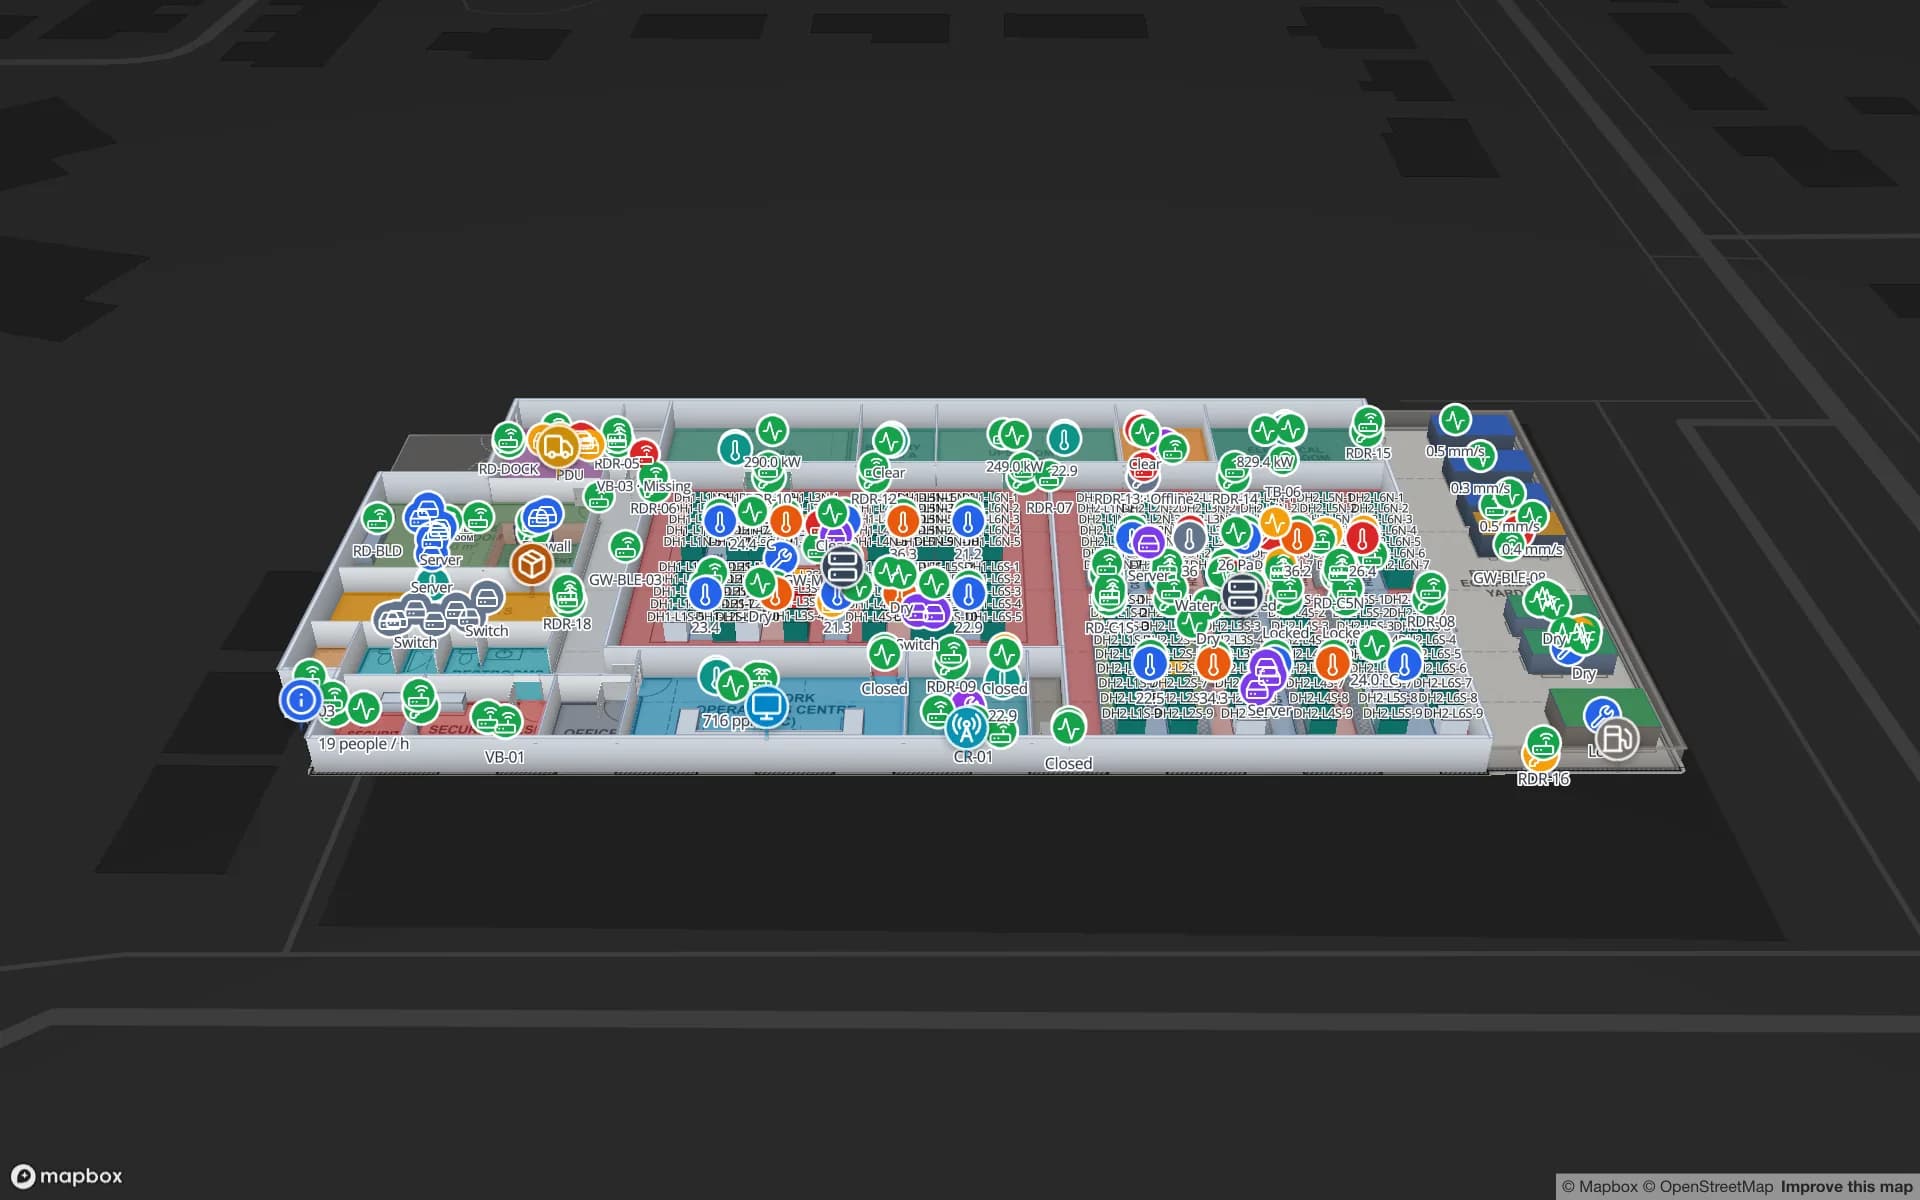
MIDC also lists 250 acres at Talegaon for a data centre park, a very different asset estate: servers, spares and cabling, kept in rooms and cabinets. An RFID handheld walk updates the register room by room, and the Ridgeline demo shows a server hall drawn cabinet by cabinet. The register works the same in any server room.

Services for teams in Pune

Pune teams tend to follow three starting points:

  • Plants start with asset tracking for moulds, dies, gauges and forklifts, then link it to inventory tracking for finished goods.
  • Suppliers and logistics teams start with returnable racks and the trailer yard, often before they buy any new tags.
  • Larger plants that must locate people and vehicles look at RTLS and UWB; a BlueIOT server connects directly and other engines through the write API.
  • Tags, gateways and readers can be sourced on request, quoted per project, with warranty from the manufacturer: see hardware and demo kits on request.
  • Asset back offices, handheld apps and ERP integrations are built as client projects, for example an asset management system. Run the product as cloud or on-premises.

Also served nearby

The same approach covers Bhosari, Akurdi, Ranjangaon, Shikrapur and Hinjewadi, as well as Chakan and Talegaon themselves, and the towns along the expressway towards Lonavala. Nothing needs to be installed at any of them: the map opens in a browser.

How Spatial Map does it

Building a Pune asset map

  1. 01

    Load the asset register

    Upload a CSV or Excel list of tools and racks with tag IDs, owners, home stores and due dates as a table.

  2. 02

    Map the stores and lines

    Import the plant plan, align it, and draw the tool crib, tool room and press lines as areas named like your gateways and readers.

  3. 03

    Connect reads and positions

    RFID middleware, BLE gateways and your ERP post rows via the write API or a polled REST endpoint.

  4. 04

    Add overdue and silence rules

    In-app alerts for tools overdue at a borrower or supplier, lines short of racks and tags that stop reporting.

Where Pune teams track assets

Moulds, dies and gauges

Crib check-out, last-seen store and overdue items coloured on the plant plan.

Returnable racks and trays

Racks counted at the gate and the line, with trailers at the right dock.

Office, lab and engineering equipment

Equipment check-out, stores and spares by floor in a tech or design building.

Server rooms and IT assets

Cabinets, spares and checked-out equipment tied to the room or rack they belong to.

See it on real demo facilities

Fictional names, real floor plans, live sensors, RFID, BLE tags and gateways — open any of them in the browser.

All 13 demo facilities

Asset tracking in Pune — questions we get

Often RFID at the tool-crib door, where an item is checked out and back in, and BLE for the few high-value items you want to find between reads. Spatial Map shows either, as long as your system sends a tag ID with a read point, zone or position. Metal affects tags, so test them on your own tools first.

Only as far as your own data goes. Keep a status and a date in the register, update it with a handheld scan when the tool leaves and returns, and set an overdue alert. A live position in the supplier’s building would need their own readers and their own map.

Each plant is a facility, and the Pro plan covers up to 4 facilities; larger estates are quoted as custom services, and the MIT-licensed open-source edition can be self-hosted with no plan limits. Racks and tools can share one register table across plants, with a facility column.

Yes. Your developers can push rows to a table through the write API (HTTPS, bearer API key, bulk upsert, 60 requests per minute per key), or expose a REST endpoint that Spatial Map polls. If you would rather not build it, our team does integrations as client projects.

No. Spatial Map is sold online and our team works with customers in India remotely, by video call and through the contact form. There are no local resellers or partners.

In US dollars, the same worldwide: a 7-day free trial for up to 5 facilities with no card, then Pro at $60 a month or $600 a year for up to 4 facilities. Hardware, if you ask us to source it, is quoted per project and is not part of the subscription.

Track one shared tool pool first.

Start the free trial and open the Summit demo, or send us your tool or rack list and the plan of a plant through the contact form.