Nuremberg · the Bayernhafen canal port and the exhibition centre

Inventory tracking in Nuremberg, from the canal port to the trade-fair hall

Spatial Map shows stock on a live 3D map of each building, coloured by bin, status or age, from the rows your WMS, scanners and RFID readers already produce. Inventory tracking in Nuremberg has two unusual shapes: stock that sits in warehouses at a port on the Main-Danube Canal, and stock that arrives at an exhibition ground for a week, crates, furniture and empties included, and then leaves again. Both fit a map where each hall, shed and store is its own facility.

No credit card. Runs in the browser. Pro is $60/month for up to 4 facilities. Book a demo

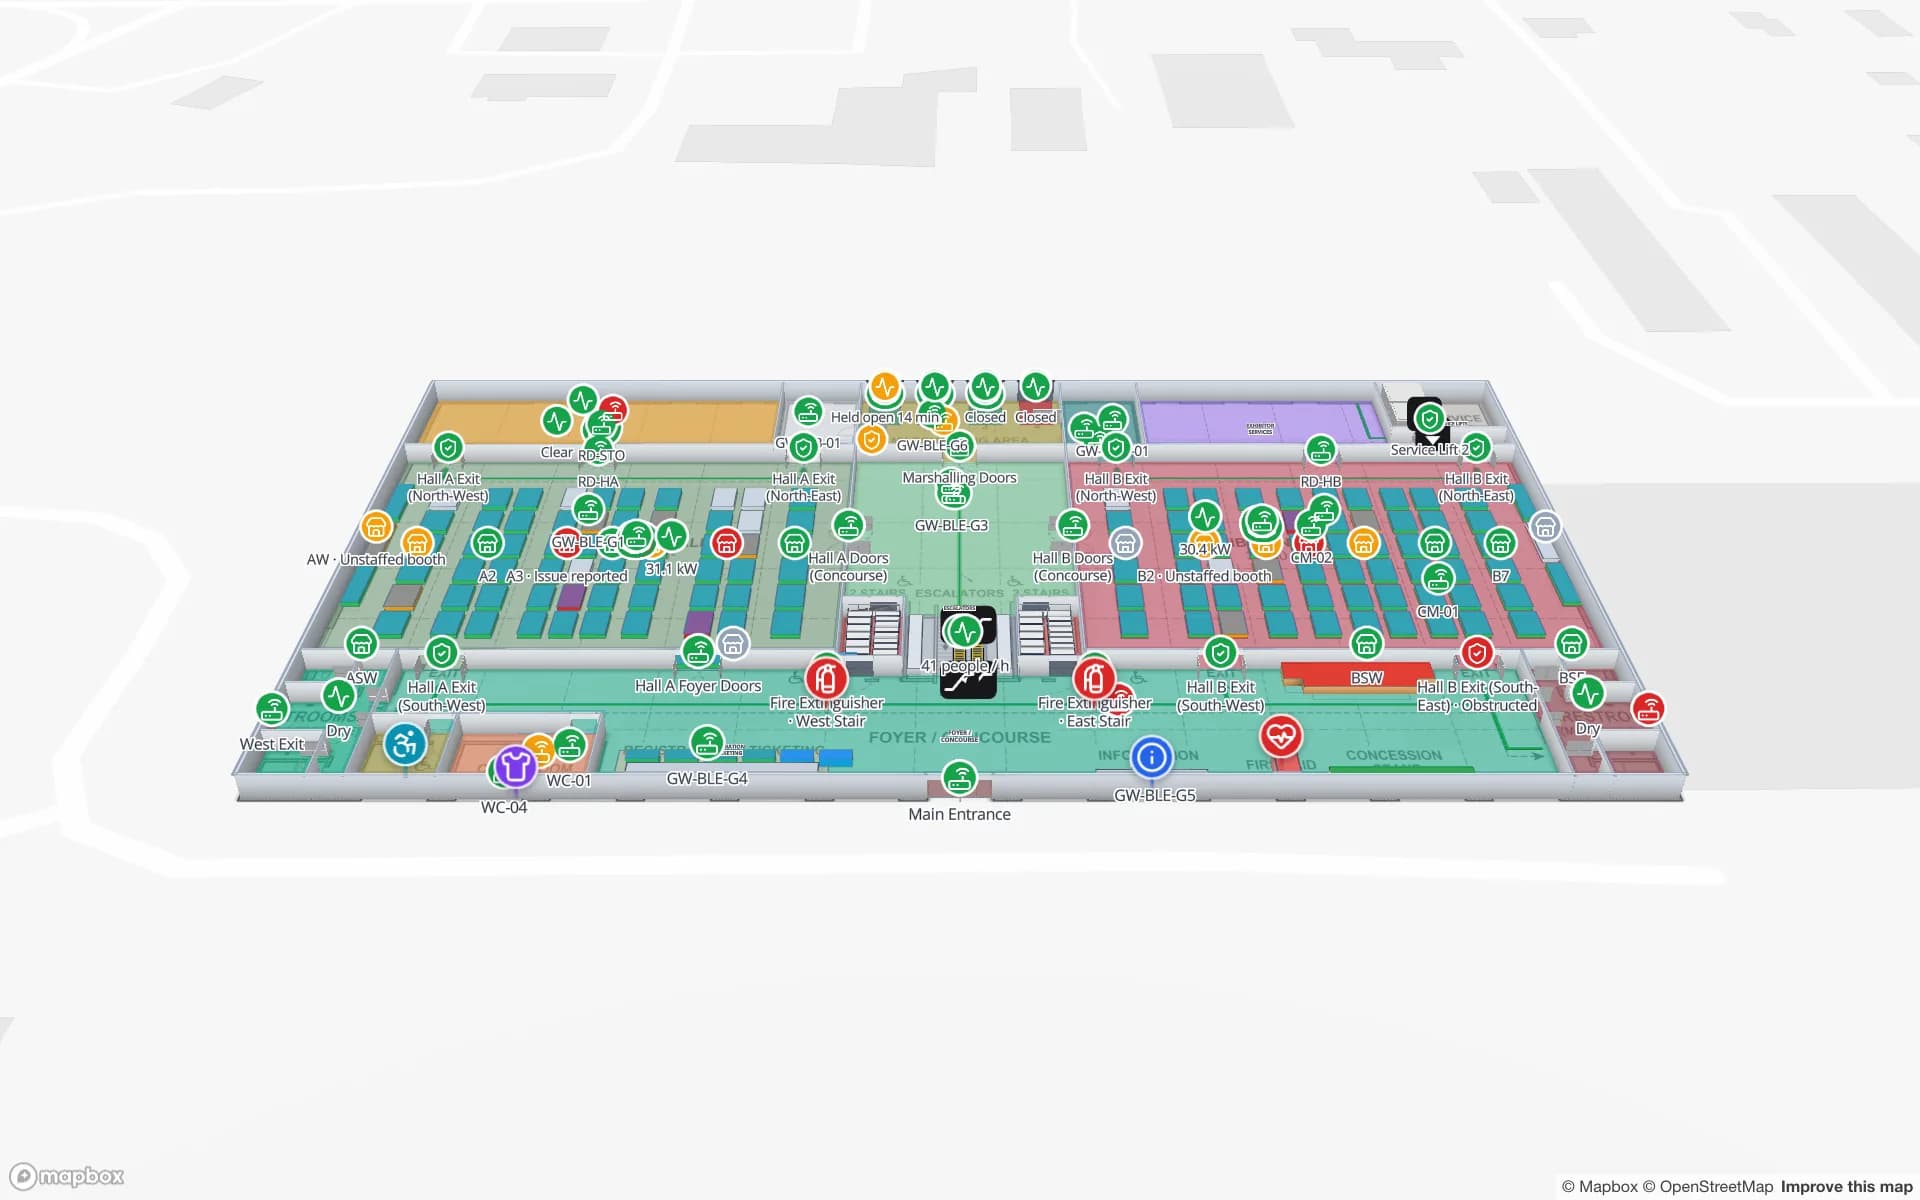
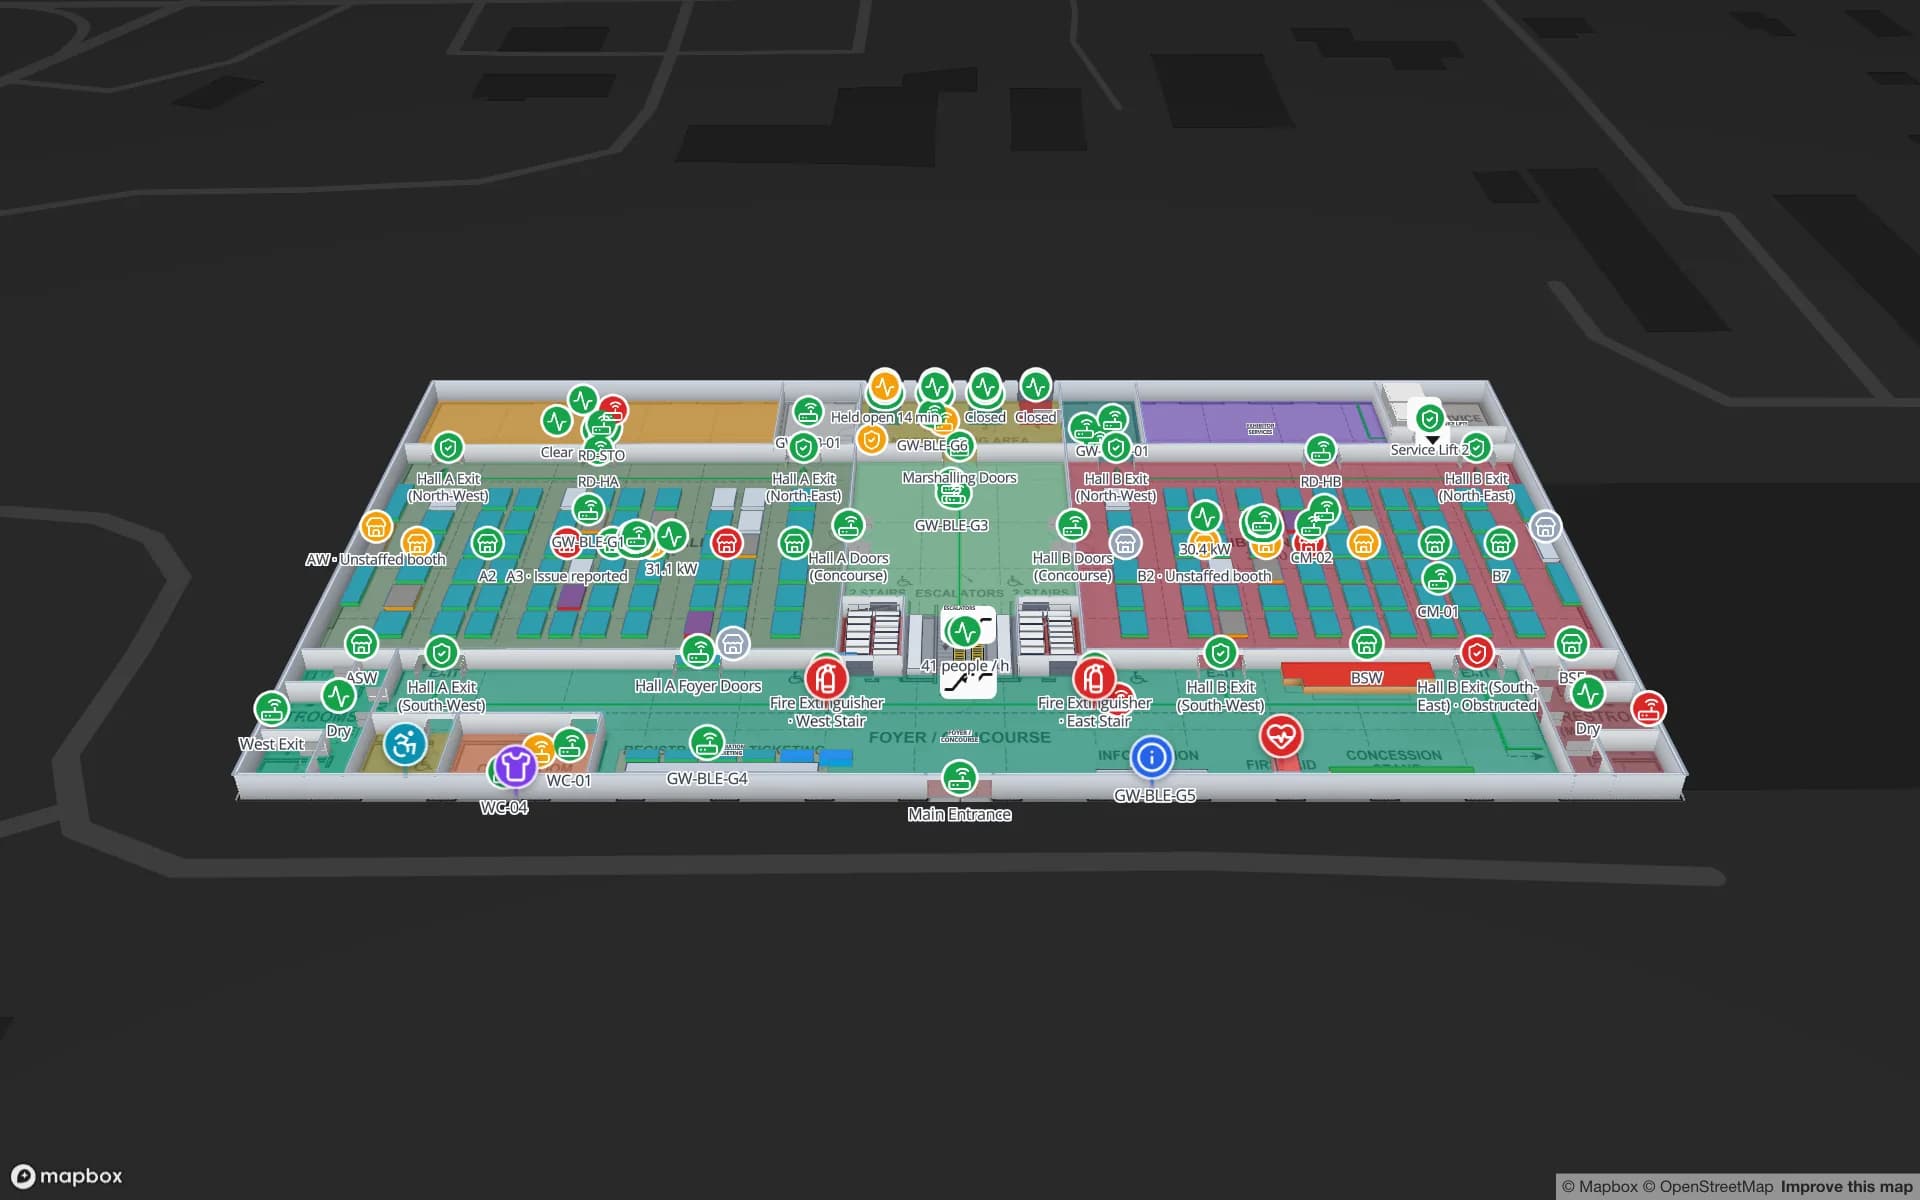
Lakeside Convention Center, a convention center demo, in the Spatial Map 3D viewer with live device markers
Lakeside Convention Center
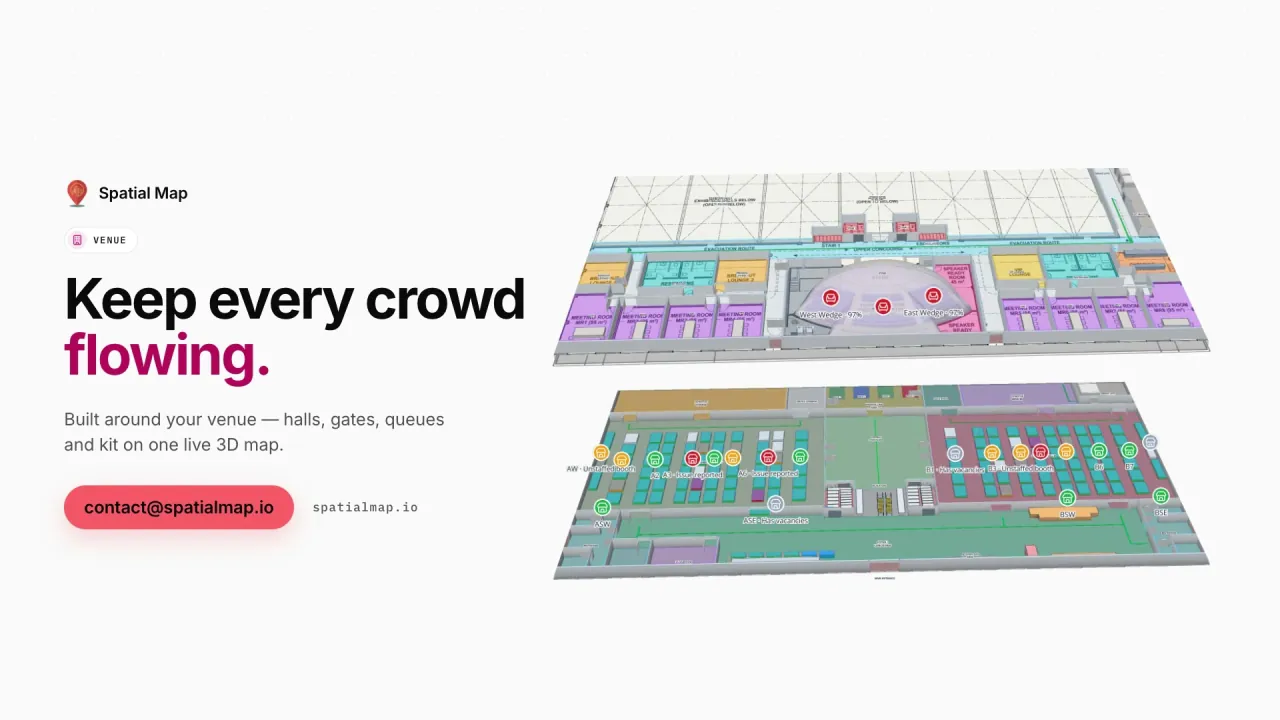
Lakeside Convention Center, a demo venue: exhibition halls with booth blocks, loading docks, marshalling areas and crate tags read from the docks to the booths.
Floors in the Lakeside convention demo
2
Rack locations in the Crestline fulfillment demo
2,204
How often alert rules are checked, with alerts shown in the app
15 s
Free trial, up to 5 facilities, no card
7 days

A canal port with a combined-transport terminal

Bayernhafen Nürnberg opened on 11 August 1972, the year the Main-Danube Canal reached Nuremberg; the port agreement between the city and the Free State of Bavaria dates from 11 November 1966. A combined-transport terminal was added in 2006, and since 1995 the port has been run by a company in which Bayernhafen holds 80 %, the City of Nuremberg 19 % and the City of Roth 1 %. The port’s own group figures, across all its ports rather than Nuremberg alone, are 852 hectares and more than 400 resident companies.

Warehouses in a port estate tend to be multi-client: one building, several owners’ stock, goods arriving by lorry, rail or barge. The inventory question there is not “how much?” but “whose, and where?” Draw each building as a facility, tag rack zones by client, and let a CSV or Excel export of the WMS fill a table of stock by bin; the map colours each bin by status or age. The Crestline demo shows 2,204 rack locations coloured by stock status.


Trade-fair stock: crates, empties and rental furniture

The Nuremberg exhibition centre lists 16 halls with 180,000 m² of gross indoor exhibition space and up to 50,000 m² of open-air space, and says its site concept keeps delivery traffic separate from visitor traffic so that set-up and dismantling run smoothly. For inventory, that separation is the interesting part: exhibitors’ crates arrive, are opened, are stored empty somewhere and are called back at the end, and service contractors keep rental furniture, carpet and signage that moves from hall to hall.

Tag each crate or stack of rental stock with an RFID or barcode label, read it at the dock and again when the empties are collected, and the map shows which halls hold empties, which docks have deliveries waiting and which items have not come back. The Lakeside demo shows exhibition halls with booth blocks, loading docks and marshalling areas, with crate tags read from dock to booth. Spatial Map is a viewer for your own stock; it does not connect to the organiser’s booking or ticketing systems.

Counting without closing the shed

A year-end stocktake in a large warehouse can take a shift or a weekend. With UHF tags on pallets or cartons, a handheld walk-through reads a whole aisle in one pass, and the result posts to a table of what was found; the map then colours bins that are short, over or unread. The post on how RFID stock counting works explains the method, and the stock counting page covers cycle counts. Tags on metal or liquids behave differently, so test in your own aisle first.

The count is a table row like any other, so the History player can replay how a bin changed between counts, and a report can export the differences to PDF or Excel for your own audit. Spatial Map does not write back to your WMS or ERP: the corrected quantity is posted by your own system.

Old buildings, new maps

Upload what exists: PDF, DWG (AutoCAD R2004–R2018, placed as a picture) or an image of the plan, align it at real scale, and let AI Map draft walls, doors, racks and areas for a person to review. AI Map is available on paid plans and the trial, with a monthly limit. For a trade-fair hall, the hall plan itself is usually the right drawing, with rows of stand blocks added as areas.

The interface is available in German as well as English, French, Spanish, Arabic and Chinese, so a hall foreman can work in German while an international group uses English. The German page shows the country page in German.

Services for teams in Nuremberg

Nuremberg teams usually start from one of two places:

Also served nearby

The same page covers Fürth, Erlangen, Schwabach and Roth — the last is a co-owner of the port company — and the logistics sites along the motorways around the metropolitan area. Nothing needs to be installed at any of them: the map opens in a browser.

How Spatial Map does it

From the bin list to a stock map

  1. 01

    Start with one building

    A port warehouse or a hall that handles crates — wherever stock is hardest to find.

  2. 02

    Load stock by bin

    Upload a CSV or Excel export of locations and quantities as a table, then map each bin to a rack in the drawing.

  3. 03

    Add reads where stock moves

    RFID portals and handheld scans post rows through the table write API, or Spatial Map polls a REST endpoint.

  4. 04

    Count and compare

    Colour bins that are short or over after each count, and export the differences as PDF or Excel.

What Nuremberg teams track

Multi-client port warehouses

Stock by bin and client, with a read-only link for each.

Exhibition crates and empties

Crates read at the docks and booths, empties found by hall.

Rental stock and carts

Furniture, carpet and equipment by hall, with what has not come back.

Rail and barge transfers

Pallets staged for the combined-transport terminal and the quay.

See it on real demo facilities

Fictional names, real floor plans, live sensors, RFID, BLE tags and gateways — open any of them in the browser.

All 13 demo facilities

Inventory tracking in Nuremberg — questions we get

Yes. Tag each rack zone or table row with the client it belongs to, style the map by that field, and give each client a read-only share link limited to its own layers and floors. The link can carry an expiry date and a view cap.

Yes, if the crates carry a label or tag and you read it at the dock and when empties are collected. Each read is a row in a table; the map places the crate in the hall or dock that read it, and shows which items were never read back. Spatial Map does not connect to an organiser’s booking or ticketing systems.

It can speed it up, but the quantities of record stay in your own system. Spatial Map shows the result of each count on the map and in reports, and does not write back to a WMS or ERP; your system posts any correction.

The ones you already run. Spatial Map is hardware-agnostic: your middleware or WMS turns reads into rows that arrive through the write API, a polled REST endpoint or file uploads. The only built-in device driver is for a BlueIOT RTLS server.

Yes. The interface is available in German alongside English, French, Spanish, Arabic and Chinese, and each user chooses their own. Names you type, such as bins and halls, stay as written.

No. Spatial Map is sold online and our team works with customers in Germany remotely, by video call and through the contact form. There are no local resellers or partners.

In US dollars, the same worldwide: a 7-day free trial for up to 5 facilities with no card, then Pro at $60 a month or $600 a year for up to 4 facilities. RFID hardware, if you ask us to source it, is quoted per project and is not part of the subscription.

Put one Nuremberg warehouse on a stock map.

Start the free trial and open the Crestline demo, or send us a bin list and a plan of one building through the contact form.