Shenzhen · Huaqiangbei, Qianhai–Shekou and Bao’an cargo

Asset tracking in Shenzhen, for the things that are not the product

Spatial Map shows where your equipment, tools, carriers and returnable packaging are, on a live 3D map of the building they sit in. Asset tracking in Shenzhen is mostly about what surrounds the product: the test rigs, reels, trays, fixtures, sample kits and reusable crates that move between a factory floor, a prototype lab, a store and a loading dock, and that cost real money when one goes missing. Each tag read or table row becomes a marker in place, with its history and a status colour.

No credit card. Runs in the browser. Pro is $60/month for up to 4 facilities. Book a demo

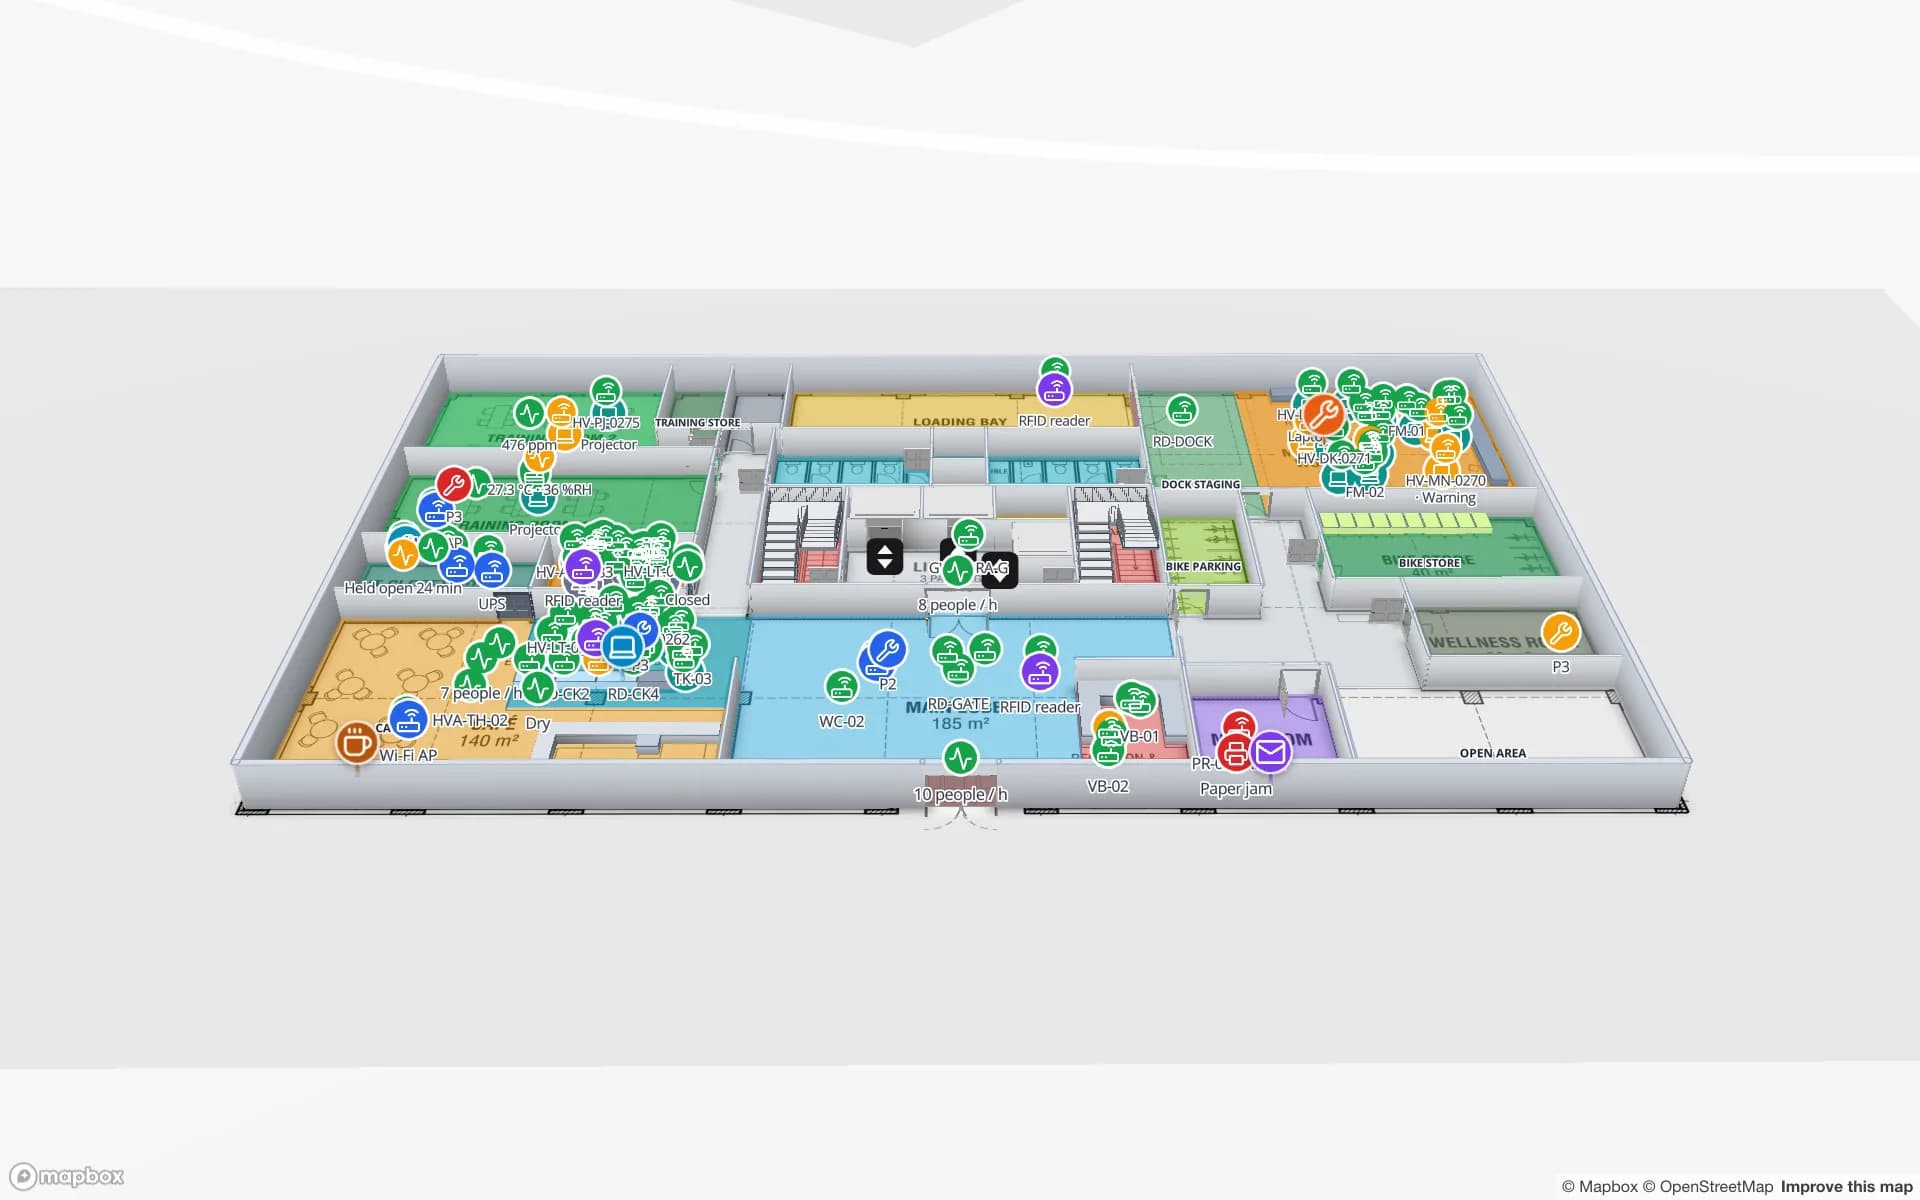
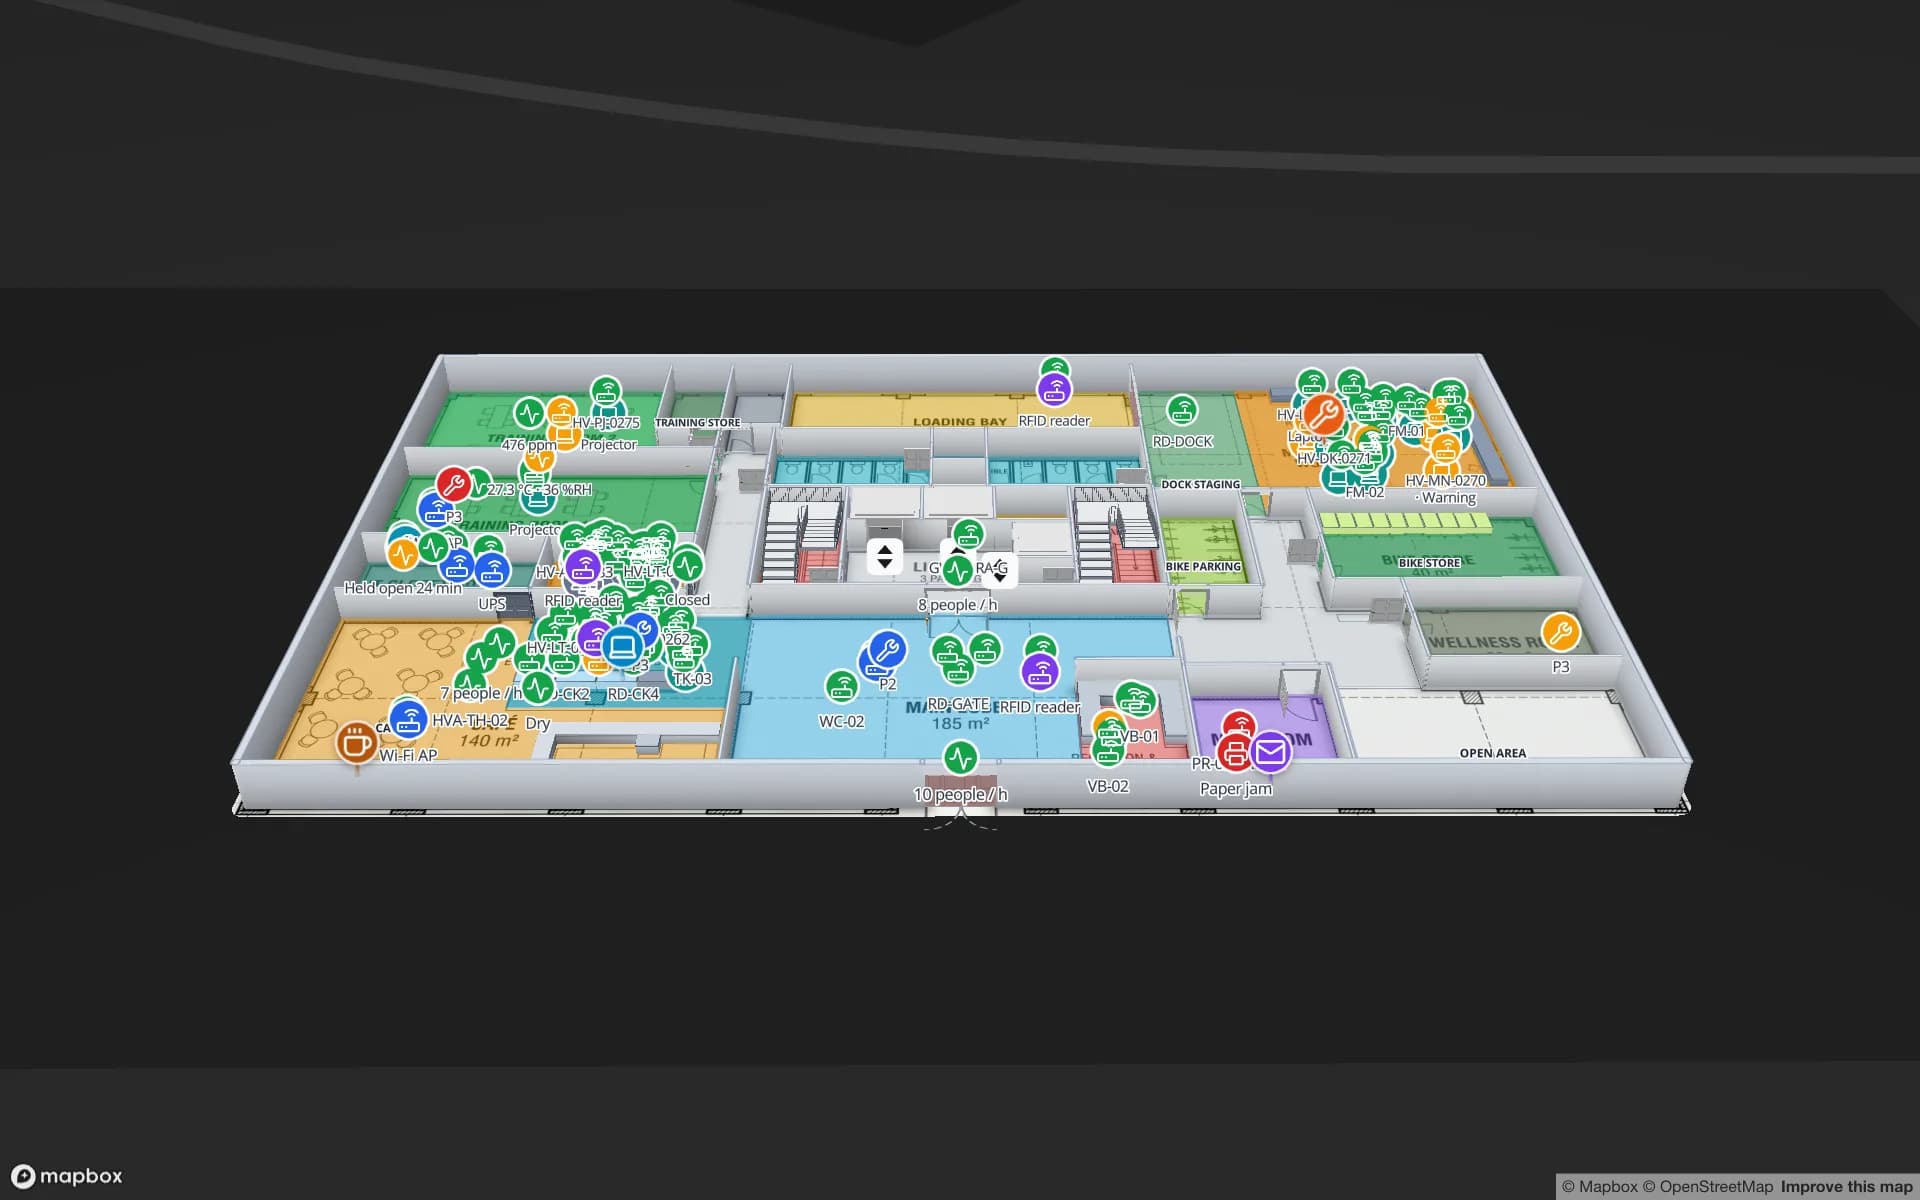
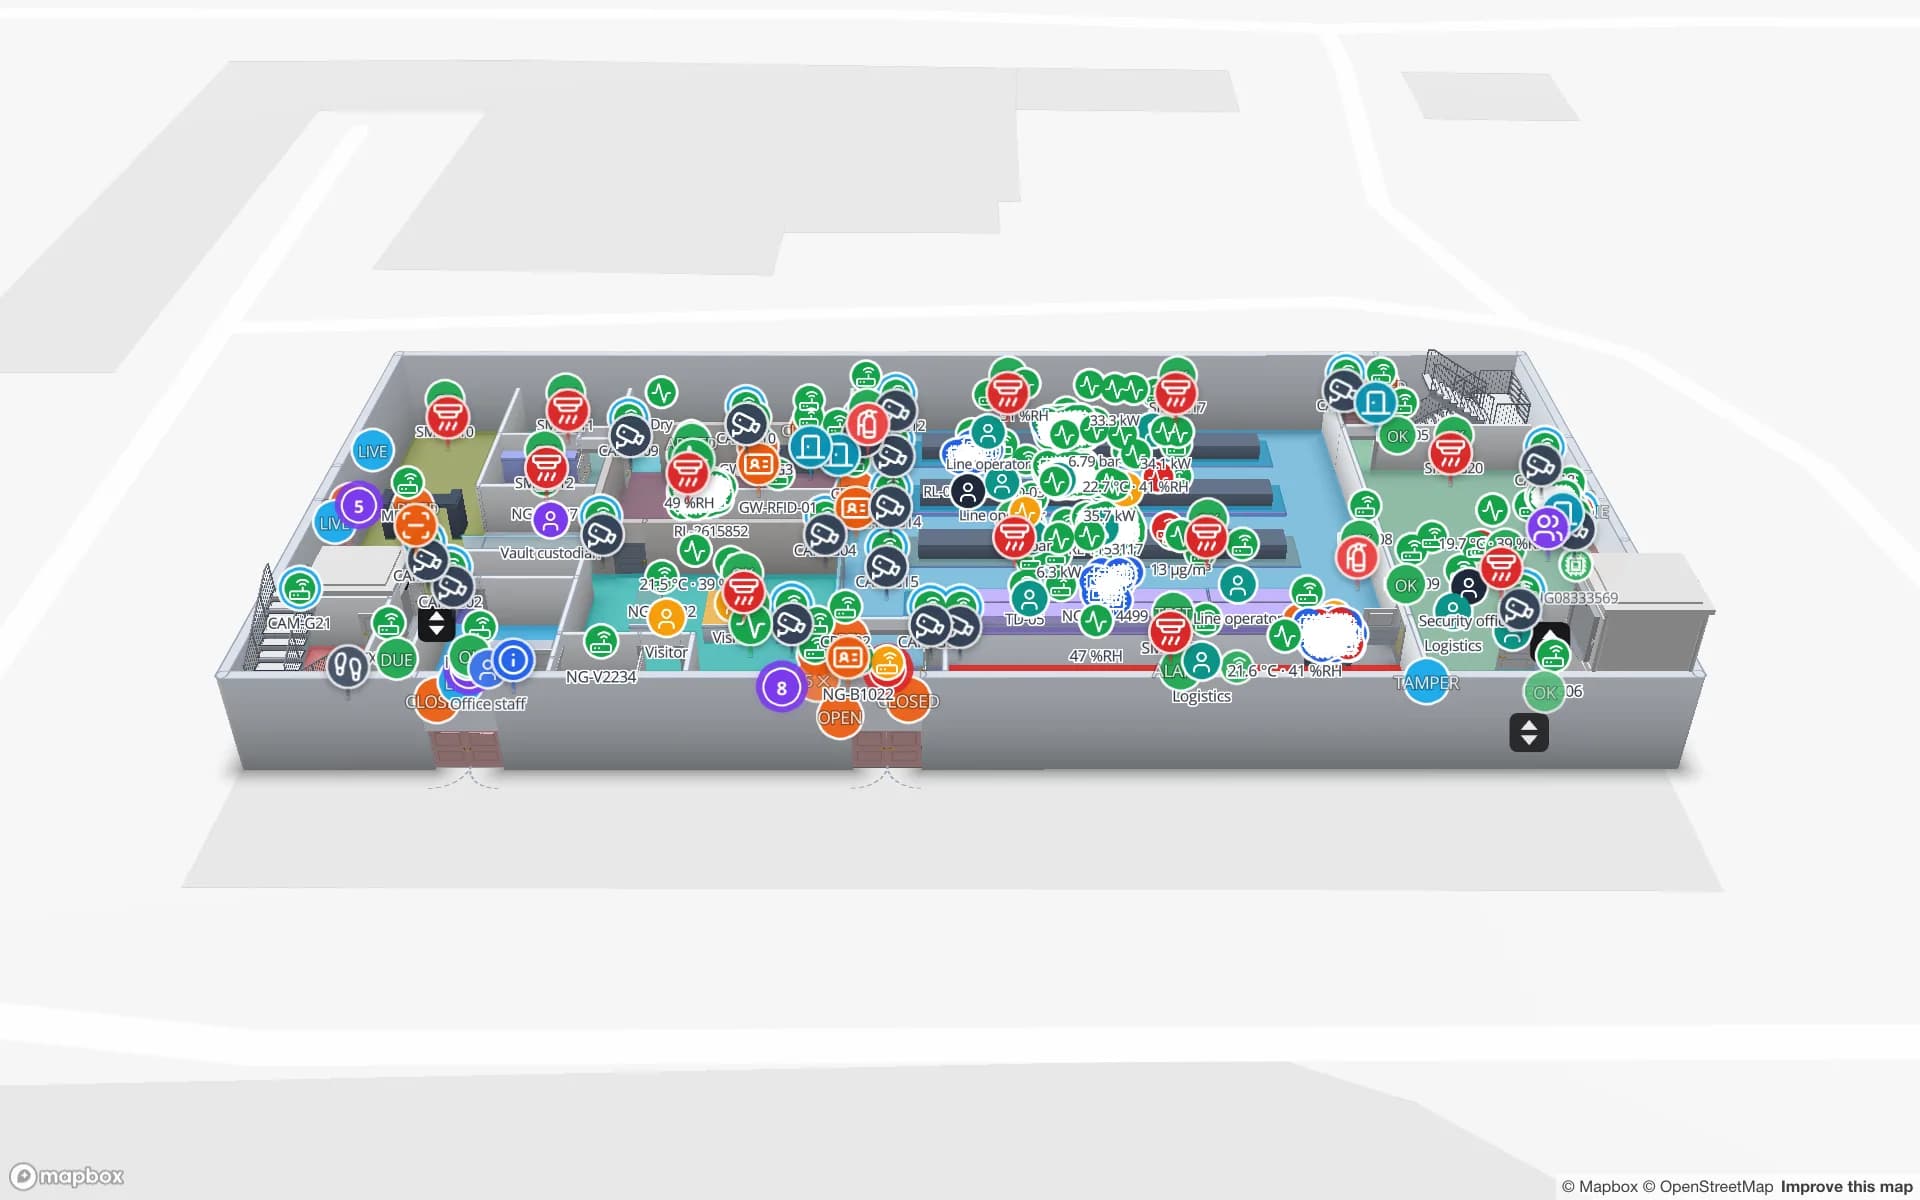
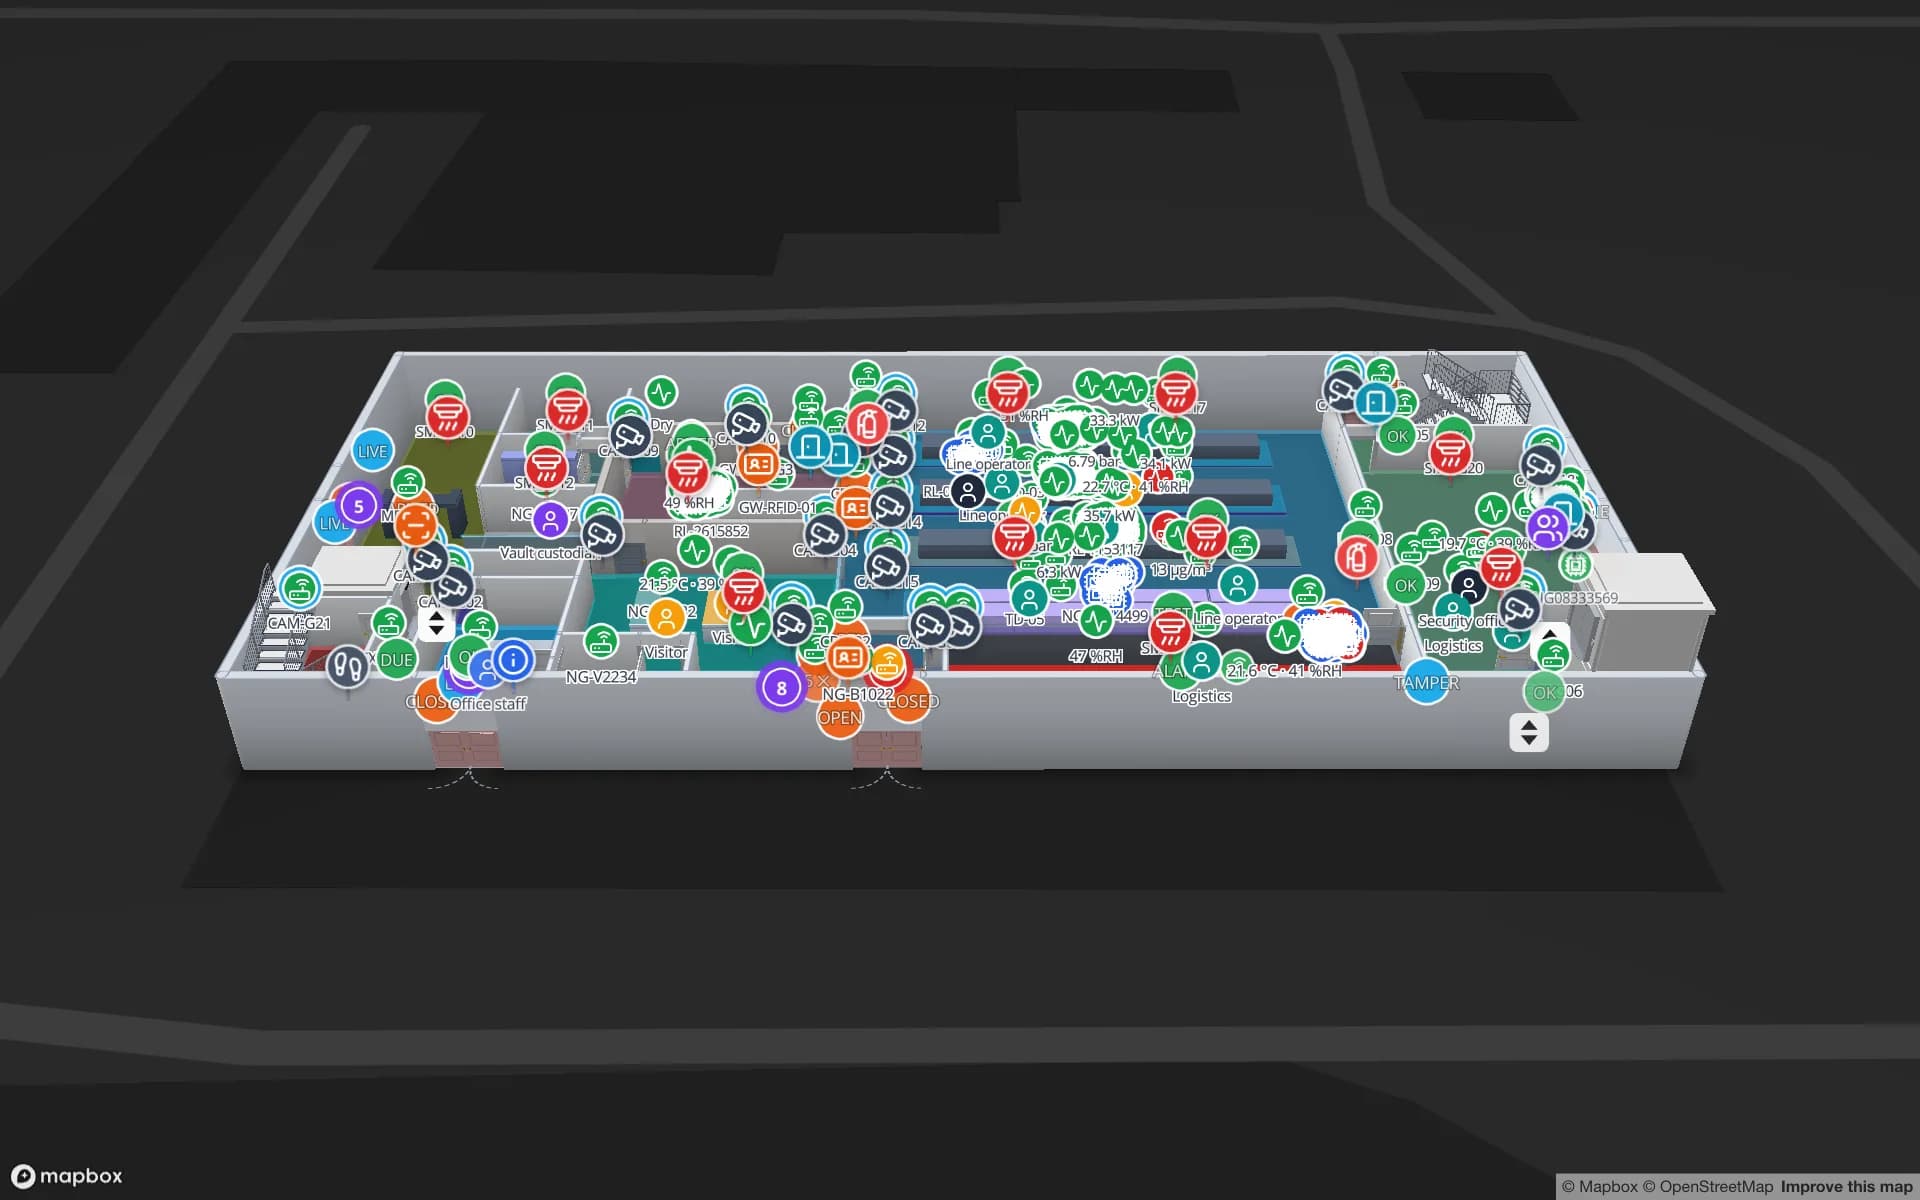
Northgate Electronics — Assembly & Secure Store, a electronics assembly & secure store demo, in the Spatial Map 3D viewer with live device markers
Northgate Electronics — Assembly & Secure Store
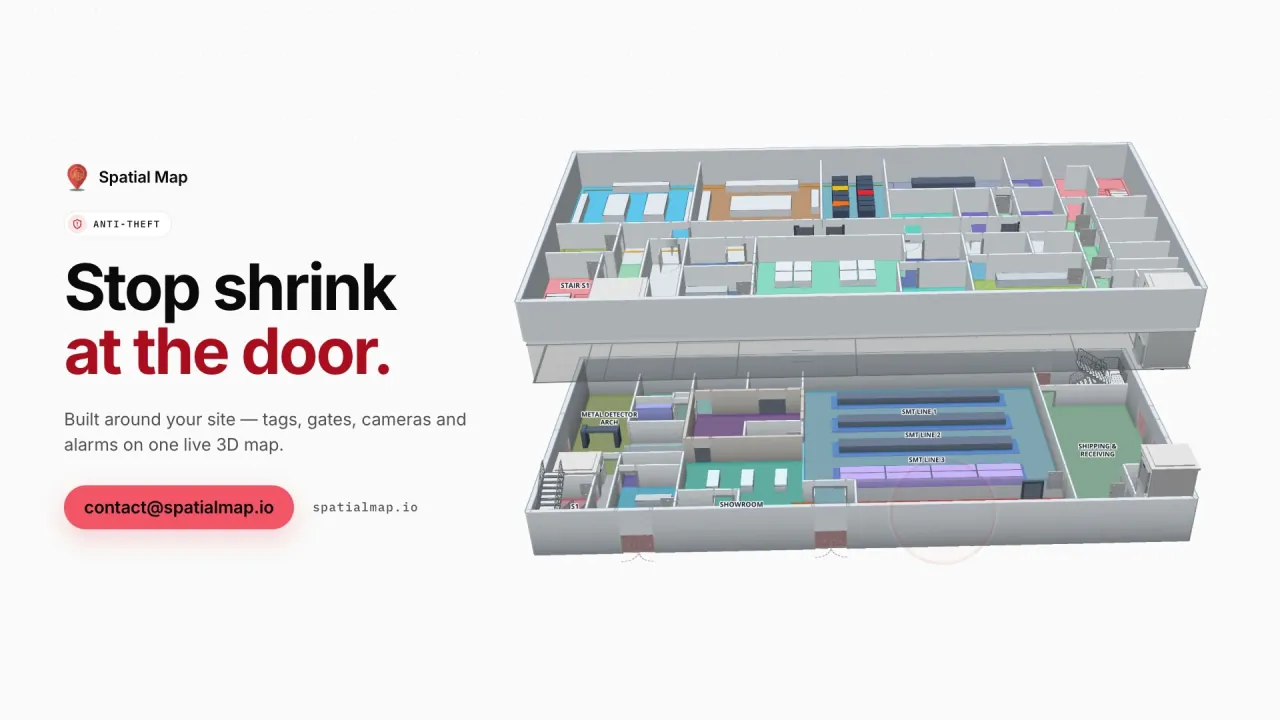
Northgate Electronics, a demo plant: an assembly floor and a secure store on two floors, with security zones, cages and tagged stock.
The year Shenzhen was made a special economic zone
1980
Qianhai–Shekou area of the Guangdong free trade zone
28.2 km²
Floors in the Northgate electronics demo
2
Free trial, up to 5 facilities, no credit card
7 days

From a 1980 zone to the components market

Shenzhen’s special economic zone was approved on 26 August 1980, and the city’s electronics trade grew up inside it. According to the Shenzhen government, the first electronic-components market of its kind in China opened in Huaqiangbei in 1988, and the Huaqiang Electronics World market followed in 1998; CGTN calls Huaqiangbei one of the world’s largest electronics markets. CGTN also reports that Shenzhen has had China’s largest export scale since 1993.

Behind the markets stand factories, assembly lines and sample rooms whose most valuable and most mobile things are not finished goods. They are reels of components, test equipment, jigs, tooling, engineering samples and the trays and carriers that hold work in progress. An asset register on a map answers “where is it, who has it, since when” without a phone call: tag the item, post a row each time it is read or checked out, and the marker moves. The Northgate demo follows tagged stock through a secure store and the assembly floor, and the Summit Assembly demo follows work-in-progress carriers between stations with 867 rack locations.


Qianhai–Shekou, the port areas and returnable packaging

The Guangdong pilot free trade zone was approved in December 2014 and the Qianhai–Shekou area inaugurated in April 2015. Shenzhen’s Qianhai authority gives the area as 28.2 square kilometres: a 15 square kilometre Qianhai block that includes a 3.71 square kilometre free trade port zone, and a 13.2 square kilometre Shekou block. Port areas that sources name for the city include Yantian, Shekou and Dachan Bay, and cargo moves between them and the factories on trucks all day.

Anything that makes that trip and comes back is an asset: pallets, roll cages, reusable crates and reels. Give each one an RFID tag or a barcode label, read it at the factory door and the port or zone gate, and the map shows how many are out, where they sit and how long they have been away. A table of loaned crates with a “not updated for N minutes” alert rule shows what has gone quiet, and alerts appear in the app. The post on real-time indoor asset tracking explains the building blocks, and RFID tags for metal, liquids and apparel says what to test first.

Bao’an airport: small, valuable and late

Shenzhen Bao’an handled about 2.05 million tonnes of cargo and mail in 2025, a record, and its international and regional cargo passed 1 million tonnes. Work on Terminal 2 and a Northern Cargo Area began on 23 August 2025. Air freight from a city of device makers is typically light, small and expensive: modules, boards, finished units and samples that sit in cages and cages-within-cages while paperwork catches up.

A cargo shed or a forwarder’s cage store can map each cage, shelf and handover point, and the Northgate demo shows how choke-point counters, access points and a shrink report work together on a secure store. Spatial Map does not read customs or airline systems and does not check anyone’s identity; it shows what your own tags, doors and records say about where an item is. Flights run on the clock, so the History player is as useful as the live view: it replays where a consignment was an hour before the cut-off.

Prototype labs and shared tools

Product teams in a city this dense keep engineering samples, development boards and instruments in labs where many people borrow from a shared cupboard. The usual failure is not theft but forgetfulness: someone has the scope, nobody knows who. Put checkout on the map. Tag instruments and sample kits, record who took them and from which room, colour overdue items, and let a Viewer in another team look without editing anything.

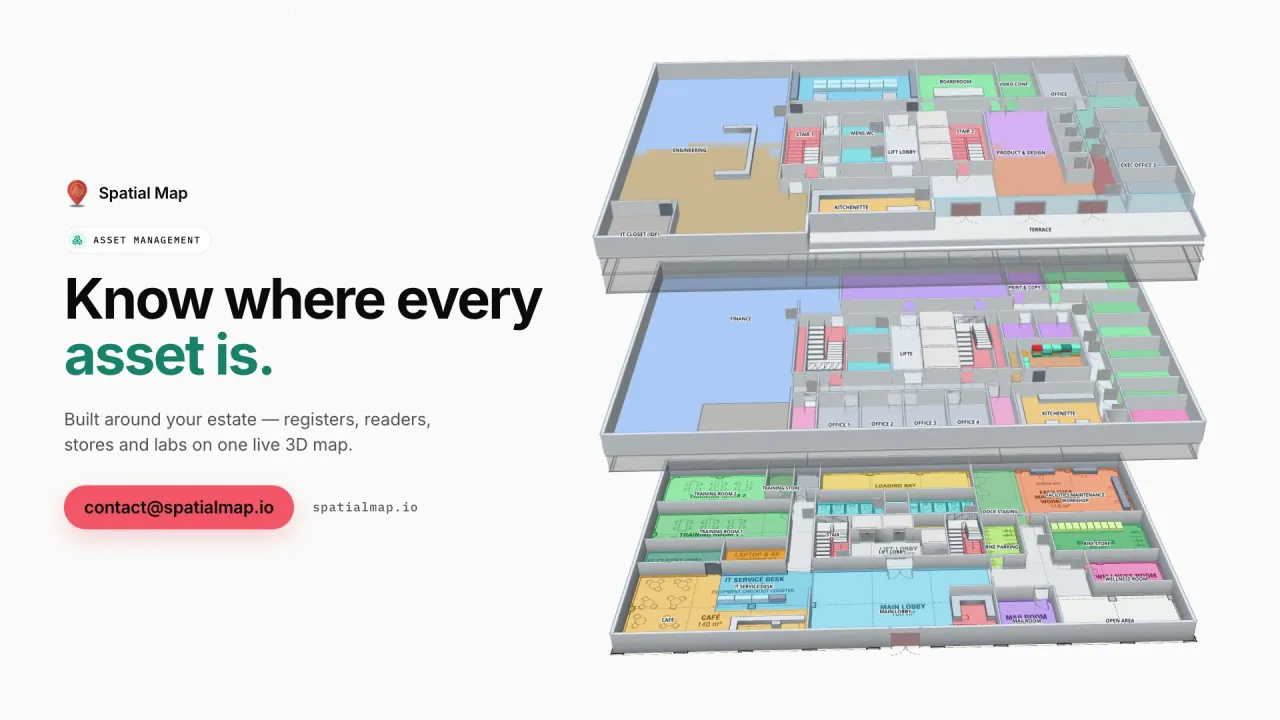
Where a room-by-room location is enough, BLE tags with gateways give it; where you need metres, RTLS and UWB may be worth testing, and a BlueIOT server connects from Integrations with a built-in driver, while other engines connect through the table write API. Spatial Map never computes a position from BLE signal strength itself. The Harborview demo shows equipment checkout by department on a three-floor building.

Services for teams in Shenzhen

Where Shenzhen teams usually start depends on the building:

  • Factories and test labs usually begin with asset tracking for instruments, tooling and carriers, because a missing item stops a line or a test.
  • Component distributors and sample rooms tend to add inventory tracking for reels and trays, with the table write API from the stock system.
  • RTLS and UWB matters mainly in large plants where tools and carriers must be located continuously; most buildings will not need it first.
  • If you have no tags or readers yet, our team can source RFID, BLE and UWB hardware on request, quoted per project, with warranty and device support from the manufacturer: see hardware and demo kits on request.
  • Where you need an Android RFID handheld app or a stock-system integration, our team builds custom software as a client project. The product itself runs as cloud or on-premises.

Also served nearby

The same approach covers Bao’an, Longgang, Nanshan and Futian, and the factory towns of Dongguan and Huizhou beside the city. Nothing needs to be installed at any of them: the map opens in a browser. For data-location questions, see the notes on China.

How Spatial Map does it

From the cupboard to the live map

  1. 01

    Pick one set of assets

    Test instruments, tooling, sample kits, reels or returnable crates, wherever a missing item stops the work.

  2. 02

    Upload the plan and tag the items

    Place the lab, line or store at real scale; tag with RFID, BLE or a barcode label, and name locations as people say them.

  3. 03

    Connect reads and checkouts

    Reader middleware or your stock system posts rows through the write API, REST polling or CSV uploads.

  4. 04

    Add overdue and silence rules

    In-app alerts for items out too long and for readers that stopped reporting.

What Shenzhen teams track

High-value components and finished units

Reels, trays and units read zone by zone in a secure store, with a shrink report.

Work-in-progress carriers

Carriers between stations, with held lots and rack locations.

Shared instruments and equipment

Checkout by department, with overdue items coloured on the plan.

Returnable crates and pallets

Crates out at ports, zones and customers, counted at the gates.

See it on real demo facilities

Fictional names, real floor plans, live sensors, RFID, BLE tags and gateways — open any of them in the browser.

All 13 demo facilities

Asset tracking in Shenzhen — questions we get

Yes. Tag each item with RFID or BLE, or give it a barcode label scanned at checkout, and post a row each time it is read or checked out. The marker moves on the map of the right floor and keeps its history.

It is not an equipment-automation system. It maps the stores, tools, carriers and docks around production, fed by the RFID, MES or stock rows your own systems post to a table or expose over REST.

Only through an RTLS engine. A BlueIOT server connects from Integrations with a built-in driver; other engines post rows through the write API or a polled REST endpoint. Spatial Map never computes positions from BLE signal strength itself, and room-level BLE is often enough.

Keep a checkout table with a row per handover and read it on the map and in reports. Spatial Map does not identify people; the record is what your team enters or your door and tag systems post.

No. Spatial Map is sold online and our team works with customers in China remotely, by video call and through the contact form. There are no local resellers or partners.

In US dollars, the same worldwide: a 7-day free trial for up to 5 facilities with no card, then Pro at $60 a month or $600 a year for up to 4 facilities. RFID and BLE hardware, if you ask us to source it, is quoted per project and is not part of the subscription.

Put one lab or store on a live map this week.

Start the free trial and open the Northgate demo, or send us a plan of a lab, store or line and a list of the items you lose most often through the contact form.