Ningbo · Ningbo-Zhoushan, Meishan and the maker clusters

Inventory tracking in Ningbo, from the dry port to the packing line

Spatial Map shows stock where it is: racks coloured by status, cartons read at the door, work-in-progress carried between stations, all on a live 3D map of the building. Inventory tracking in Ningbo covers two very different worlds that share one port: freight sheds fed by sea-rail trains and a bonded port area on Meishan island, and the factories that make appliances, moulds, stationery and garments for export. Your WMS, ERP and RFID readers post the data; Spatial Map puts each row where it belongs.

No credit card. Runs in the browser. Pro is $60/month for up to 4 facilities. Book a demo

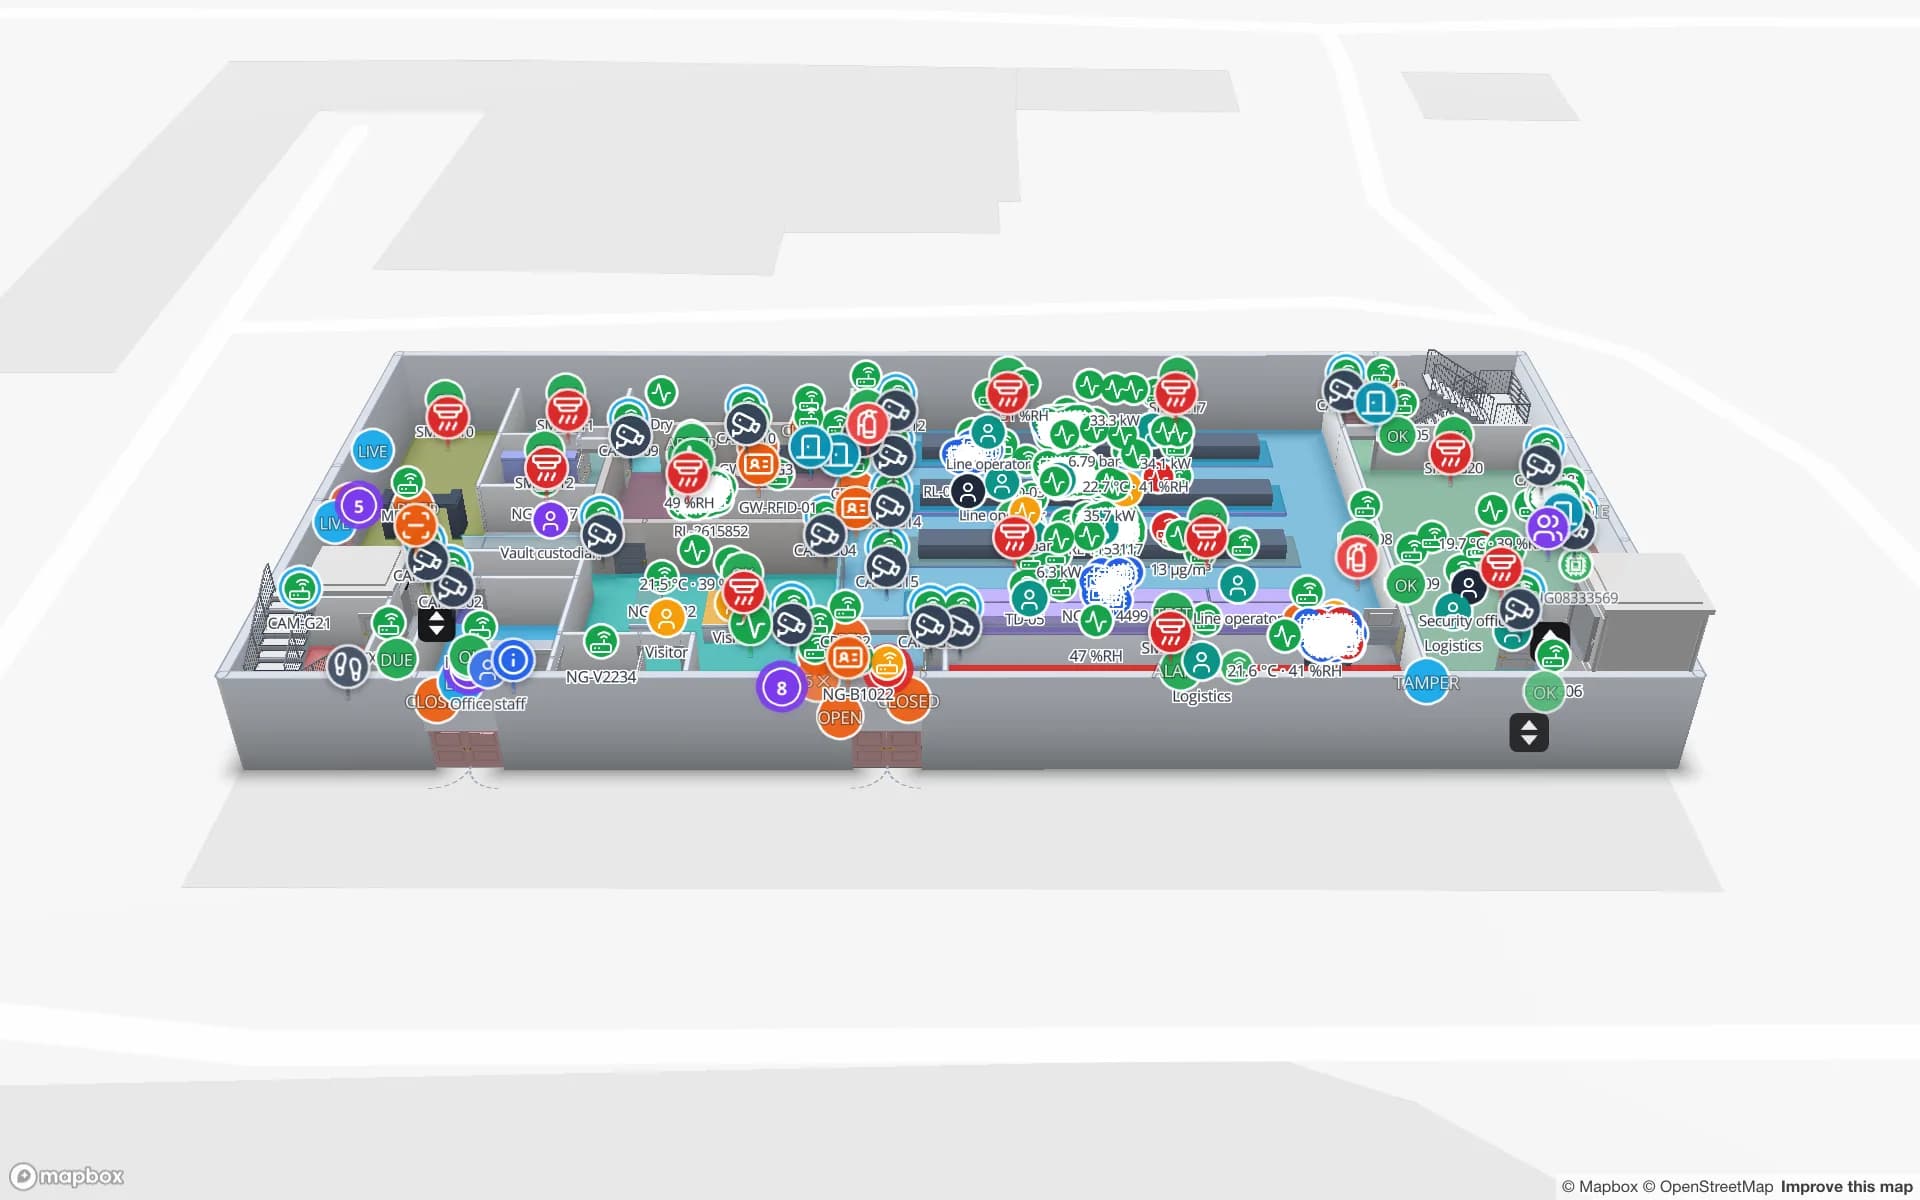
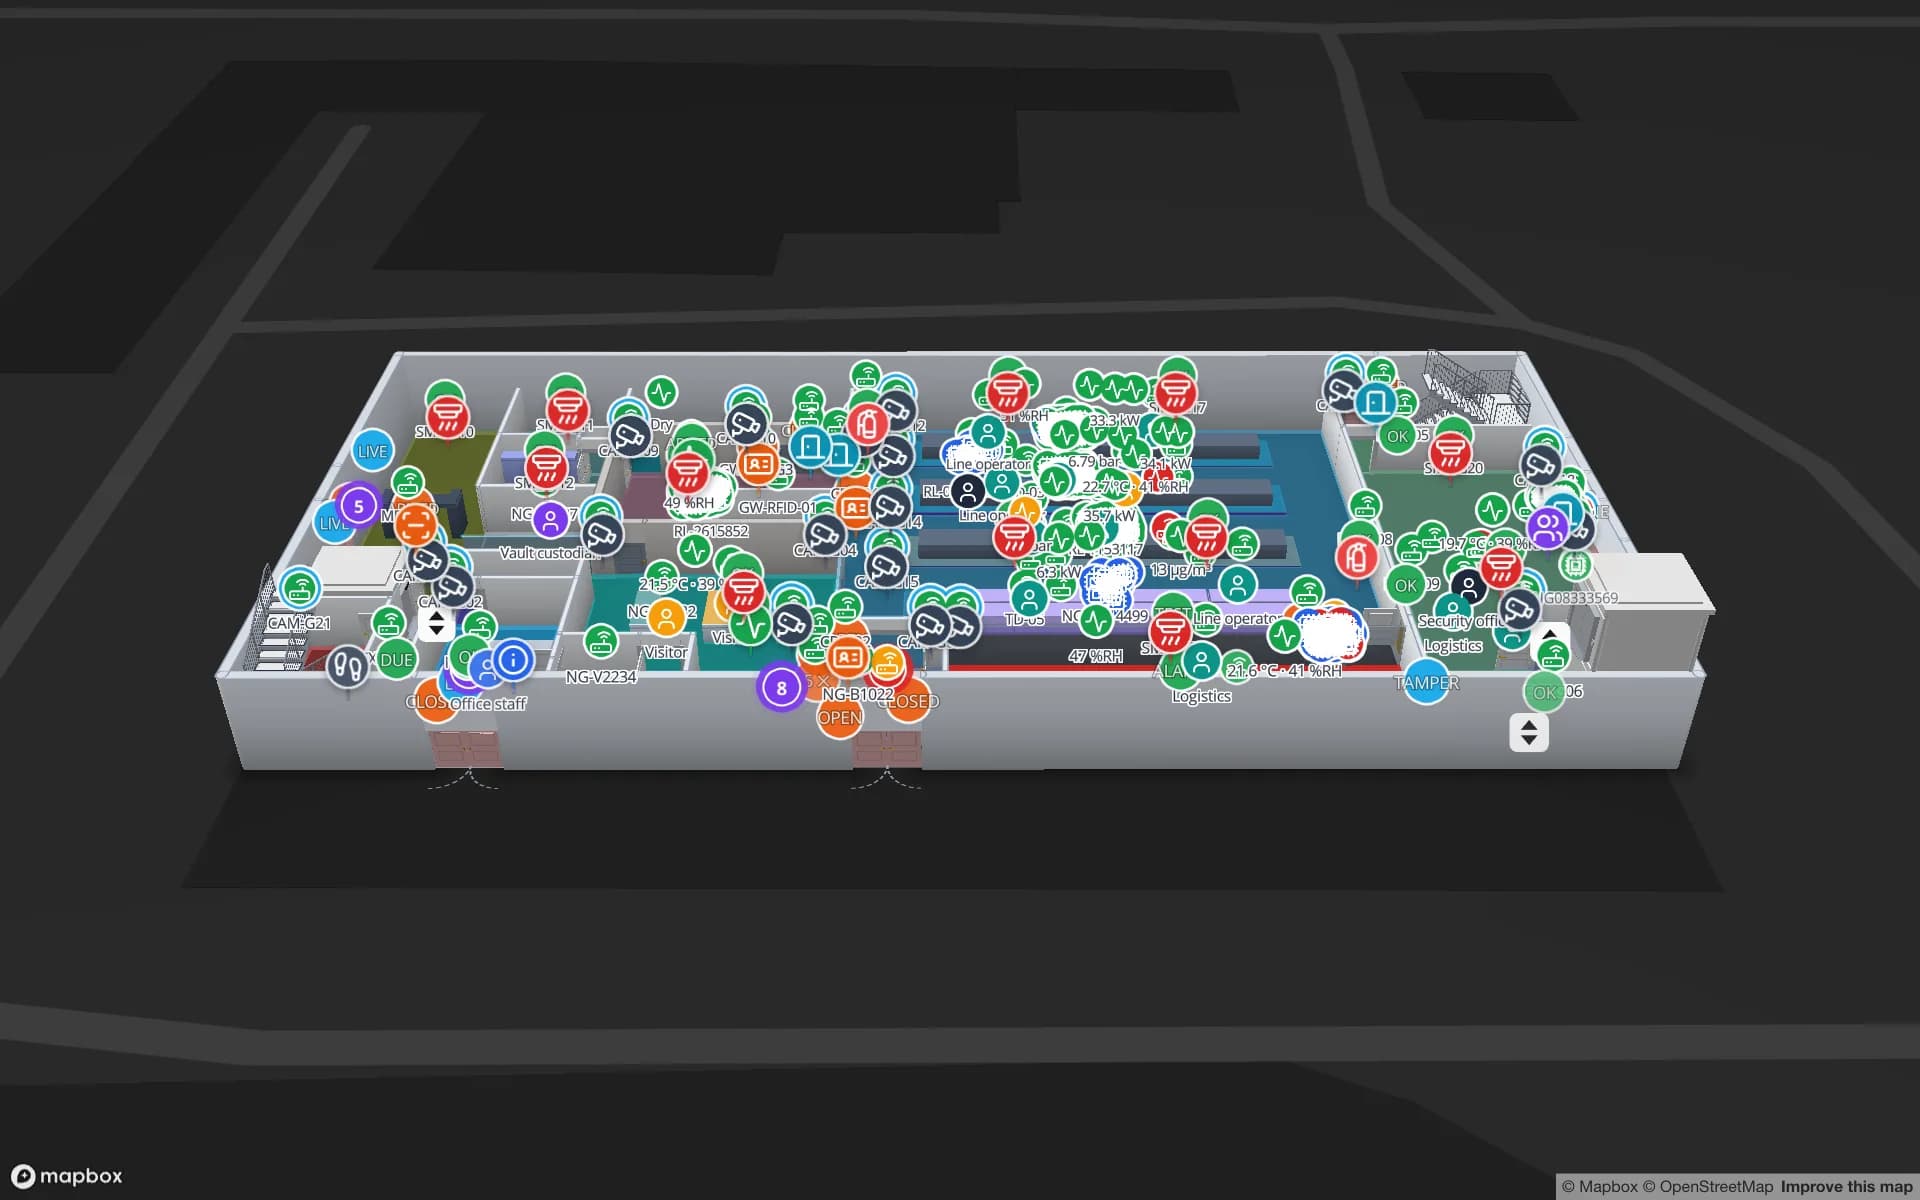
Summit Assembly Plant, a assembly plant demo, in the Spatial Map 3D viewer with live device markers
Summit Assembly Plant
Summit Assembly Plant, a demo factory: assembly lines, raw-material and finished-goods racks with 867 locations, and receiving and shipping docks.
TEU of container sea-rail intermodal at Ningbo-Zhoushan in 2025
2 million
Rack locations in the Summit Assembly demo
867
How often alert rules are checked, with alerts shown in the app
15 s
Free trial, up to 5 facilities, no credit card
7 days

Sea-rail, dry ports and a bonded port area

China Daily reported that Ningbo-Zhoushan Port passed 2 million TEU of container sea-rail intermodal transport in 2025, a national record, the second-highest nationwide for seven years running. The network spans 111 intermodal lines, 40 dry ports and 69 cities in 16 provinces. A box that arrives by train at a dry port is unloaded into a shed, and a box that leaves by train is built up in one.

The Ningbo Meishan Bonded Port Area was approved by the State Council on 24 February 2008 and is described as the fifth bonded port area in China, with about 7.7 square kilometres on Meishan island and operations starting in April 2010 according to one report. The Zhejiang free trade zone was expanded in September 2020 to include a Ningbo area. Whichever sheds you run in these places, the building-level questions are the same: what is in each bay, what is staged for which train or vessel, and what has left. Draw bays as areas, post a row per pallet or carton from your WMS or RFID readers, and the map colours each bay by status. The Eastport demo shows doors, yard slots and gates. Spatial Map does not connect to rail, port or customs systems.


The Hangzhou Bay Bridge and two warehouses

The Hangzhou Bay Bridge, 36 kilometres long, opened on 1 May 2008 and, according to the Hangzhou government, shortened the distance between Ningbo and Shanghai by 120 kilometres and the drive from four hours to two. That makes a stock transfer between a Ningbo shed and a Shanghai one a same-day operation, and it is why many operators hold stock on both sides of the bay.

Stock in transit is the part of inventory that nobody can see. Tag pallets at the shipping door, read them at the receiving door and keep a transfer table with one row per move; the map shows which pallets are on the road, which have arrived and which are overdue, with an in-app alert for any that exceed the usual drive. A Pro workspace holds up to four facilities, so a Ningbo shed, a Shanghai shed and a factory store can be opened from one account.

Appliances, moulds, stationery and garments

A 2016 China Daily overview of Ningbo’s industries lists home appliances as one of China’s three major production bases, with over 3,000 manufacturers and about 10,000 supporting factories, and the city as one of three major mould bases, with over 3,000 mould makers. It counts over 800 stationery producers making about a third of China’s exported stationery, and over 2,000 garment makers. Those figures are a decade old, so treat them as a picture of the mix, not a count.

Each trade has its own inventory problem. Appliance makers move bulky finished goods and thousands of components between supplier factories and an assembly shed. Mould makers hold tools that cost more than a lorry and move between machining, trial and storage; tag the mould itself, with tags tested on metal first (see RFID tags for metal, liquids and apparel). Stationery and garment exporters pack small items into cartons per order and destination. The Summit Assembly demo shows racks with 867 locations, work-in-progress carriers and shipping docks, and the Crestline demo shows pick modules and packing stations.

Counting stock without a closed shed

Ningbo’s exporters work to vessel and train schedules, which makes a closed-shed stocktake expensive. A handheld or fixed RFID reader can count a tagged rack in minutes, and the map shows differences by location: how RFID stock counting works explains the trade-offs, and RFID versus barcode helps pick where each belongs. Not every item needs a tag; many plants start with RFID on mould, pallet and carton level and keep barcodes for small parts.

If you have no readers yet, a bin-inventory export is enough to start: upload the CSV, see racks coloured by stock, and add the live feed when it is worth the effort. Our RFID inventory system service builds the back office and the handheld app if you want them.

Services for teams in Ningbo

Where Ningbo teams usually start depends on the building:

  • Freight sheds, dry-port stations and bonded warehouses usually begin with inventory tracking at dock doors and staging lanes.
  • Factories tend to begin with a map of the plant coloured from the stock system, then add RFID at mould, pallet and carton level.
  • Asset tracking suits mould shops and shared equipment, where one missing tool stops a job.
  • If you have no readers or tags yet, our team can source RFID readers, antennas and tags on request, quoted per project, with warranty and device support from the manufacturer: see hardware and demo kits on request.
  • Where you need an Android RFID handheld app or an ERP or WMS integration, our team builds custom software as a client project. The product itself runs as cloud or on-premises.

Also served nearby

The same approach covers Cixi, Yuyao, Fenghua, Ninghai and Beilun, as well as Zhoushan across the water, Hangzhou and Shaoxing. Nothing needs to be installed at any of them: the map opens in a browser. For data-location questions, see the notes on China.

How Spatial Map does it

From the dry port to the despatch door

  1. 01

    Pick one building

    A freight shed, a bonded bay, a factory store or a mould shop, wherever a missing item costs most.

  2. 02

    Map bays and racks

    Upload the plan, photo or sketch, let AI Map draft the floor, and name locations the way your WMS names them.

  3. 03

    Connect stock and reads

    Your WMS or ERP and RFID middleware post rows through the write API, REST polling or CSV and Excel uploads.

  4. 04

    Add transfer and silence rules

    In-app alerts for pallets overdue between sites and readers that stopped reporting.

What Ningbo teams track

Dry-port and freight sheds

Doors, lanes and pallets staged for the right train or vessel.

Plant stores and work-in-progress

Raw-material and finished-goods racks, with carriers between stations.

Export cartons and packing

Cartons read at packing and the despatch door, with each order’s status by lane.

Moulds and shared tools

High-value tools found by tag, with checkout and overdue status.

See it on real demo facilities

Fictional names, real floor plans, live sensors, RFID, BLE tags and gateways — open any of them in the browser.

All 13 demo facilities

Inventory tracking in Ningbo — questions we get

No. It has no link to rail, port community, customs or terminal systems. It shows what happens inside your own building, from your own WMS or ERP, RFID reads and sensors, so it complements those systems rather than replacing them.

Yes. Keep a transfer table with one row per move, tag pallets at the shipping and receiving doors, and put both buildings in one workspace. An alert rule can flag pallets that stay on the road longer than usual; alerts appear in the app.

It depends on the tag, the mould and the mounting, so test candidates on your own tooling before you buy in quantity. Spatial Map does not make tags; it shows the reads your hardware produces.

Yes. Upload a CSV or Excel bin-inventory export and racks are coloured by stock straight away. The write API or a polled REST endpoint can keep it live later.

No. Spatial Map is sold online and our team works with customers in China remotely, by video call and through the contact form. There are no local resellers or partners.

In US dollars, the same worldwide: a 7-day free trial for up to 5 facilities with no card, then Pro at $60 a month or $600 a year for up to 4 facilities. RFID hardware, if you ask us to source it, is quoted per project and is not part of the subscription.

Map one Ningbo shed before the next train.

Start the free trial and open the Summit Assembly demo, or send us a bin-inventory export and the plan of a shed or plant store through the contact form.