Vienna · Danube port, Vienna Airport cargo and campuses

Asset tracking in Vienna, from the heavy-lift yard to the lecture hall

Spatial Map shows where tagged assets are on a live 3D map of each building and yard, using the reads and positions your RFID and BLE systems already produce. Asset tracking in Vienna covers three very different places: a Danube port that works as an estate of tenants, an airport whose cargo halls hold containers and pallets that must come back, and campus buildings full of shared equipment. The app is available in German for the floor team, and each place is a facility in one workspace.

No credit card. Runs in the browser. Pro is $60/month for up to 4 facilities. Book a demo

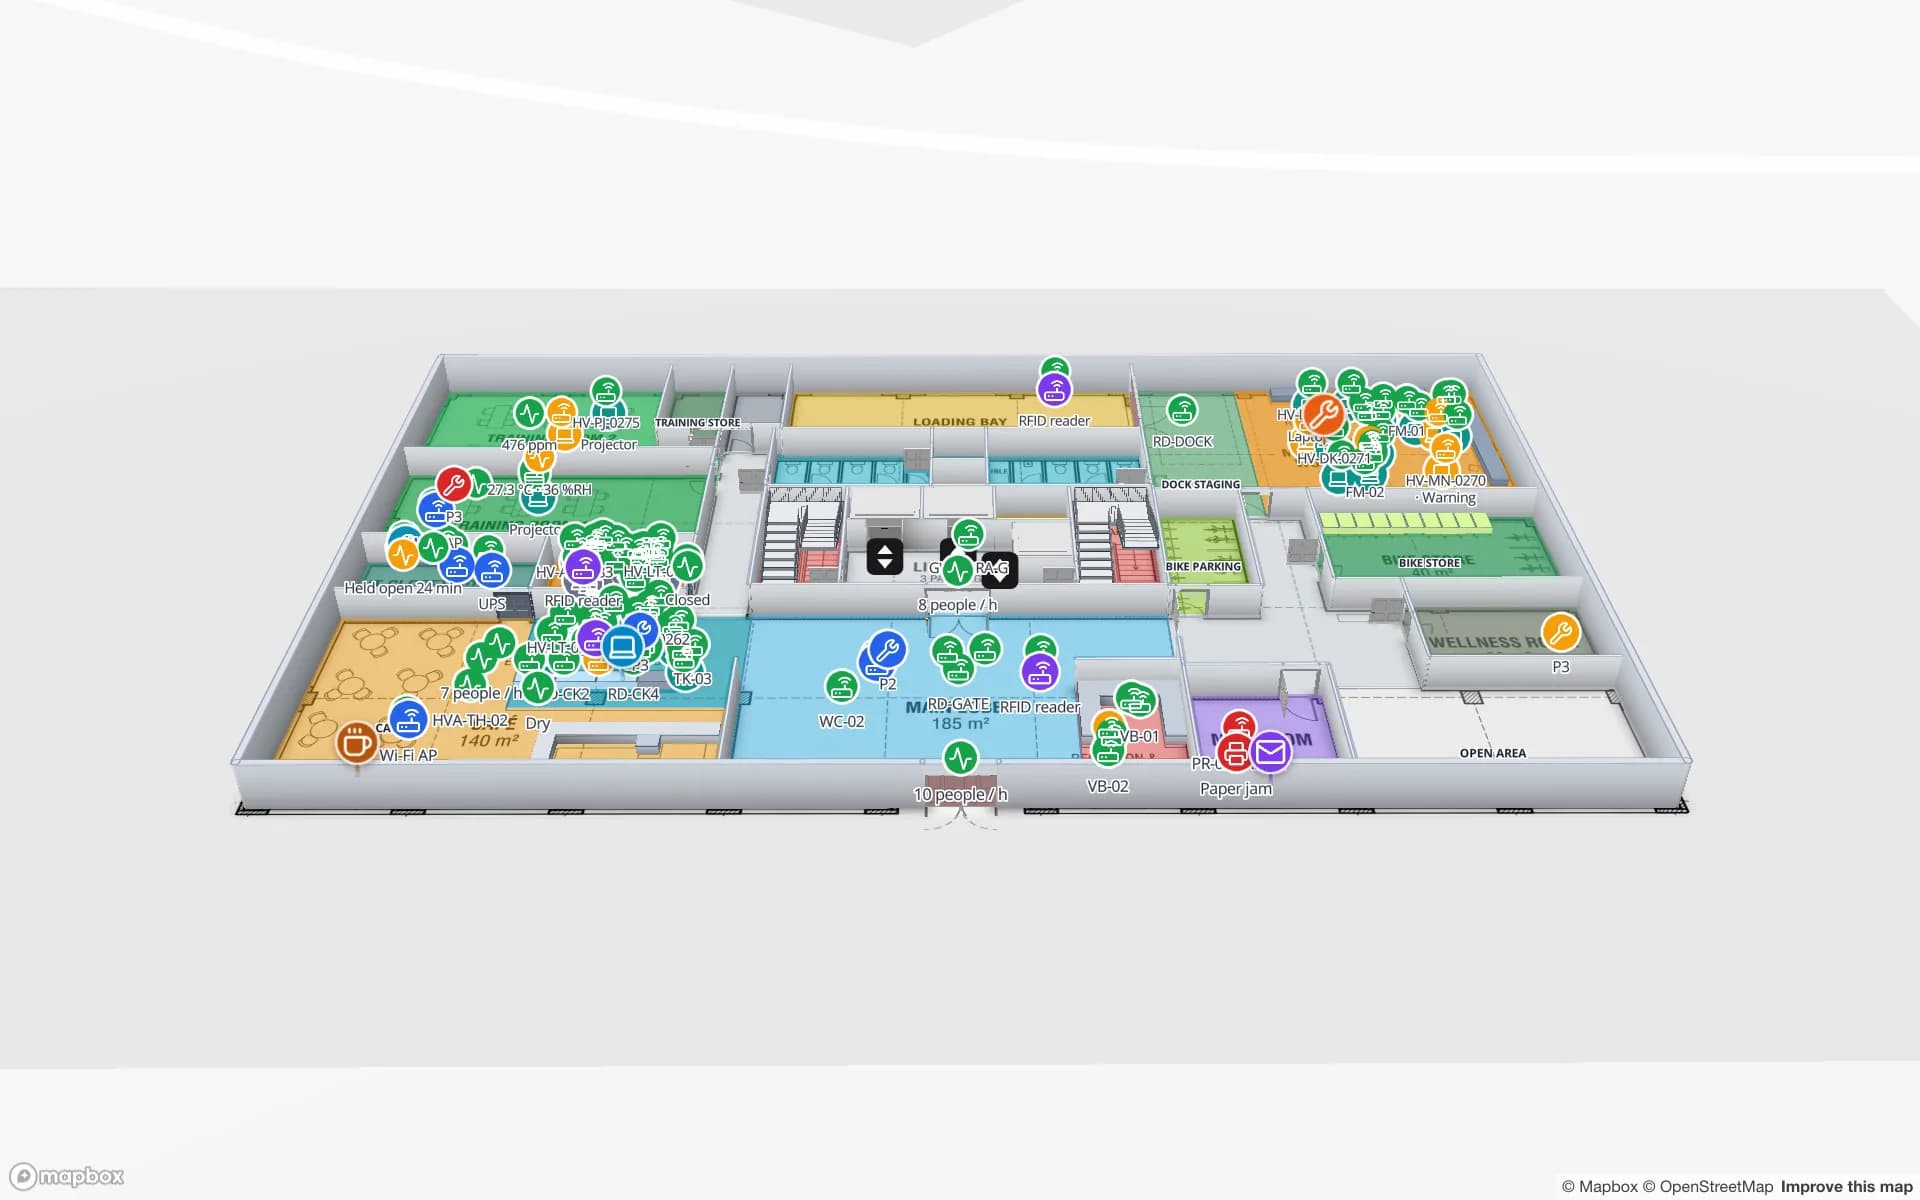
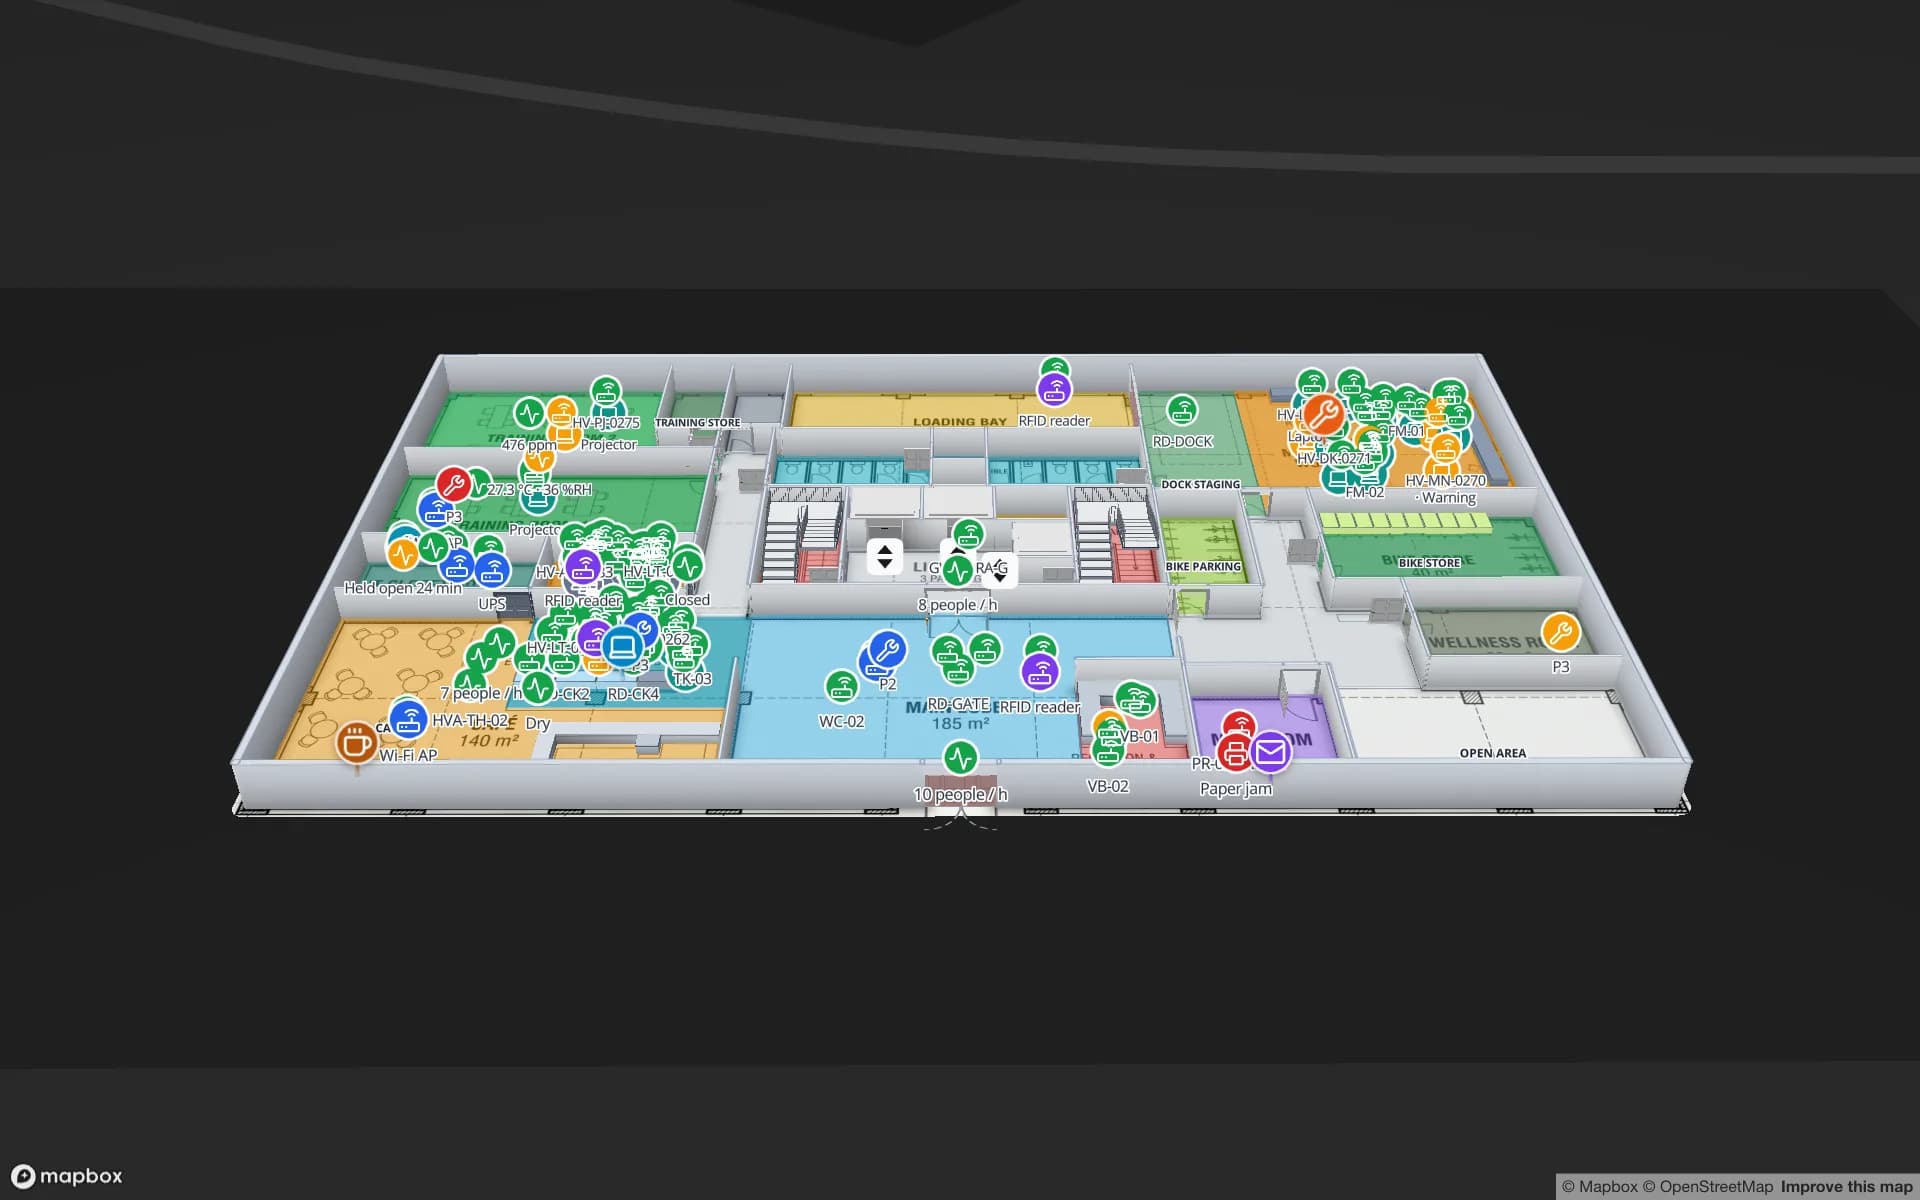
Harborview Corporate Campus — Building A, a corporate office building demo, in the Spatial Map 3D viewer with live device markers
Harborview Corporate Campus — Building A
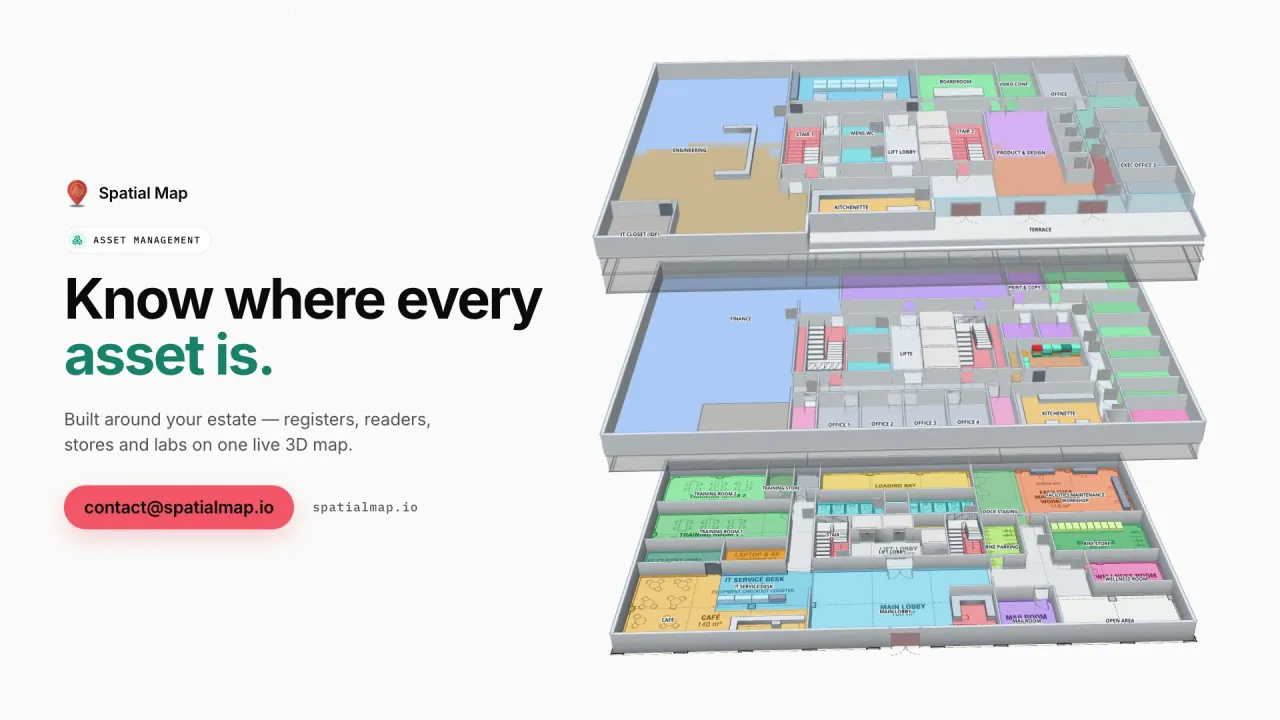
Harborview Corporate Campus, a demo office building on three floors: the asset register, equipment check-out, stores and spares, work orders and meeting rooms.
Floors in the Harborview demo, with an asset register by room
3
German interface, alongside five other languages
Deutsch
How often alert rules are checked, with alerts shown in the app
15 s
Free trial, up to 5 facilities, no card
7 days

Hafen Wien: an estate with three sites and many tenants

Hafen Wien describes itself as Austria’s largest trimodal logistics hub, joining water, rail and road across about three million square metres. It has three sites. Freudenau is the main hub for bulk cargo, containers and vehicles and holds what the port calls Austria’s largest duty-free warehouse. Albern has five grain silos that hold up to 90,000 tons and a heavy-lift centre for loads up to 450 tons. The Lobau oil terminal handles about one million tons of fuel a year. The container terminal can stack 10,000 TEU, and over 200 private companies, 40 of them freight forwarders, work on the estate. The port is owned 95 % by Wien Holding.

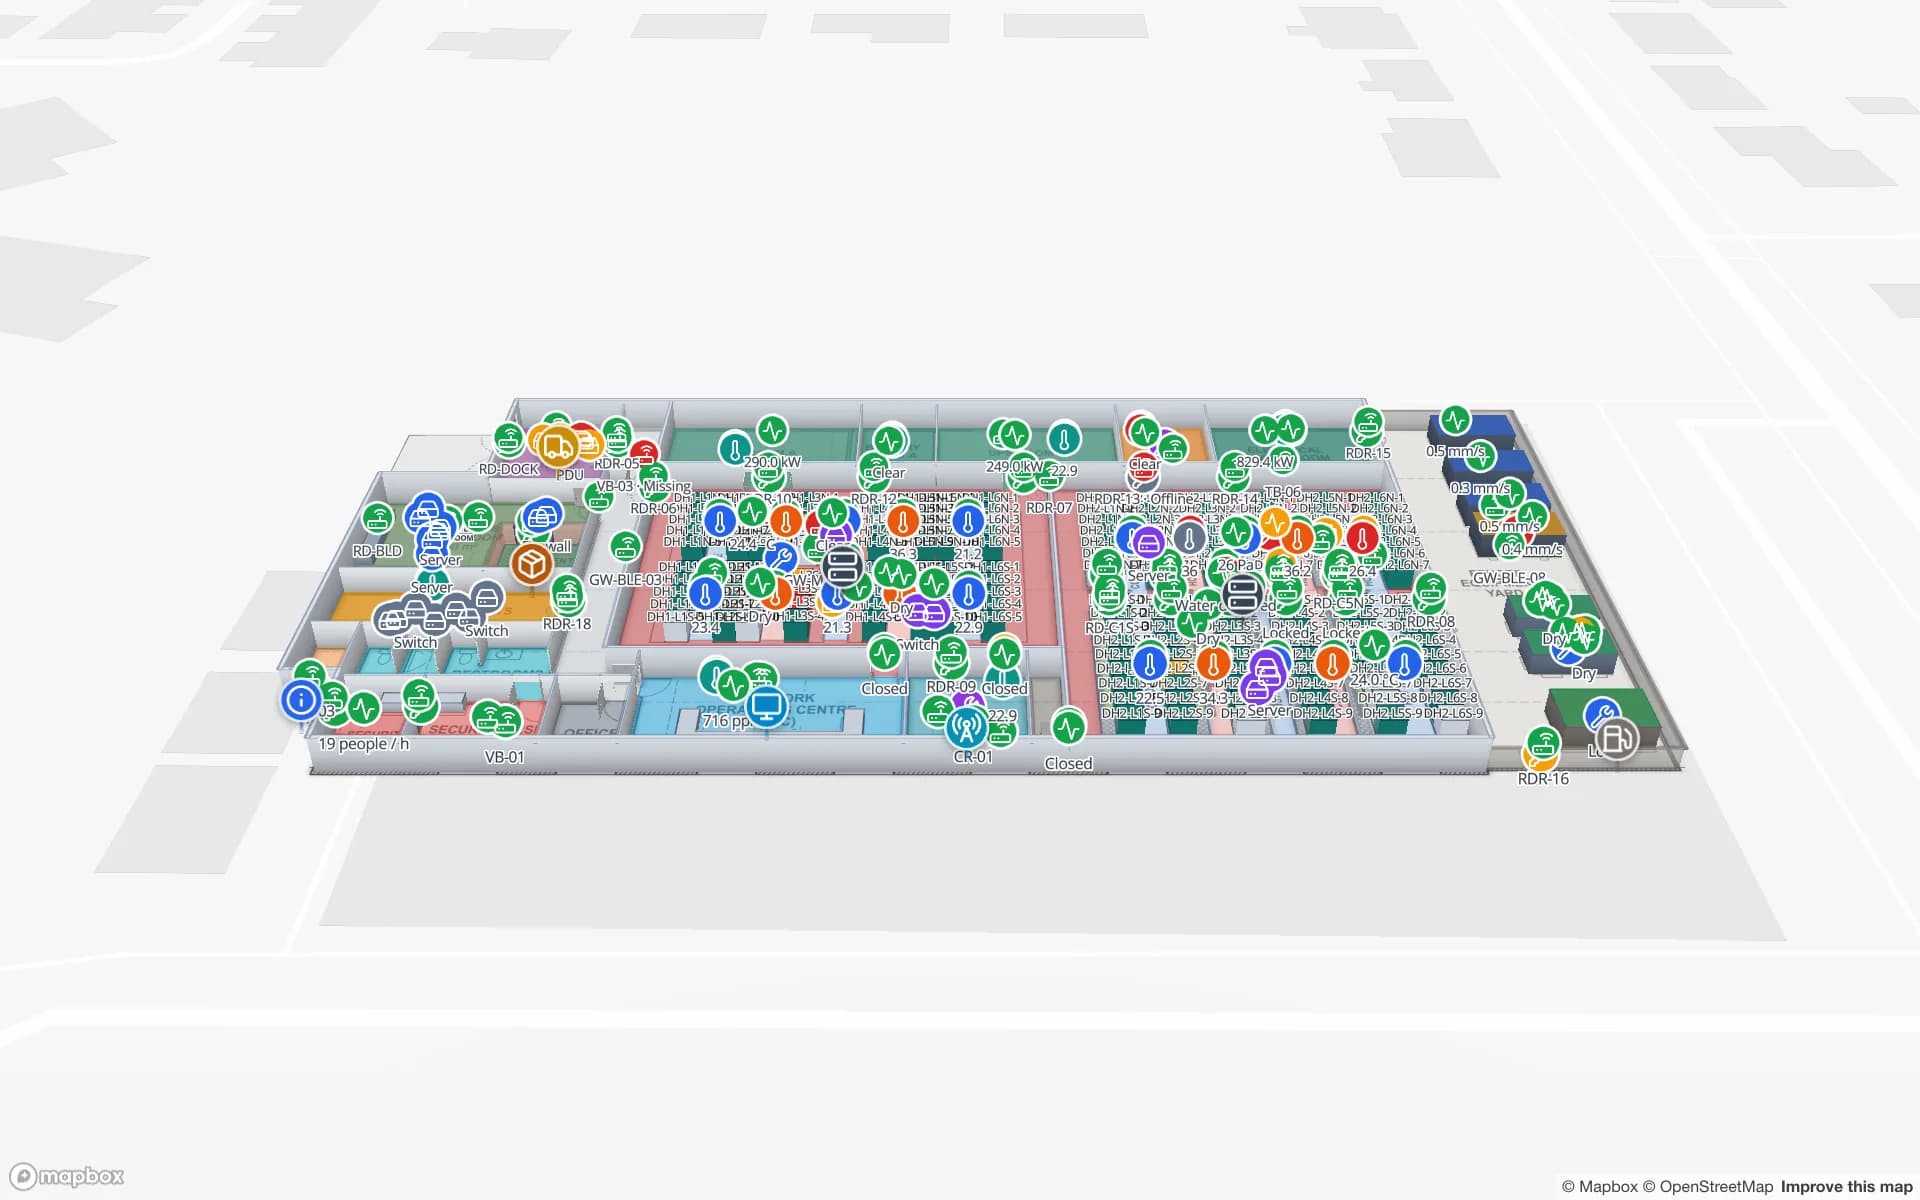
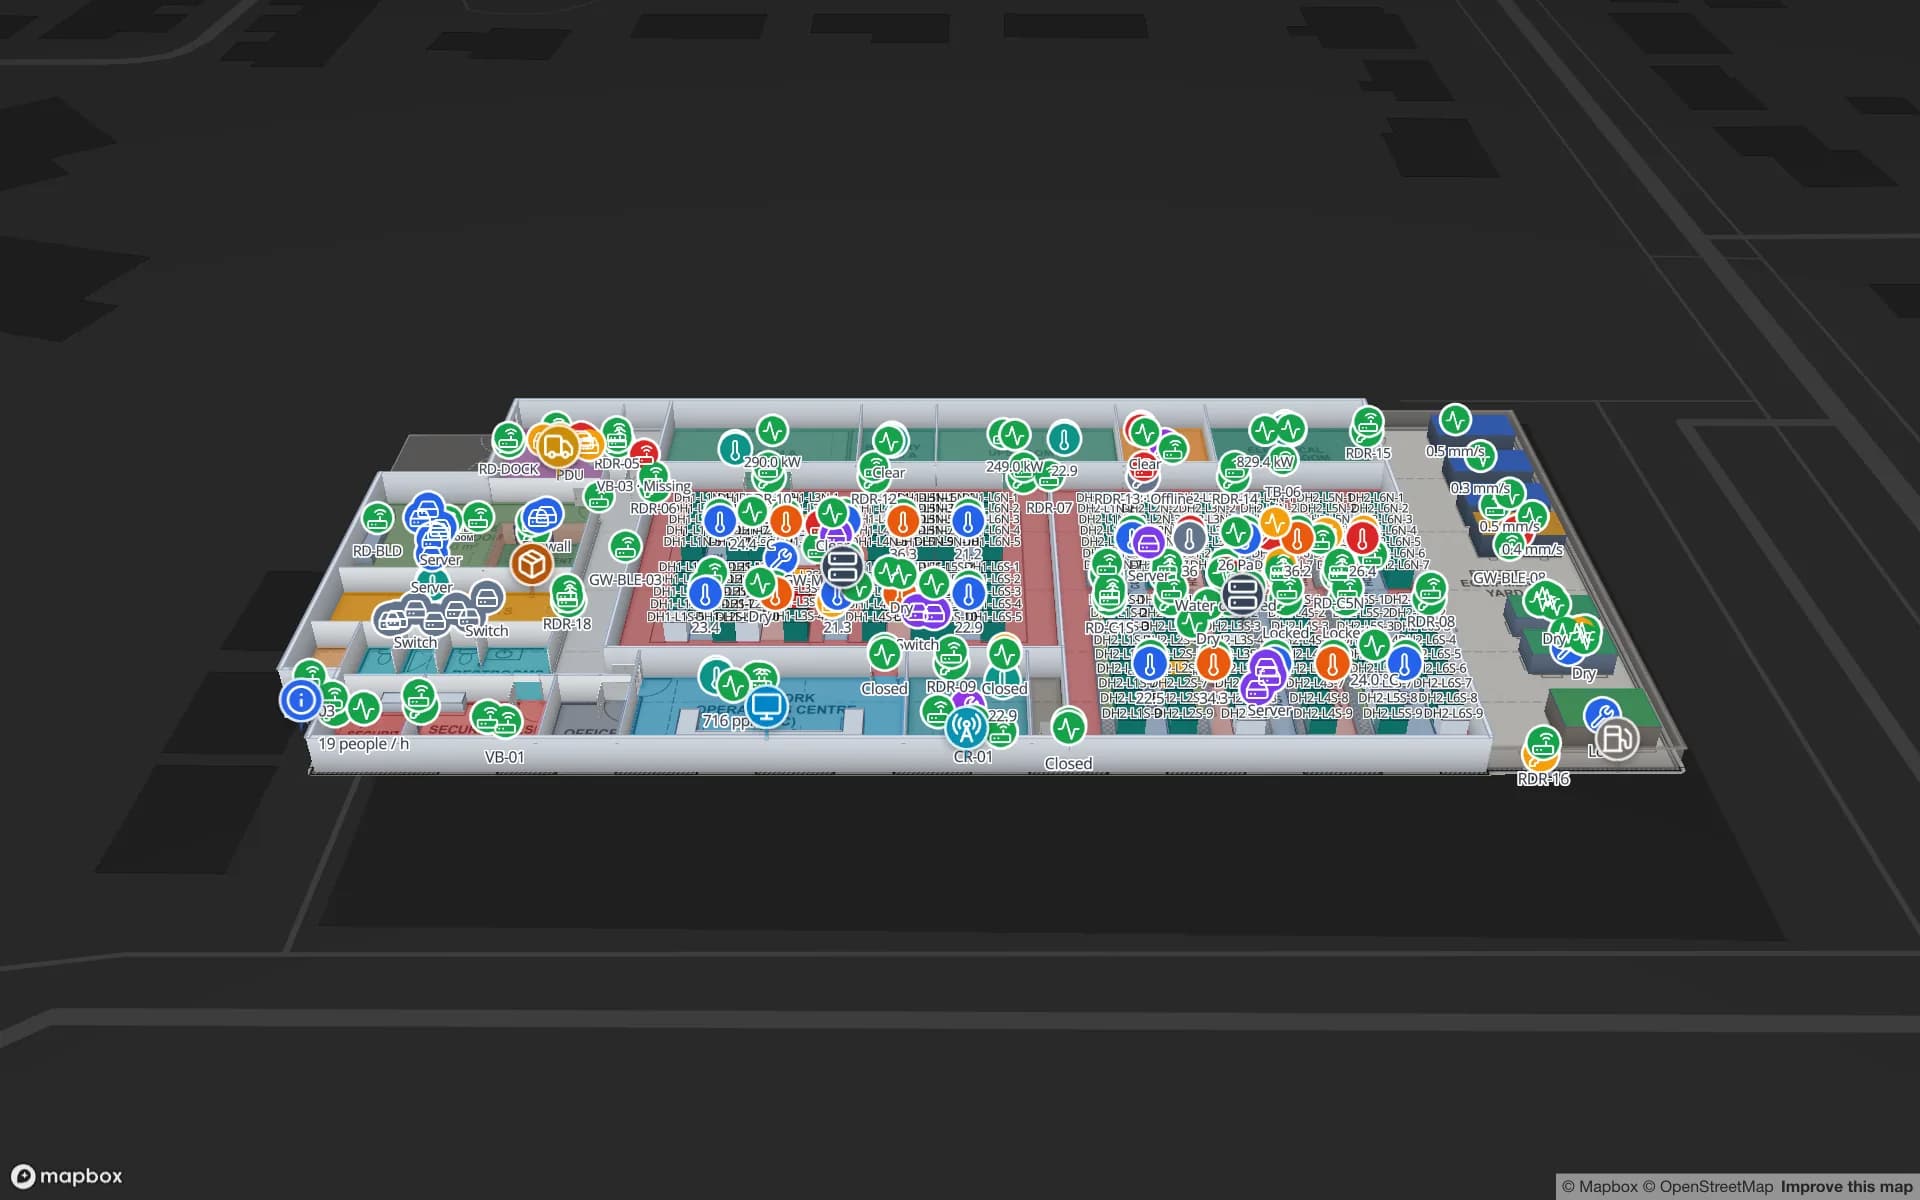
In a place like that the assets that disappear are the shared ones: spreaders and lifting gear, reach stackers and yard tractors, trailers and chassis, swap bodies, returnable pallets and cages. Tag them with RFID or BLE, draw the sites as areas, and the map shows which yard, warehouse or tenant each item last appeared in; the History player replays where it has been, and a rule for “not seen for N hours” raises an in-app alert. The Eastport demo shows a yard with gates, weighbridges and yard tractors on one map. Spatial Map is not a terminal operating system and does not connect to port or customs systems.


Vienna Airport cargo: containers that have to come back

Vienna Airport, at Schwechat just outside the city, handled 313,763 tonnes of freight in 2025, 5.3 % more than the year before, which the airport calls an all-time high. Trade reports quote the airport on e-commerce and pharmaceutical demand and on integrated road feeder services, the trucks that carry cargo to and from other European airports.

Air cargo runs on reusable equipment: pallets, containers and nets that belong to airlines and handlers and must be found, counted and returned. A forwarder’s hall holds hundreds of such items at any time, and a lost one is a recurring bill. Put an RFID reader at each dock door, tag the unit load devices, and a table of units with their last read gives the map something to show: which hall, which door, how long. A count rule can flag a hall that holds more than its target. The RFID asset management page covers the pattern, and read-only share links with an expiry date let a handler see its own equipment without an account.

WU Campus: six buildings, one asset register

The WU campus is a good example of a modern campus: its own pages describe six building complexes with 100,000 square metres of net floor area on a 90,000 square metre property, 55,000 square metres of publicly accessible grounds and about 3,000 student workplaces. A campus of that size has an asset problem that is mostly invisible: projectors and AV carts, laptops and loan devices, test equipment, furniture and the cabling in the server rooms, spread across six buildings and many hands.

Treat each building as a facility and keep one table of assets. A handheld walk-through of each room updates the table, a reader at the store door catches what leaves, and the map shows the register floor by floor. The Harborview demo shows exactly that for an office building: asset register, equipment check-out, stores and spares and work orders on three floors. Rooms and departments keep the names your own system uses, with Austrian terms included.

Plants, workshops and shared tools

Manufacturing around Vienna looks like the plants described on the Austria page: mid-sized halls where gauges, test fixtures, moulds and customer-owned returnable containers move between stations, stores and outside suppliers. These are the assets that stop a line when they go missing.

Tag them with BLE or RFID, draw each bay and store as an area, and a table of tool IDs with their calibration or return dates drives the colours. The Summit demo shows lines, workstations and 867 rack locations on a plant map, and RFID tool tracking explains the crib-door pattern. If tags might identify a person, talk to your works council early; the Austria page explains why, and most plant projects tag containers, kits and tools rather than people.

Services for teams in Vienna

Vienna teams tend to start in one of three places:

  • Port, forwarder and airport-cargo teams begin with asset tracking for returnable equipment, then inventory tracking for the stock in their halls.
  • Campus and facility teams begin with the register itself: indoor maps by building and a table of assets by room, often before any tags are bought.
  • Plants add RTLS and UWB only where vehicles and people must be located continuously; other assets are fine with RFID or BLE.
  • Tags, readers and gateways can be sourced on request, quoted per project, with warranty and device support from the manufacturer; see RFID readers and tags and hardware and demo kits.
  • Where your register lives in an ERP or CAFM, our team builds an asset management system or an integration as a client project. The product runs as cloud or on-premises.

Also served nearby

The same page covers Schwechat and Fischamend beside the airport, Wiener Neudorf and Vösendorf south of the city, Korneuburg and Klosterneuburg across the Danube, and Bruck an der Leitha. The page is also available in German.

How Spatial Map does it

From a spreadsheet register to a live asset map

  1. 01

    Load the register

    Upload a CSV or Excel list of assets with tag IDs, owners and home locations as a table.

  2. 02

    Draw the places

    Import the plan of each building or yard, align it at real scale and draw stores, bays, dock doors and rooms as areas.

  3. 03

    Connect reads and counts

    RFID middleware, BLE gateways or handheld counts post rows through the write API, REST polling or file uploads.

  4. 04

    Add return and silence rules

    In-app alerts for assets not seen for N hours, halls over their target and gateways that stopped reporting; replay history on demand.

What Vienna teams track

Yard equipment and returnables

Trailers, chassis, pallets and cages by yard slot, dock door and tenant.

Campus and office equipment

Laptops, AV carts and lab kit by room and floor, with check-out and return.

Plant tools and gauges

Tools and fixtures located by bay, with return dates from your system.

Server rooms and IT stores

Cabinet rows, spares and environment sensors in the hall.

See it on real demo facilities

Fictional names, real floor plans, live sensors, RFID, BLE tags and gateways — open any of them in the browser.

All 13 demo facilities

Asset tracking in Vienna — questions we get

No. It has no link to terminal, customs, handling or airline systems. It shows what your own RFID and BLE systems, handhelds and registers send it, so it complements those systems rather than replacing them.

If a system is used to monitor employees and affects human dignity, the ArbVG generally requires a works agreement before it is introduced; your legal advisers and works council decide the details. Projects that tag containers, tools and equipment rather than people usually raise fewer questions, and Spatial Map shows only the data you send it.

Yes. The app ships in German alongside English, French, Spanish, Arabic and Chinese, and each user picks their own language. Your own content — room names, asset types and report titles — stays exactly as you write it.

Yes. Read-only share links can be limited to chosen floors and layers, with an expiry date and a view cap, and can be revoked at any time; the viewer needs no account. Facilities, reports and data can also be grouped into named solutions per client.

No. Spatial Map is sold online and our team works with customers in Austria remotely, by video call and through the contact form, in German or English. There are no local resellers or partners.

No. Pricing is the same worldwide and in US dollars: a 7-day free trial for up to 5 facilities with no card, then Pro at $60 a month or $600 a year for up to 4 facilities. Tags and readers, if you ask us to source them, are quoted per project.

Put one Viennese yard or campus building on a live map.

Start the free trial in German or English, or send us a plan and a sample of your asset register through the contact form.