
Warehouse temperature mapping: protocol, sensor grid and what comes next
Warehouse temperature mapping explained: logger grid, study length, summer and winter studies, hot and cold spots, the report, and monitoring on a live map.
What warehouse temperature mapping is
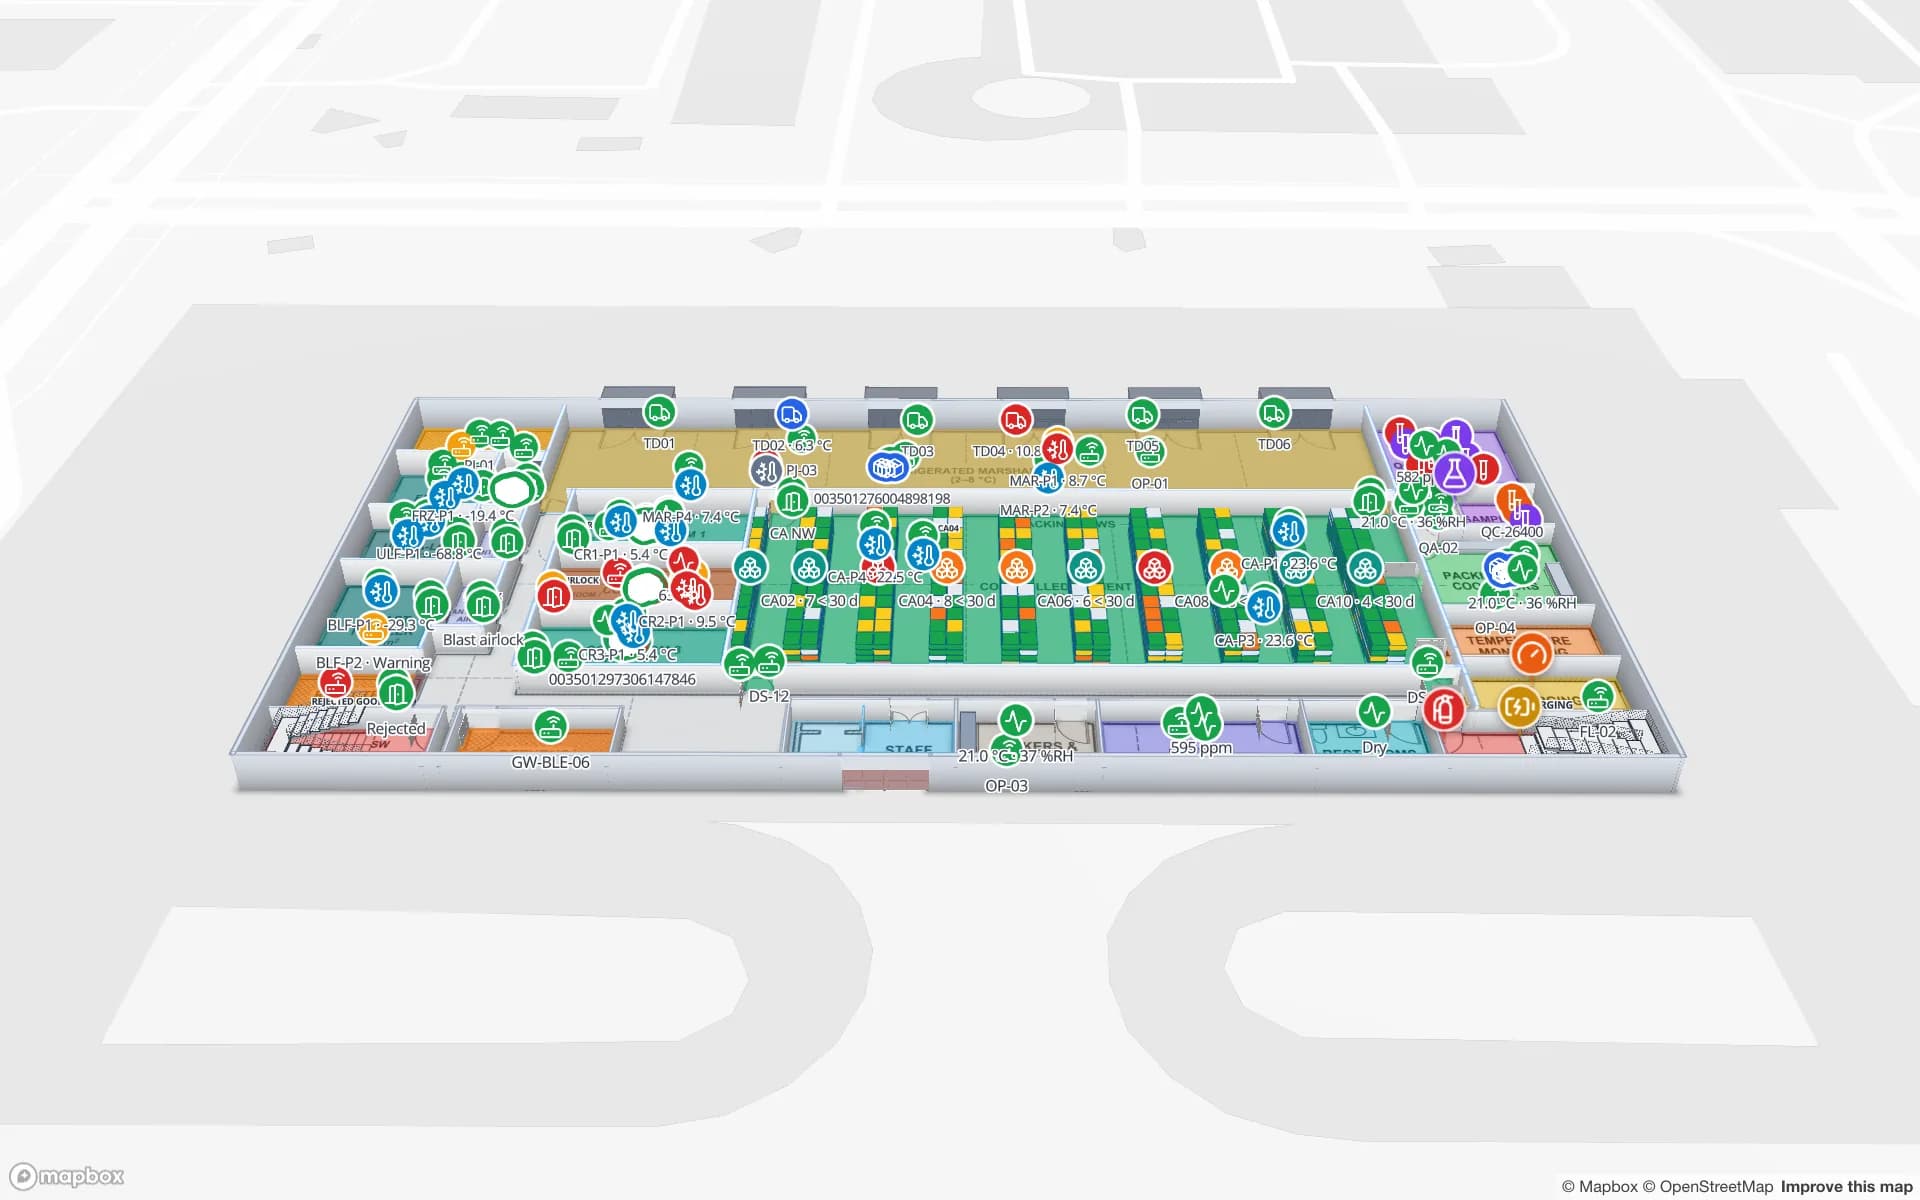
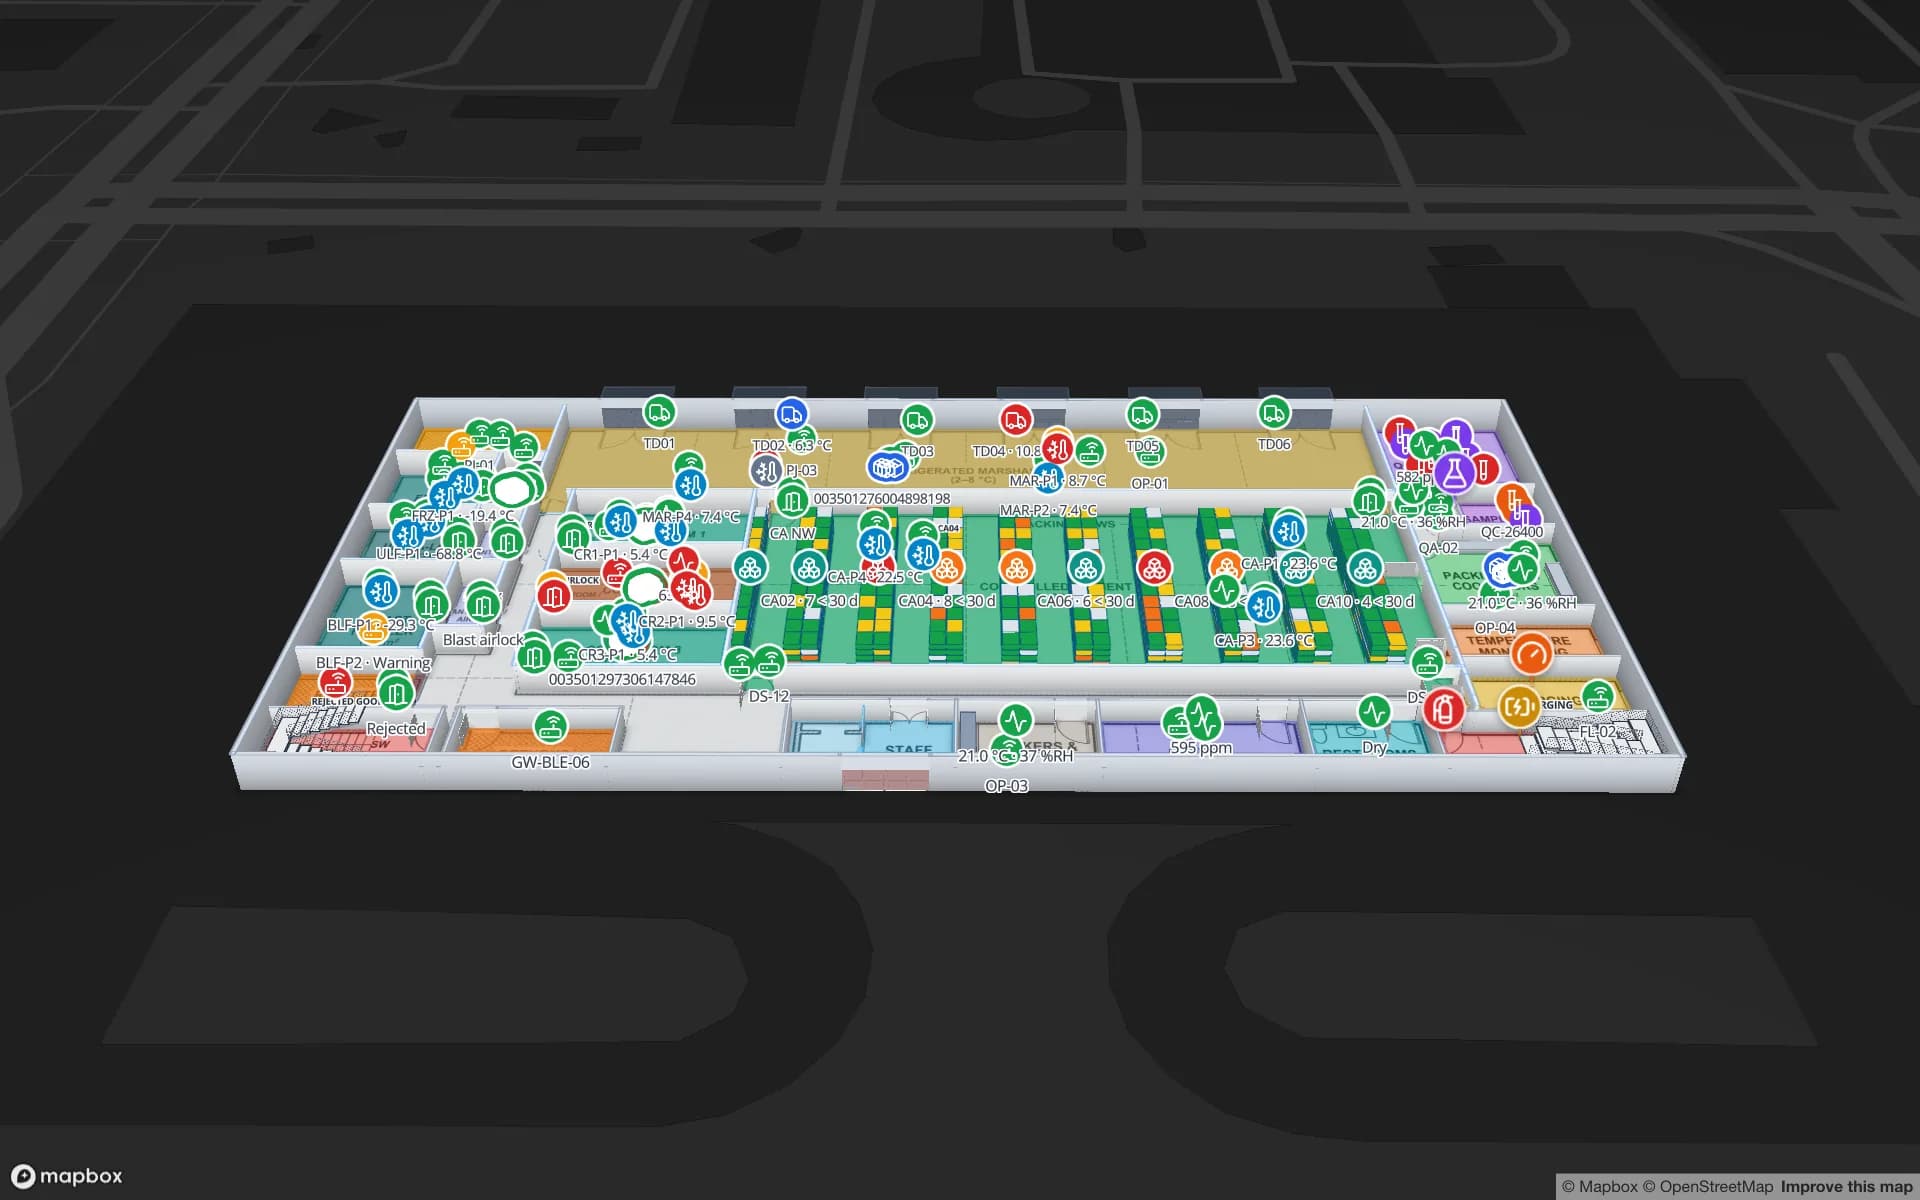
Spatial Map is a live indoor map for facilities; it does not run mapping studies, but it is where the continuous monitoring that follows one can live, on the floor plan. Warehouse temperature mapping is the study itself: a temporary grid of calibrated data loggers, left in a storage area for a set period, to find out how temperature really varies across it — where the hot and cold spots are, how fast the space recovers after a door opens, and whether the whole volume stays inside the product’s labelled range.
Mapping and monitoring are often confused. They answer different questions and use the results of each other:
| Temperature mapping | Temperature monitoring | |
|---|---|---|
| Question | How does temperature vary across this space? | Is it in range right now, and was it in range all along? |
| Sensors | Many temporary loggers on a 3D grid | A few permanent probes at the points the study found |
| Duration | Days to weeks, then repeated | Continuous |
| Output | A mapping report with hot and cold spots and probe positions | Readings, excursions, alarms and an audit trail |
What the guidance asks for
For medicines, the best-known references are the EU Guidelines on Good Distribution Practice (GDP) of medicinal products for human use and the World Health Organization’s technical supplement “Temperature mapping of storage areas” (Supplement 8 to Annex 9 of WHO Technical Report Series No. 961). In broad terms, the EU GDP guidelines expect an initial mapping exercise before a storage area is used, under representative conditions; permanent monitoring devices placed according to the results, at the points with the most extreme fluctuations; and a repeat of the exercise based on risk assessment or after significant changes to the facility or its temperature control.
A mapping study, step by step
- 1Define scope and acceptance criteria
Which rooms, which volume (floor to the highest storage level), and which range the space must hold — for example 15–25 °C for an ambient area or 2–8 °C for a cold room, taken from the products’ labels. Write down what counts as a pass before you collect any data.
- 2Walk the space and list the risks
Dock doors, roller shutters, HVAC supply and return points, evaporators, roof and outside walls in the sun, skylights, lighting, battery charging, dense racking that blocks air. These decide where extra loggers go.
- 3Lay out the logger grid
Spread loggers evenly across the length and width, and at several heights in racked areas — near the floor, the middle and the top storage level. Add loggers at each risk point. The WHO supplement describes how to size the grid; many studies end up with loggers several metres apart in each direction.
- 4Use calibrated loggers
Each logger needs a valid calibration certificate traceable to national standards, a known accuracy and a synchronised clock. Number each one and record its position on a drawing.
- 5Run the study long enough
Cover normal operation over several consecutive days, including a weekend or shutdown and peak activity; seven days or more is common for ambient warehouses. Log every few minutes so door openings and defrost cycles show up.
- 6Repeat it in summer and winter
Ambient areas behave differently in hot and cold seasons, so studies are usually run at both extremes. Cold rooms add tests such as a door left open or a power cut, to measure recovery time.
Where hot and cold spots usually are
| Location | Why it drifts | What it usually leads to |
|---|---|---|
| Top rack levels under the roof | Heat rises and roofs warm in the sun | Restricted storage at top levels, or a permanent probe there |
| Next to dock doors | Outside air on every opening | Air curtains, strip doors, a buffer zone with no sensitive stock |
| Outside walls facing the sun | Radiant heat in the afternoon | A probe on that wall; seasonal limits |
| Close to evaporators or supply vents | Cold air hits product directly | Keep-clear zones; a probe at the coldest point |
| Corners and behind dense racking | Dead air, slow recovery | Better airflow or no sensitive stock there |
| Near charging areas and offices | Equipment and people give off heat | Move charging, or exclude the zone |
The analysis reports, per logger, the minimum, maximum and mean, the time spent out of range and the recovery time after events. The report then names the hottest and coldest positions — and those positions become the places for the permanent monitoring probes.
What goes in the mapping report
- The protocol, acceptance criteria and any deviations from it.
- A drawing of the space with every logger’s position and height.
- Logger list with serial numbers and calibration certificates.
- Results per logger, graphs over time, and the hot and cold spots.
- Events during the study: door openings, defrosts, power or HVAC faults.
- Conclusions: is the space fit for its range, where must stock not go, and where the permanent probes go.
- When the study must be repeated.
After the study: continuous monitoring on a map
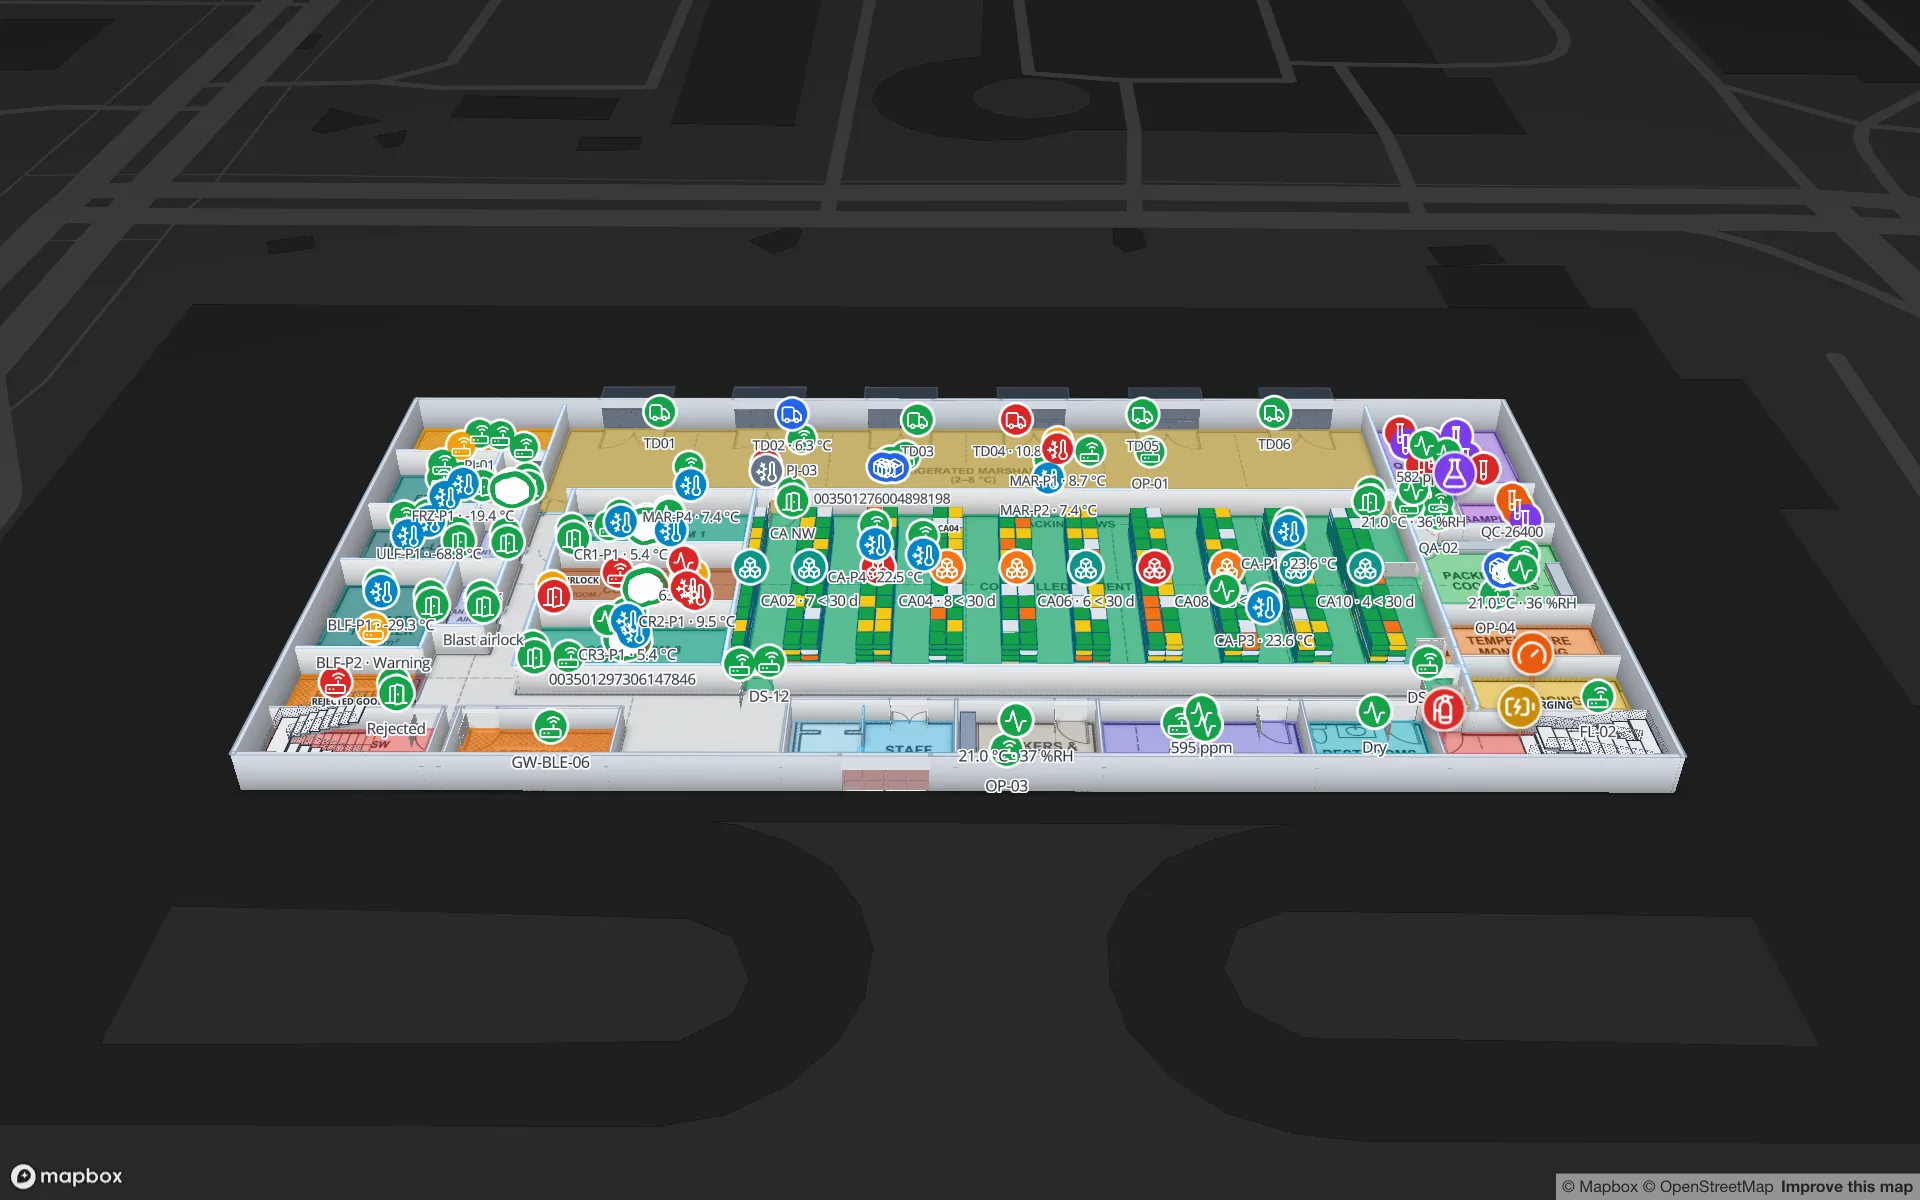
Once the permanent probes are in place, the question becomes “is everything in range now, and can we prove it was?”. That is the job of warehouse temperature monitoring, and a floor plan helps because a reading means more next to the door, rack or vent that causes it. In Spatial Map:
- Probes on the plan — readings arrive in a sensor table through its write API, a scheduled pull from your sensor vendor’s REST API, or a file upload. Each probe sits where the mapping report put it, by coordinates or by the name of its zone.
- Colours you define — style rules colour each probe or room by its reading, so a drifting cold room shows amber before it turns red.
- Alerts in the app — a rule such as “temperature above 8 °C for 15 minutes” or “not updated for 30 minutes” raises an alert with a severity, in the bell, a pop-up and the Alerts page, and closes itself when the reading is back to normal. See alerts on a floor plan.
- History for audits — every write to a row is kept in its history, and reports export to PDF, Excel, CSV or JSON.
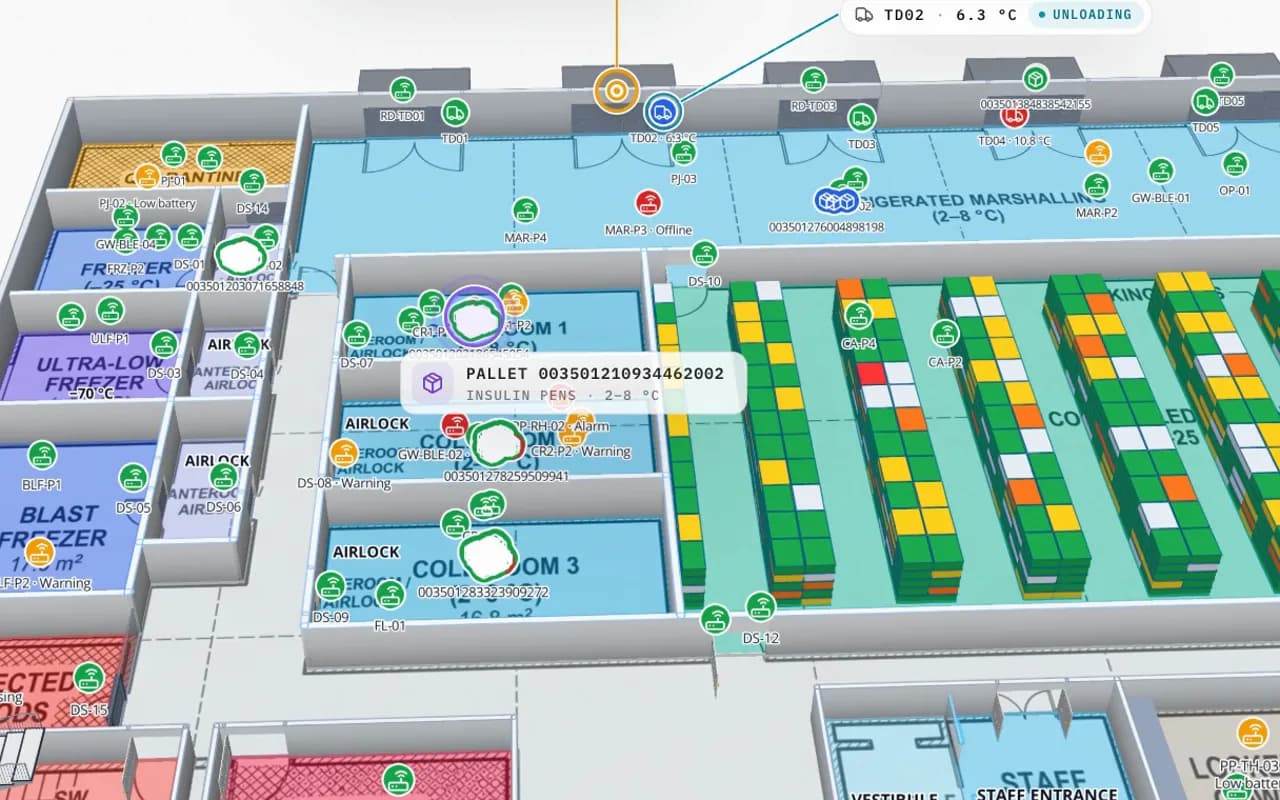
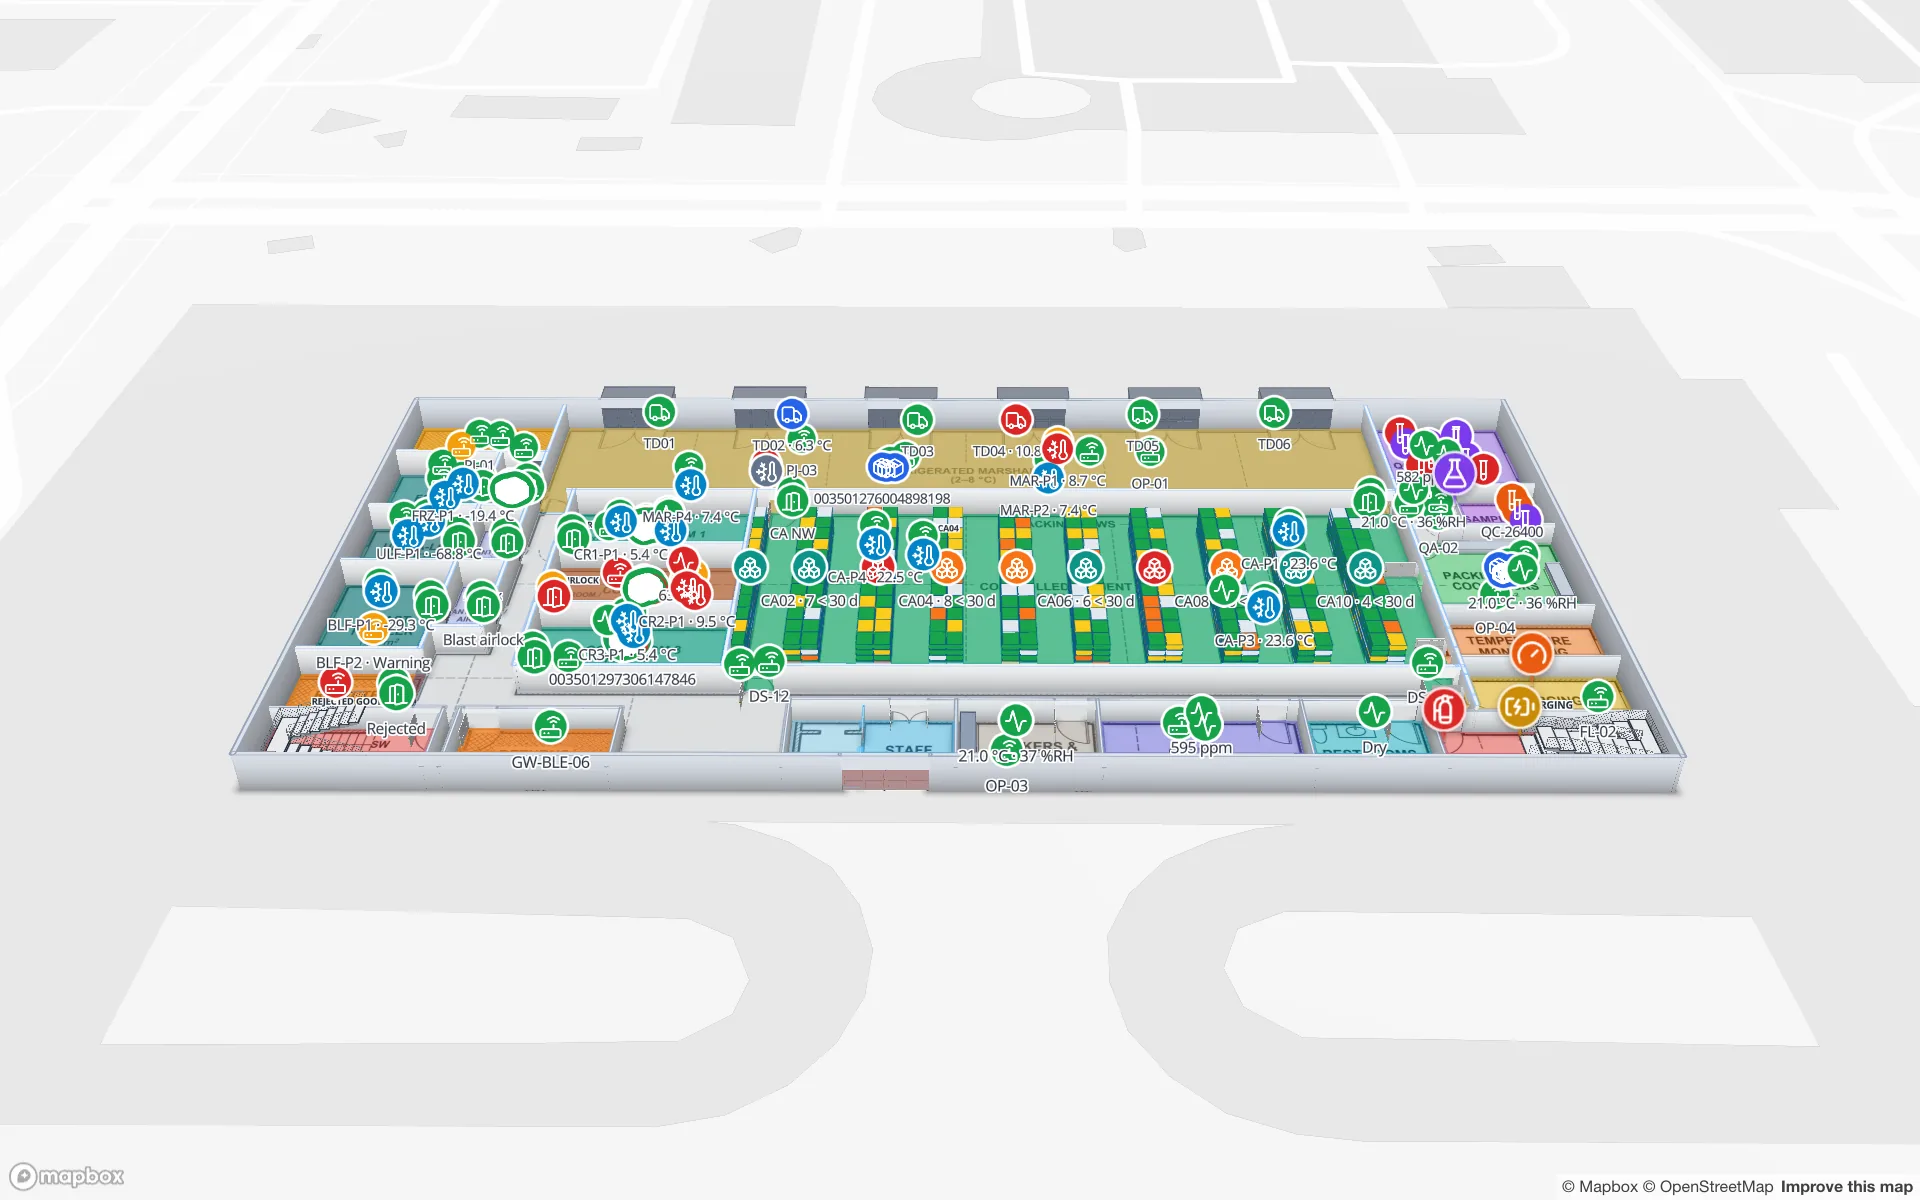
The Polar Pharma demo shows this end to end: temperature zones tinted from their probes, door sensors on the cold rooms, and reports for zones, excursions, and probes and mapping.
When to map again
- On the schedule your risk assessment sets, and at the seasonal extremes for ambient space.
- After a change to racking, insulation, doors, HVAC or refrigeration.
- When a storage area changes use — for example from general stock to temperature-sensitive products.
- When monitoring keeps showing excursions in a place the last study called safe.
Monitoring data is a good early warning here: if the same probe drifts every afternoon, that is a reason to remap before the next scheduled study. For the wider cold-chain picture, read pharma cold storage monitoring and QC holds.
Try the platform your data belongs on.
Spatial Map turns spreadsheets, sensor streams, and CAD drawings into one live 3D facility view — nothing to install, seven-day free trial.
Keep reading
- Deep-diveAzure Maps Creator is retired: what it means and your optionsMicrosoft retired Azure Maps Creator on 30 September 2025 and deleted its indoor data. What Creator did, what you can still rebuild from, and how to choose where to move.
- Deep-diveHow accurate are BLE beacons? Four methods, and why results varyFrom room-level to sub-metre: BLE accuracy depends on the method, the building and the update rate. The four methods, what affects them and seven questions for vendors.
- Deep-diveDoes GPS work indoors? Why it fails and what works insteadGPS barely works inside buildings: the signals are too weak and bounce off everything. Here is why, how indoor positioning options compare, and why each one still needs an indoor map.