Indoor mapping · Data centers

Data center asset tracking map: halls, cages, cabinets and what is in them

Spatial Map is a data center asset tracking map: data halls, cages and cabinet rows drawn in 3D from your floor plan, IT assets and spares tied to the cabinet or store they sit in, RFID reads at the doors, and temperature and humidity sensors in the aisles — one live map for operations, security and facilities.

Last updated:

No credit card. Runs in the browser. Pro is $60/month for up to 4 facilities. Book a demo

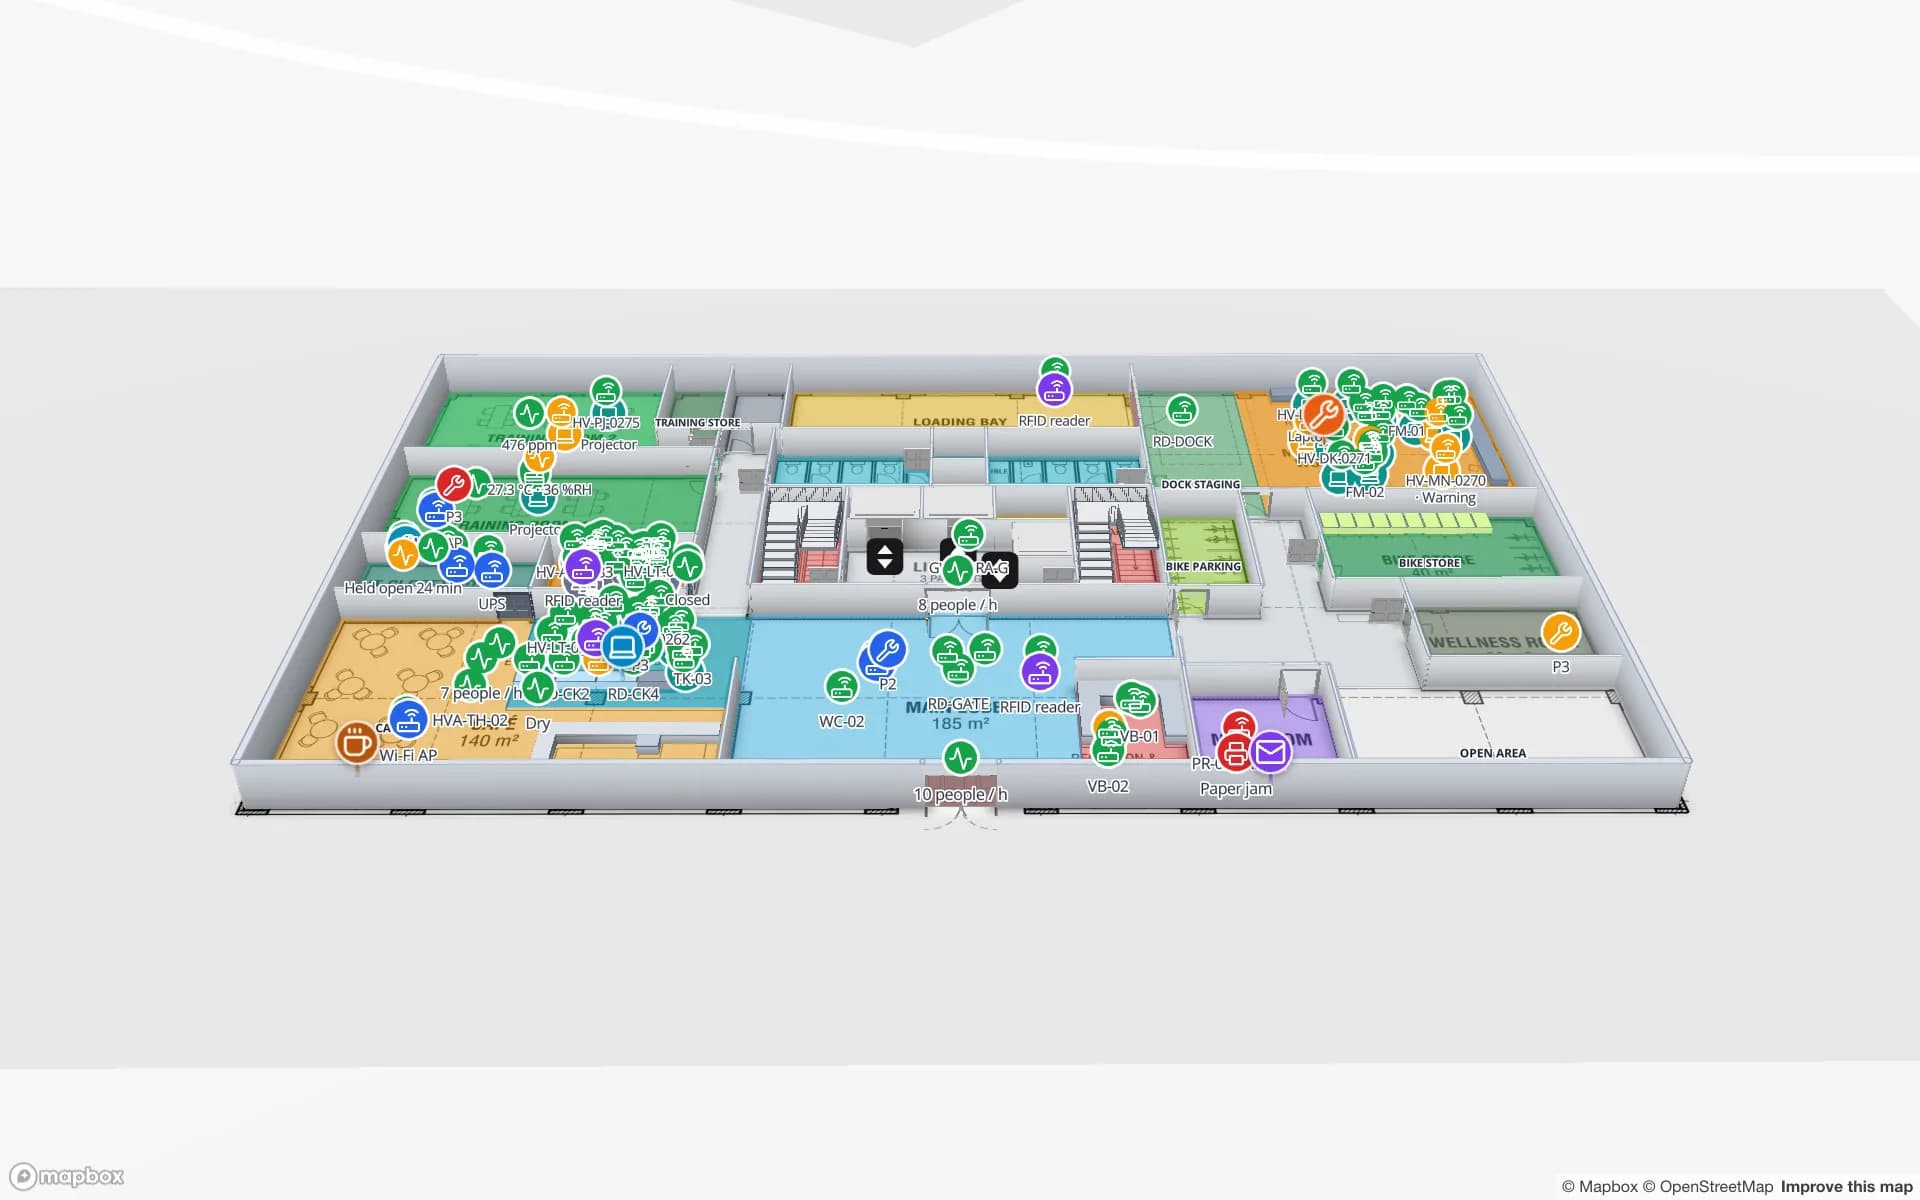
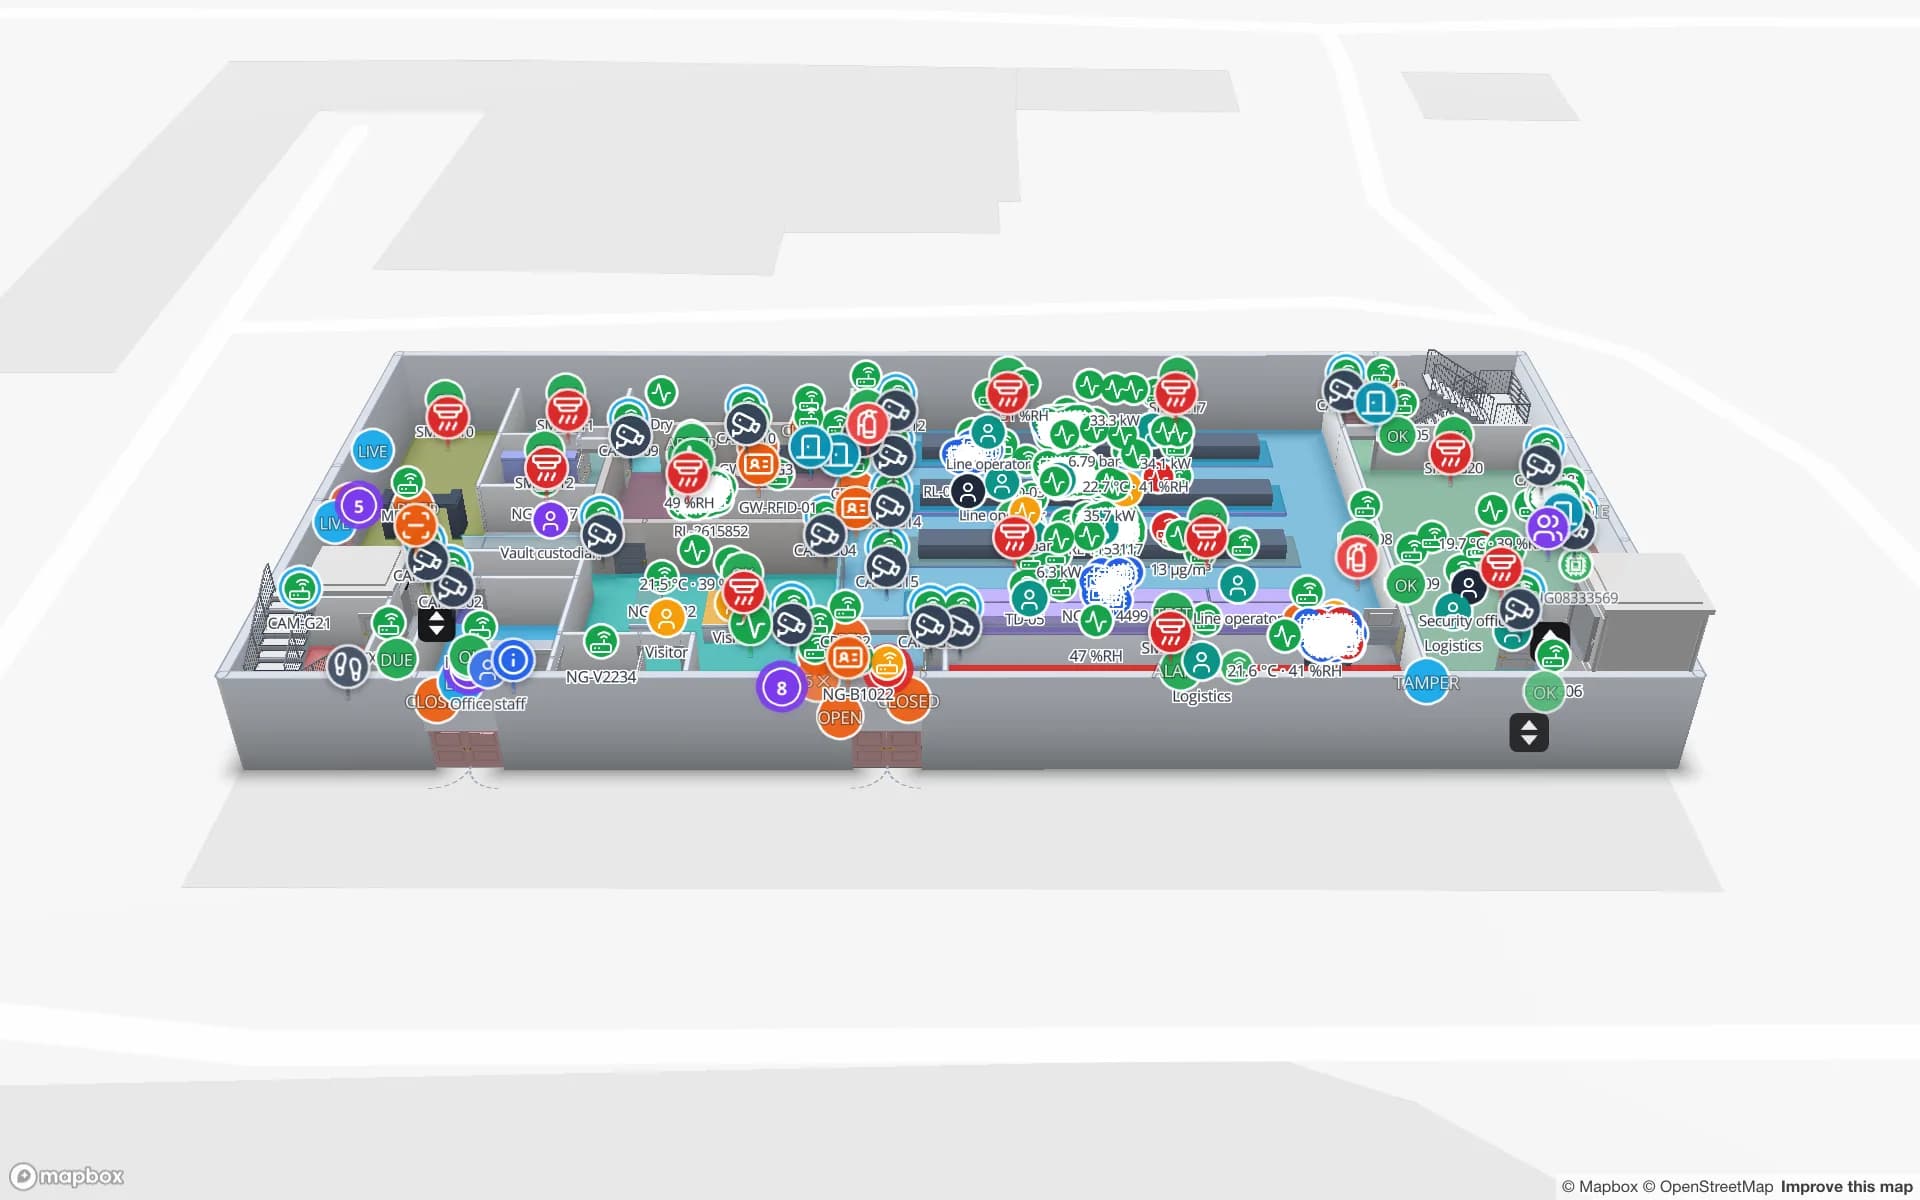
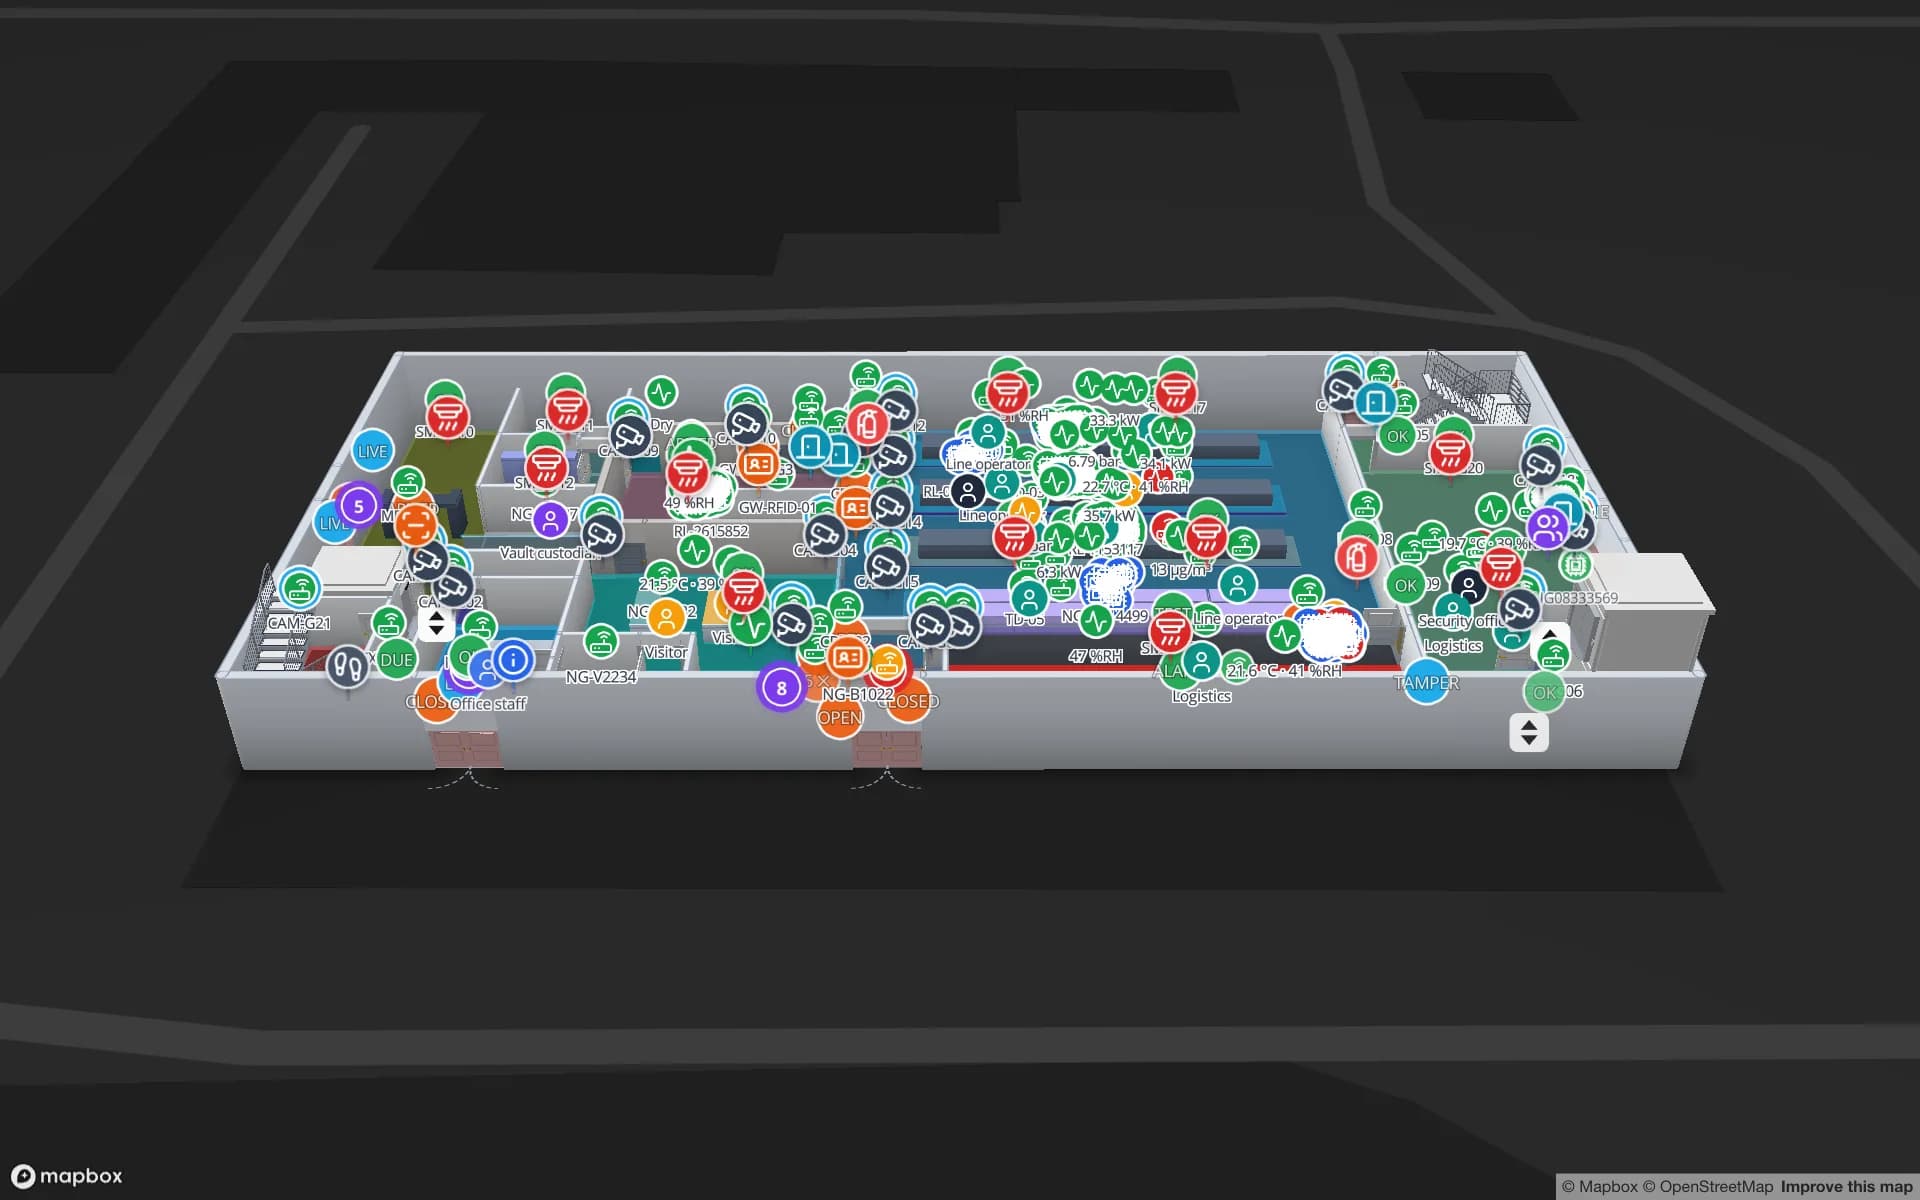
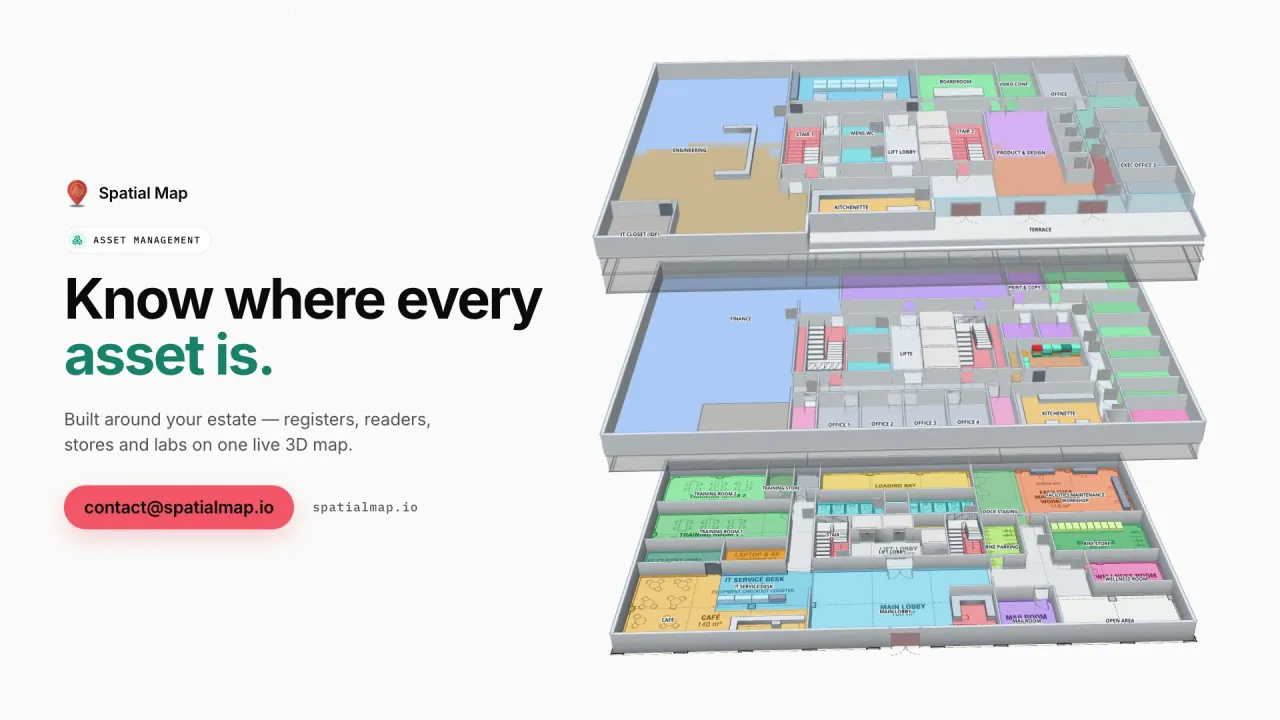
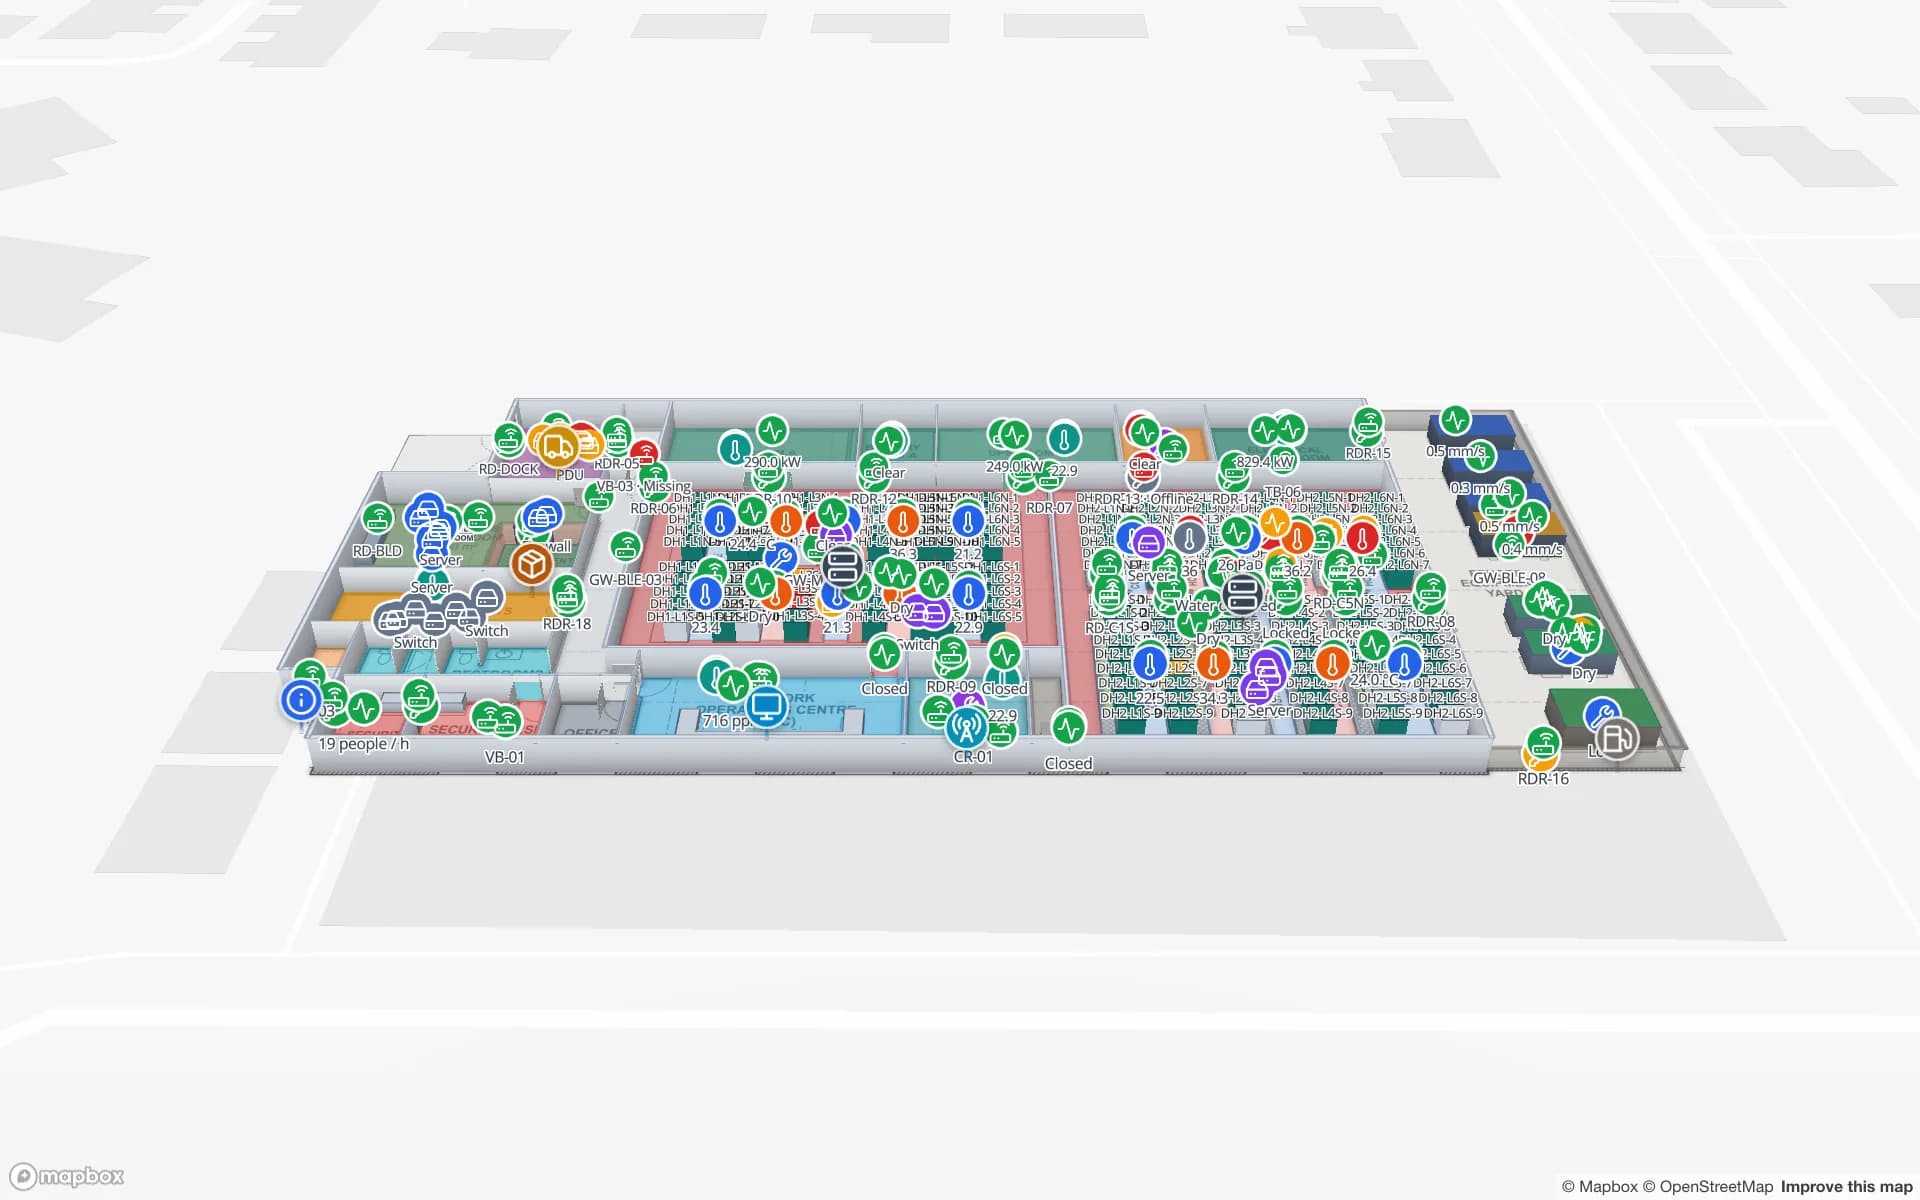
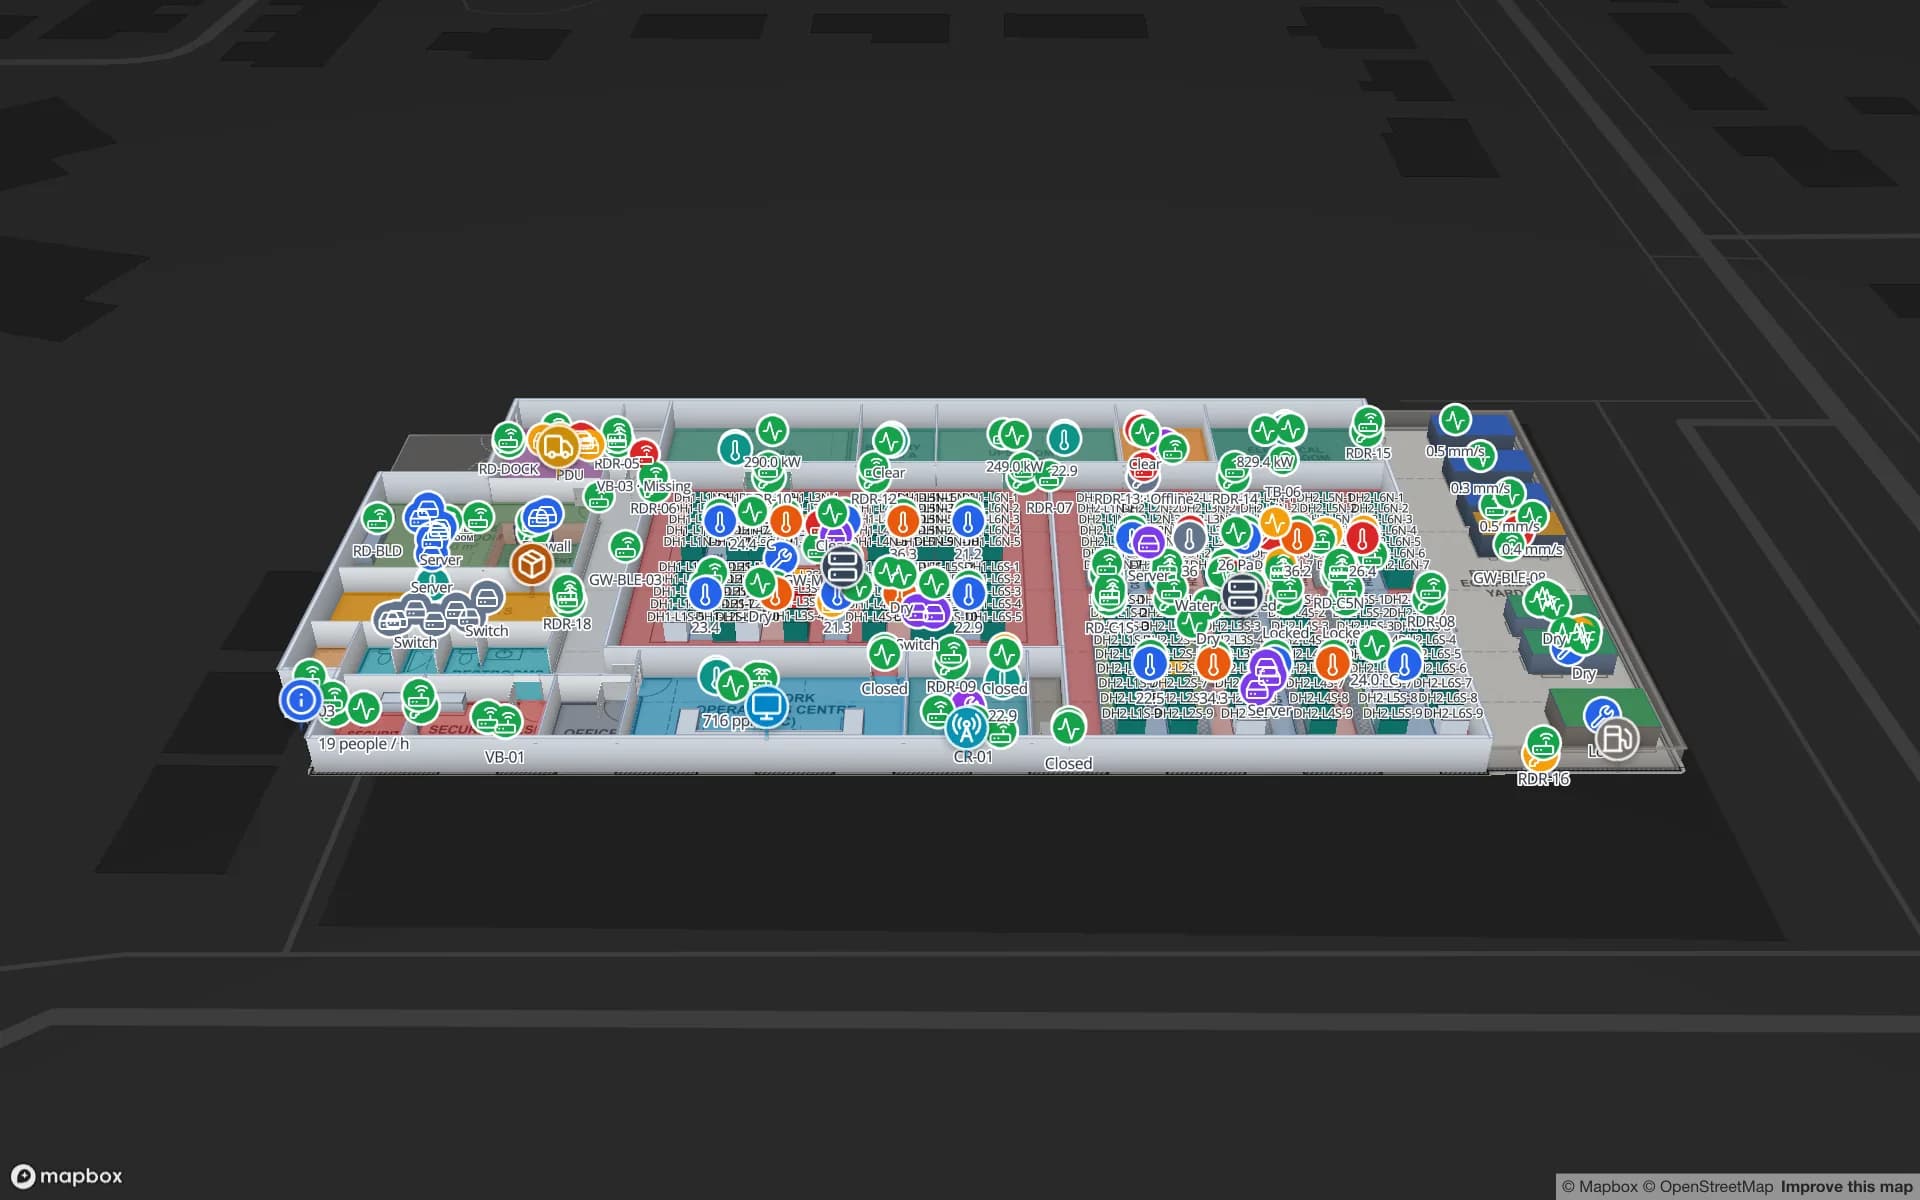
Ridgeline Data Center, a data center demo, in the Spatial Map 3D viewer with live device markers
Ridgeline Data Center
Ridgeline Data Center (demo) in the live viewer: data halls with rows of cabinets, plant rooms and live sensor and asset markers.
Cabinet rows drawn as racks in the Ridgeline demo
24
Tables in the same demo: cabinets, IT assets, readings, spares, changes
22
Reports on that one facility
19
Free trial, no credit card
7 days

Halls, cages and cabinets as a map

Cabinet lists live in spreadsheets and DCIM tools; what they rarely show is the floor. On the map, each element of the data hall is a shape named the way your register names it:

  • Data halls and cages — areas with their customer, contracted power or security zone.
  • Cabinet rows — drawn with the Rack tool, so each cabinet is a cell that its own record can bind to.
  • Power and cooling plant — UPS, switchgear and chiller rooms as named rooms.
  • Stores — spares stores, with their stock levels.
  • Doors with readers — data-hall doors and the loading dock.
IT assets and spares by cabinet

An IT asset table — servers, switches, storage — matches each row to its cabinet by code, so a click on a cabinet opens the assets inside it with their register record. Spares are rows per store: when power supplies or drives run low, the store changes colour. The Ridgeline demo keeps cabinets, IT assets, environment readings, spare parts stock and changes in their own tables.

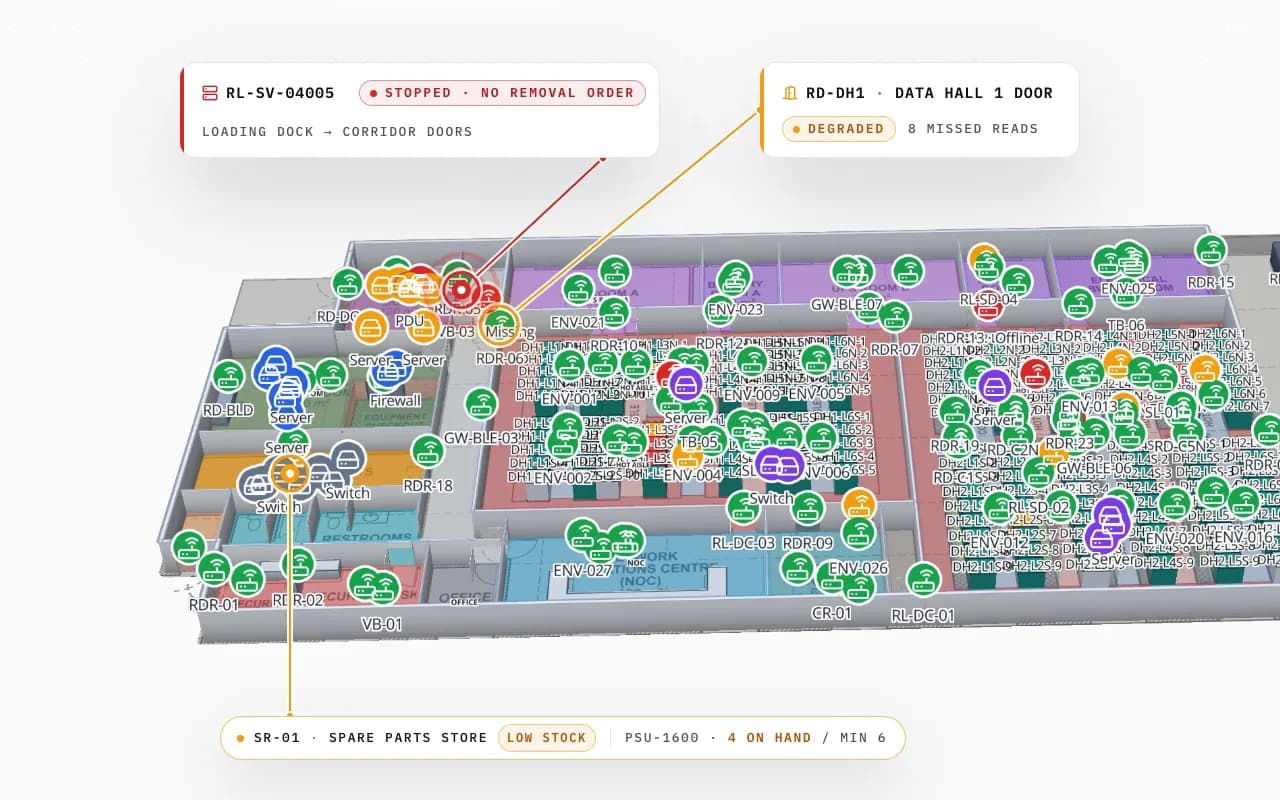
Ridgeline Data Center in 3D with hundreds of tagged servers and devices; a server read at the loading-dock door without a removal order is called out, with a degraded door reader and a low-stock spare-parts store
Ridgeline Data Center
Ridgeline Data Center (demo): a server read at the loading-dock door without a removal order, a data-hall door reader with missed reads and a spare-parts store running low.

RFID audits and removal at the doors

With RFID tags on equipment, a handheld sweep down each cabinet row confirms what is there, and fixed readers at the data-hall and loading-dock doors catch kit on its way out. The map shows a server read at the dock without a removal order at that door, not as a line in a log. Tag placement matters in metal cabinets; see RFID tags for metal.

The audit workflow itself — expected, found, missing, unexpected, room by room — is covered on RFID IT asset audit.

Temperature, humidity and plant

Environment sensors in hot and cold aisles colour the aisle or cabinet row they measure, and a heatmap layer shows where the warm spots gather, with heat that stops at walls. Plant readings from power and cooling sit in their rooms, and every reading is kept in the row history for later.

Spatial Map shows the readings your sensors and BMS report. It does not model airflow or control the cooling; a CFD tool or your BMS does that.

Alerts and reports

Alert rules on any table flag what needs attention: an aisle over its temperature limit for ten minutes, a sensor that has stopped reporting, a spares store below its minimum, an asset read at a door with no removal order. Alerts appear in the app, with Show on map, and resolve themselves when the reading is back to normal.

The Ridgeline demo carries reports such as Halls, Cages & Cabinet Capacity, Cooling & Environment, Power & Cooling Plant, IT Assets & Checkout, Security & Access, Spares & Logistics, and Maintenance & Change — exported to PDF, Excel, CSV or JSON.

Asset register vs DCIM vs data center map

They work together; this is what each one is good at.

Asset register / spreadsheetDCIM toolSpatial Map
Halls, cages and cabinets in placeAs rowsUsuallyYes, in 3D on the floor plan
Rack elevations, U positions, cablingSometimes as columnsIts core jobNo — a U position is a field you can show
RFID reads and door eventsNoVariesYes, from your readers
Shareable read-only viewsFile copiesVariesShare links with expiry and view caps
How Spatial Map does it

A data center map in four steps

  1. 01

    Import the hall plan

    A PDF or DWG of each hall at real scale, pinned to the site.

  2. 02

    Draw halls, cages and cabinet rows

    Areas, racks and doors named like your register or DCIM.

  3. 03

    Connect register, readers and sensors

    Upload or poll the register; readers and gateways post rows with the write API.

  4. 04

    Set alerts and reports

    Temperature limits, silent sensors, low spares and door exceptions.

Data center and IT maps in the demo workspace

Data hall

Cabinets, cages, environment, spares and removal at the doors.

Office IT estate

Laptops, monitors and AV kit by room across three floors.

Secure cages

High-value units followed reader by reader to the cage gate.

See it on real demo facilities

Fictional names, real floor plans, live sensors, RFID, BLE tags and gateways — open any of them in the browser.

All 13 demo facilities

Data center asset tracking map — frequently asked questions

No. Spatial Map places cabinets, assets, readers and sensors on a 3D floor plan and reports on them. Rack elevations, cabling and power-chain modelling stay in your DCIM; its data can be shown on the map.

As a field on the asset record, shown in the detail drawer. The map places assets by cabinet; it does not draw rack elevations.

Usually handheld sweeps row by row for audits, plus fixed readers at data-hall and loading-dock doors for removals. The handheld vs fixed reader guide compares them.

From your sensors, gateways or BMS, as rows posted to a table or polled from a REST endpoint. Spatial Map does not supply sensors.

Yes, in the app: a rule such as “temperature above the limit for 10 minutes” raises an alert with Show on map. There is no email, SMS or push, and Spatial Map does not control the cooling.

A 7-day free trial covers up to 5 facilities with no credit card. Pro is $60 a month or $600 a year for up to 4 facilities. Done-for-you mapping and integrations are quoted as custom services.

Put your data hall on a live map.

Start a free trial and open the Ridgeline demo, or send us your hall plans and register and we will map them for you.