Gothenburg · Port, Halvorsäng and the supply plants

RFID tracking in Gothenburg, from the rail shuttle to the line-side rack

Spatial Map puts RFID reads on a live 3D map of the building where they happen, so a tag read at a dock door becomes a pallet in a lane, a returnable rack at a line or a carton in a container. RFID tracking in Gothenburg starts at the port, where goods arrive by sea and leave by rail and truck within hours, and carries on into the distribution centres and supply plants behind it. Your readers and middleware do the reading; Spatial Map shows each read in place.

No credit card. Runs in the browser. Pro is $60/month for up to 4 facilities. Book a demo

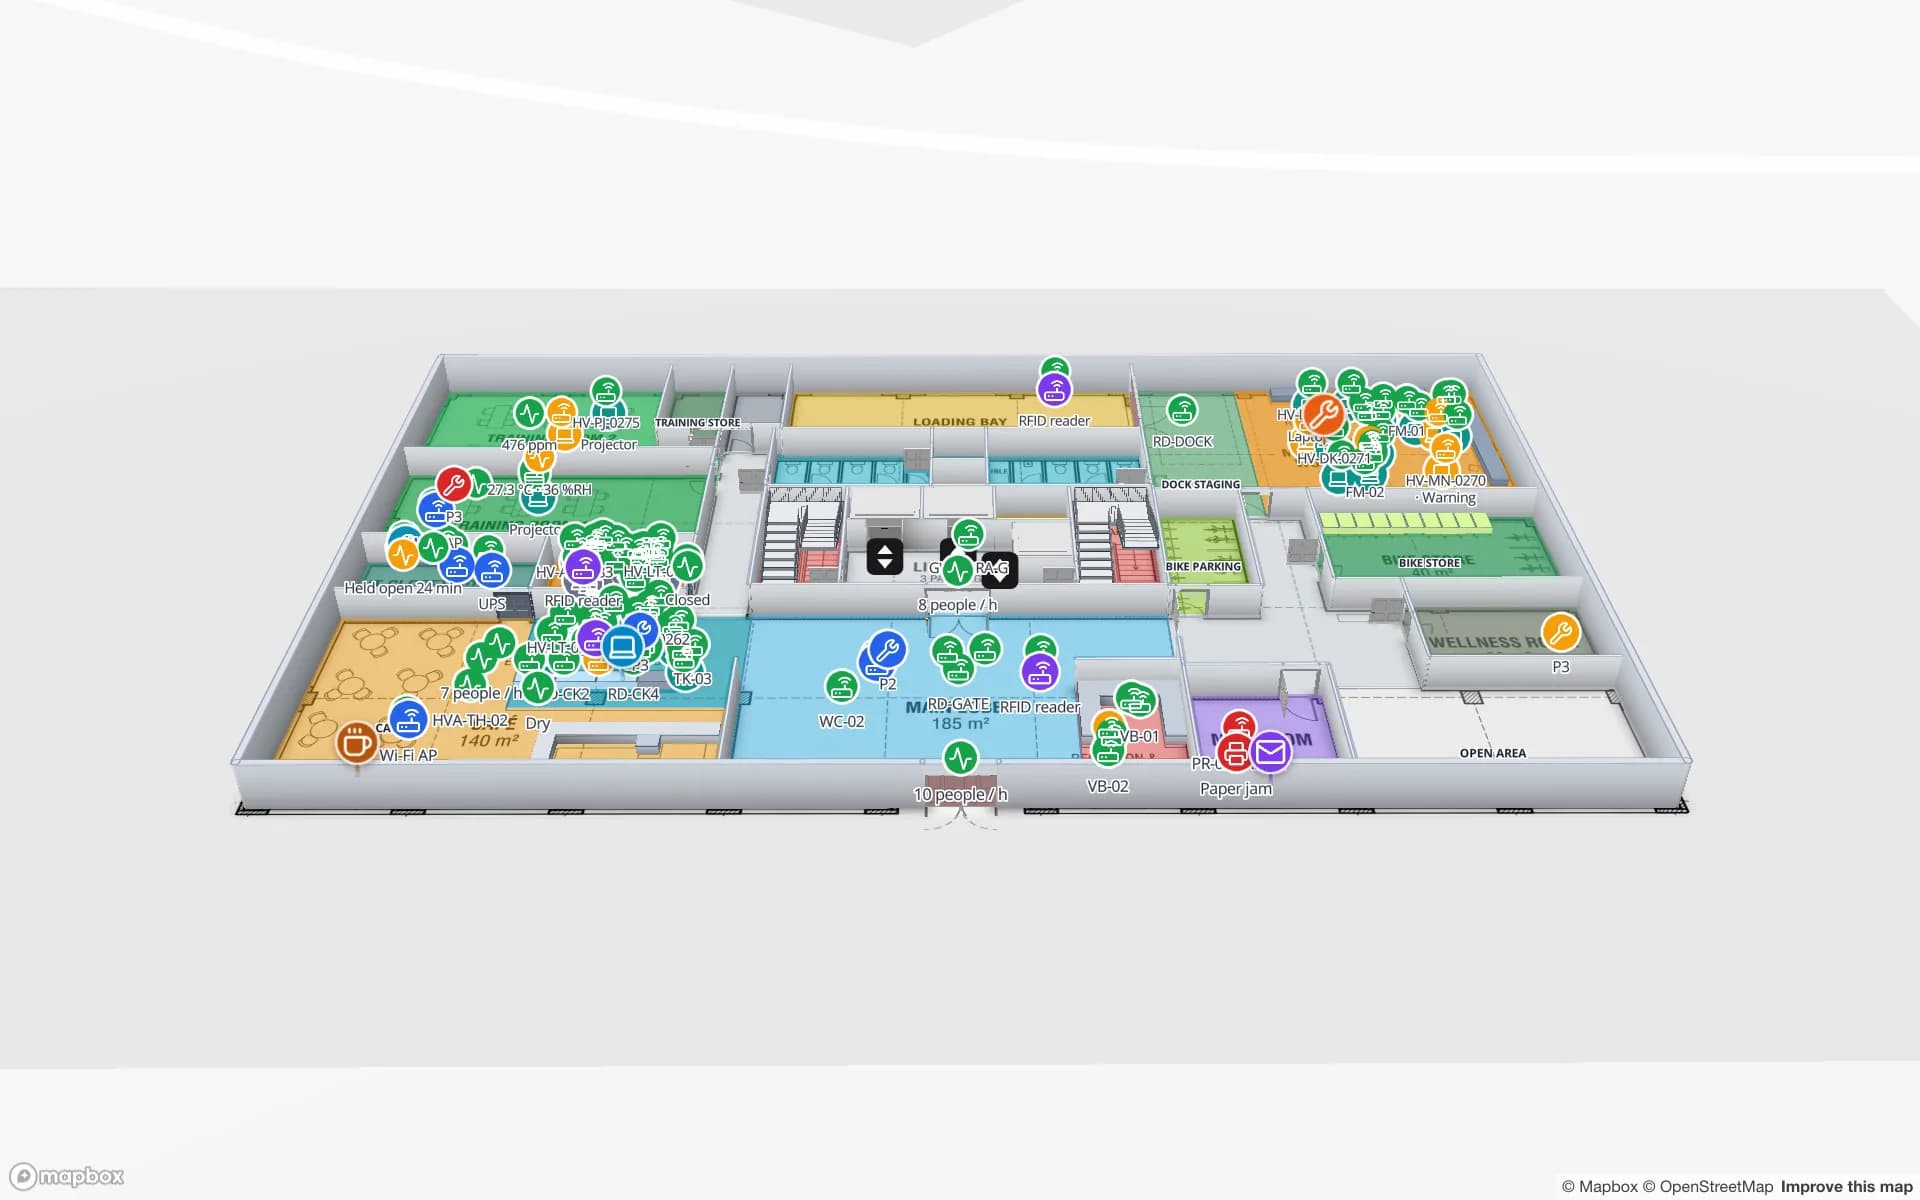
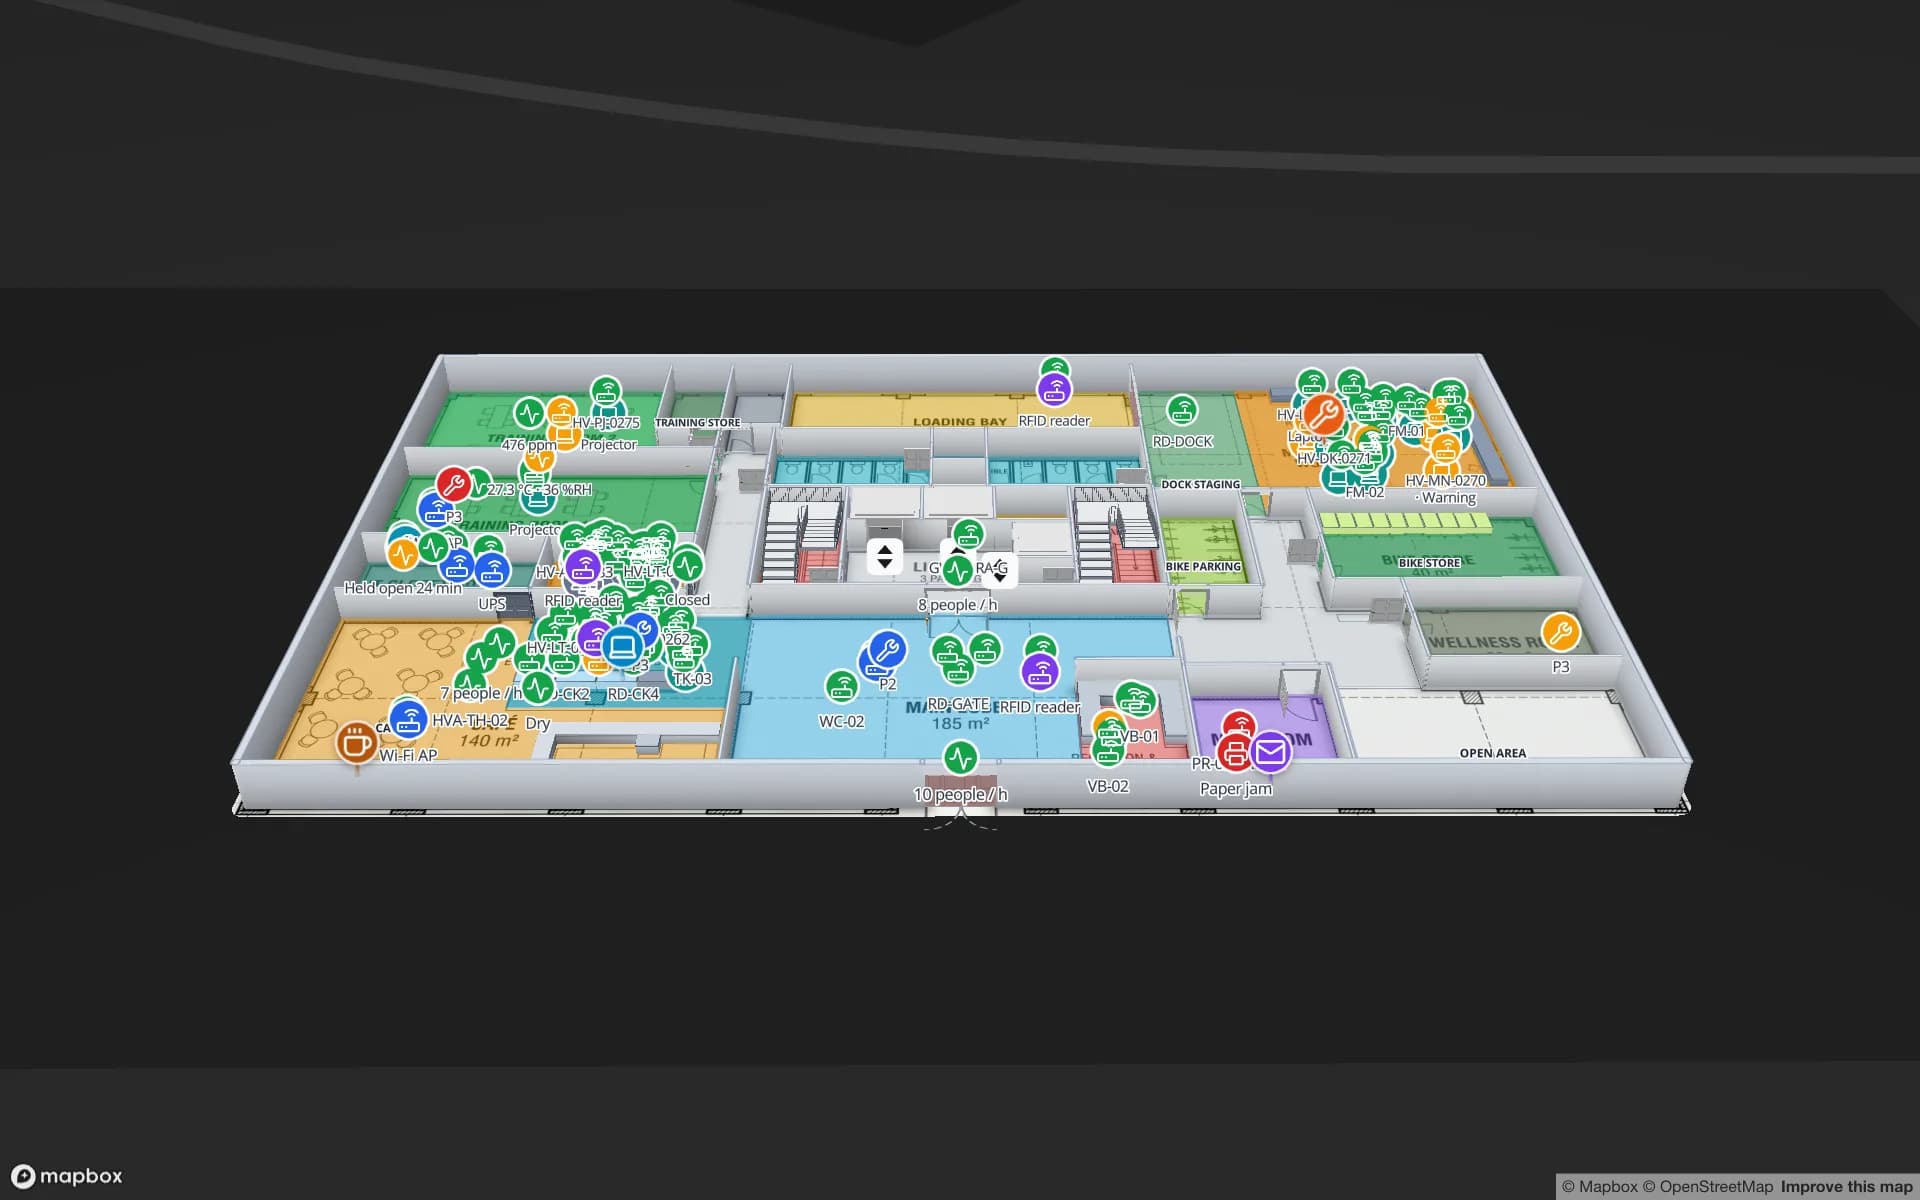
Summit Assembly Plant, a assembly plant demo, in the Spatial Map 3D viewer with live device markers
Summit Assembly Plant
Summit Assembly Plant, a demo assembly plant: lines and workstations, WIP carrier tags read between stations, and 867 raw-material and finished-goods rack locations.
Rack locations in the Summit assembly-plant demo
867
Dock doors in the Eastport cross-dock demo
50
RFID pallets moving through Eastport
1,180
Free trial, up to 5 facilities, no card
7 days

A port that sends goods on by rail

The Port of Gothenburg calls itself the biggest container port in Scandinavia and says about 57 % of Sweden’s container trade passes through it, split about evenly between exports and imports. Its own figures describe daily rail traffic of 70 trains arriving and departing, serving 26 inland terminals on 33 routes across Sweden and Norway, and trucks that reach Oslo and Copenhagen within three to four hours. For 2025 the port reported a record 934,000 TEU, 251,000 vehicles and 525,000 ro-ro units, with 529,000 TEU moved by rail.

For a warehouse behind those gates, a pallet’s life is short and its next move is fixed by a train or a trailer. RFID portals at the dock doors read each pallet as it enters, a reader at the staging lane confirms it is with the right departure, and the map shows what is staged, what is late and what already left. The Eastport demo shows 50 dock doors, 44 yard slots and 1,180 RFID pallets on one map, and the RFID gates page explains where to put readers. Spatial Map does not connect to port, rail or customs systems; it shows what your own reads say.


Halvorsäng and the rail-served logistics parks

The port also builds warehouse space of its own. The Port of Gothenburg Logistics Park at Halvorsäng sits on the port’s land and, in the port’s words, is being developed as a strategic hub for electrified transport flows and future-ready logistics: an area of 270,000 square metres with a construction area of 145,000 square metres, on a railway served by 70 freight trains every day, 25 of them dedicated to containers.

New multi-tenant sheds like these open with fresh drawings and several customers under one roof. Give each building its own facility, draw bays and lanes from the architect’s PDF or DWG, and let a person review what AI Map drafts. Reads from different customers can go into separate tables, and a read-only share link lets one customer see only its own floor or layer. Where stock is held for others, the RFID inventory management page and stock counting cover how counts are taken.

Vehicle supply: returnable racks, carriers and line-side stock

Business Region Göteborg, the city’s economic-development agency, describes the region as a major automotive and mobility hub, and West Sweden has plenty of plants that deliver in tight windows, often in returnable packaging that must come back. For a supplier the question is rarely the part. It is where the empty rack is, which sequence carrier is stuck at the wrong line and how many returnables a customer still holds.

Tag the racks and carriers, read them at the dock and the line-side buffer, and draw each line as an area. The map shows empties by location, a style rule colours carriers over their return date, and an alert rule “not updated for N minutes” raises an in-app alert when a reader stops reporting. The Summit demo shows WIP carrier tags read between stations and 867 rack locations. Tags on metal behave differently from tags on cartons, so test them in your own plant; the post on RFID tags for metal, liquids and apparel lists what to check.

Where RFID is the wrong tool: car yards and open ro-ro lanes

Not everything at a port is a candidate. The port handled 251,000 vehicles in 2025, and a field of parked cars or a ro-ro lane of trailers is the pattern for yard systems, scanning and gate data rather than UHF tags read at a door. Spatial Map can draw the yard and take rows from your terminal or gate system through the write API, so slots and trailers are coloured by status, but it does not replace those systems.

RFID earns its place where the unit is a pallet, a carton, a returnable rack or a tool and the read point is a door, a portal or a handheld walk-through: the RFID warehouse management page and the handheld, fixed reader and gate comparison help pick between them.

Services for teams in Gothenburg

Where Gothenburg teams usually start depends on the building:

  • Port-side warehouses and forwarders begin with inventory tracking at dock doors, because a pallet missing at a train cut-off costs a whole shuttle slot.
  • Supply plants begin with asset tracking for returnable racks, carriers and tools, then add stock by bin.
  • RTLS and UWB matters for large yards and plants where trucks and trolleys must be located continuously; most buildings will not need it first.
  • If you have no readers, antennas or tags yet, our team can source them on request, quoted per project, with warranty and device support from the manufacturer: see hardware and demo kits on request.
  • Android RFID handheld apps, ERP and WMS integrations and other custom software are built as client projects; the product runs as cloud or on-premises.

Also served nearby

The same approach covers Hisingen and Torslanda, Mölndal and Partille, Kungälv and the Landvetter area, and Borås inland. Nothing needs installing at any of them: the map opens in a browser.

How Spatial Map does it

From the dock door to the line-side rack

  1. 01

    Pick one flow

    Inbound pallets at one dock, or returnable racks between one supplier and one customer — wherever a missing unit costs most.

  2. 02

    Map doors, lanes and lines

    Upload the plan, align it, let AI Map draft the floor, and name read points the way your middleware names them.

  3. 03

    Connect reads and stock

    RFID middleware and your WMS post rows through the table write API, a polled REST endpoint or CSV and Excel uploads.

  4. 04

    Add silence and overdue rules

    In-app alerts for pallets staged too long, returnables past their due date and readers that stopped reporting.

What Gothenburg teams track

Port-side cross-docks

Dock doors, yard slots and pallets staged for the right train or trailer.

Returnable racks and carriers

Where each empty is, which line holds it, and which are overdue for return.

Distribution centres

Rack-level stock, pick modules and staging lanes in front of the docks.

Tools and equipment at plants

Check-out, last-seen store and overdue items coloured on the plan.

See it on real demo facilities

Fictional names, real floor plans, live sensors, RFID, BLE tags and gateways — open any of them in the browser.

All 13 demo facilities

RFID tracking in Gothenburg — questions we get

No. It has no link to port, terminal, rail or customs systems. It shows what happens inside your own building from your own RFID reads, WMS and sensors, so it complements the port-level systems rather than replacing them.

Usually not the best tool. Yard slots and trailers are normally handled by gate and yard systems; Spatial Map can draw the yard and colour slots from the rows those systems send, but UHF RFID fits pallets, cartons and returnable racks read at a door far better.

Yes, within limits. Keep each customer’s reads in a separate table and give them a read-only share link limited to chosen layers and one floor, with an expiry date. Roles control who in your own team can edit.

Yes. Your developers can push rows through the write API (HTTPS, bearer API key, bulk upsert, 60 requests per minute per key), or expose a REST endpoint that Spatial Map polls. Our team also does integrations as client projects.

No. Spatial Map is sold online and our team works with customers in Sweden remotely, by video call and through the contact form. There are no local resellers or partners.

In US dollars, the same worldwide: a 7-day free trial for up to 5 facilities with no card, then Pro at $60 a month or $600 a year for up to 4 facilities. RFID hardware, if you ask us to source it, is quoted per project and is not part of the subscription.

Map one Gothenburg dock before the next shuttle.

Start the free trial and open the Eastport demo, or send us the plan of a port-side warehouse or a supply plant and a sample of your reads through the contact form.