Porto · Leixões, the footwear belt and the northern textile industry

Inventory tracking in Porto, from the quay at Leixões to the despatch bay

Spatial Map shows stock on a live 3D map of the building that holds it: racks coloured by quantity, cartons read at the dock door, held lots marked where they stand, fed by the WMS, readers and sensors you already run. Inventory tracking in Porto means a port on its doorstep, a footwear industry that exports almost everything it makes, and textile and clothing chains that pass work between many small factories. One workspace holds each building as its own facility.

No credit card. Runs in the browser. Pro is $60/month for up to 4 facilities. Book a demo

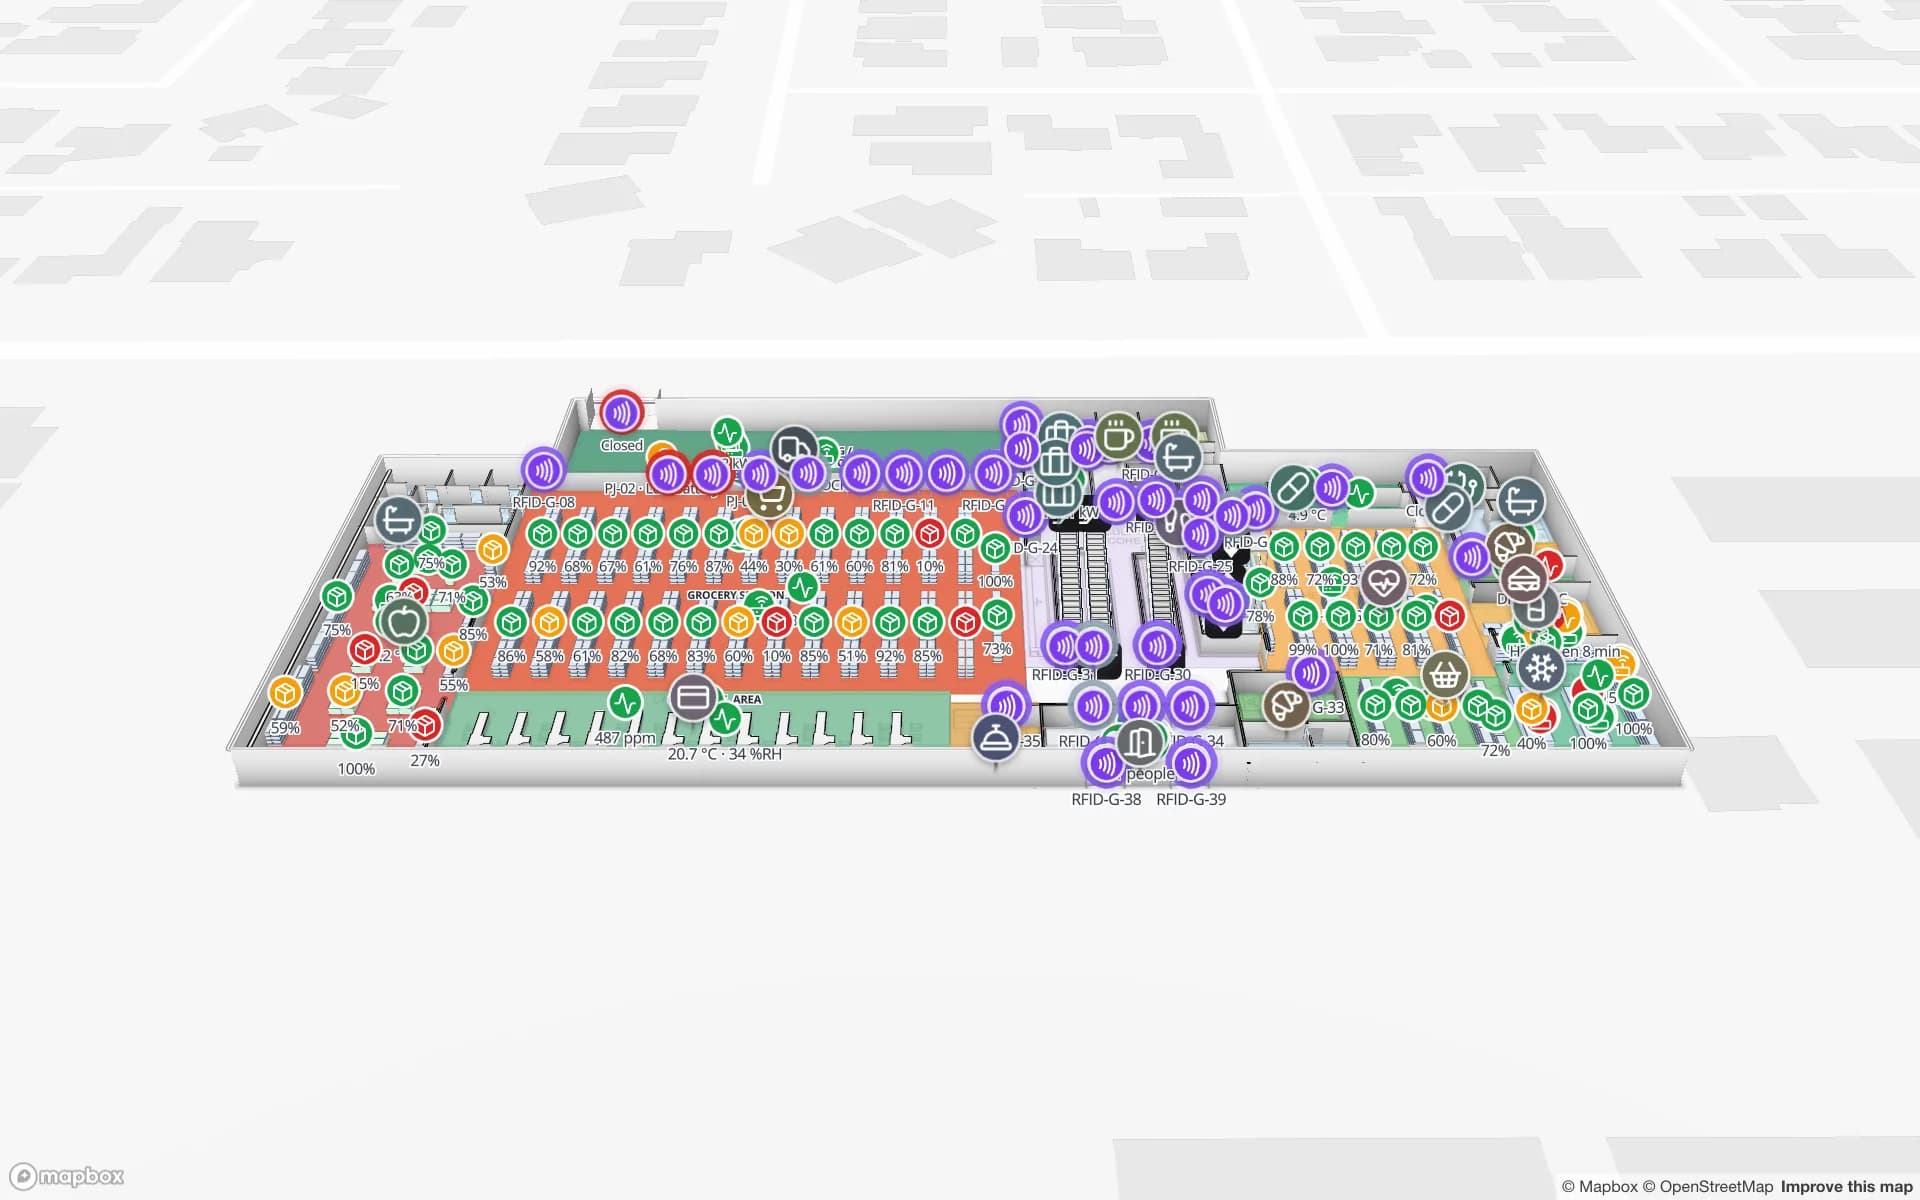
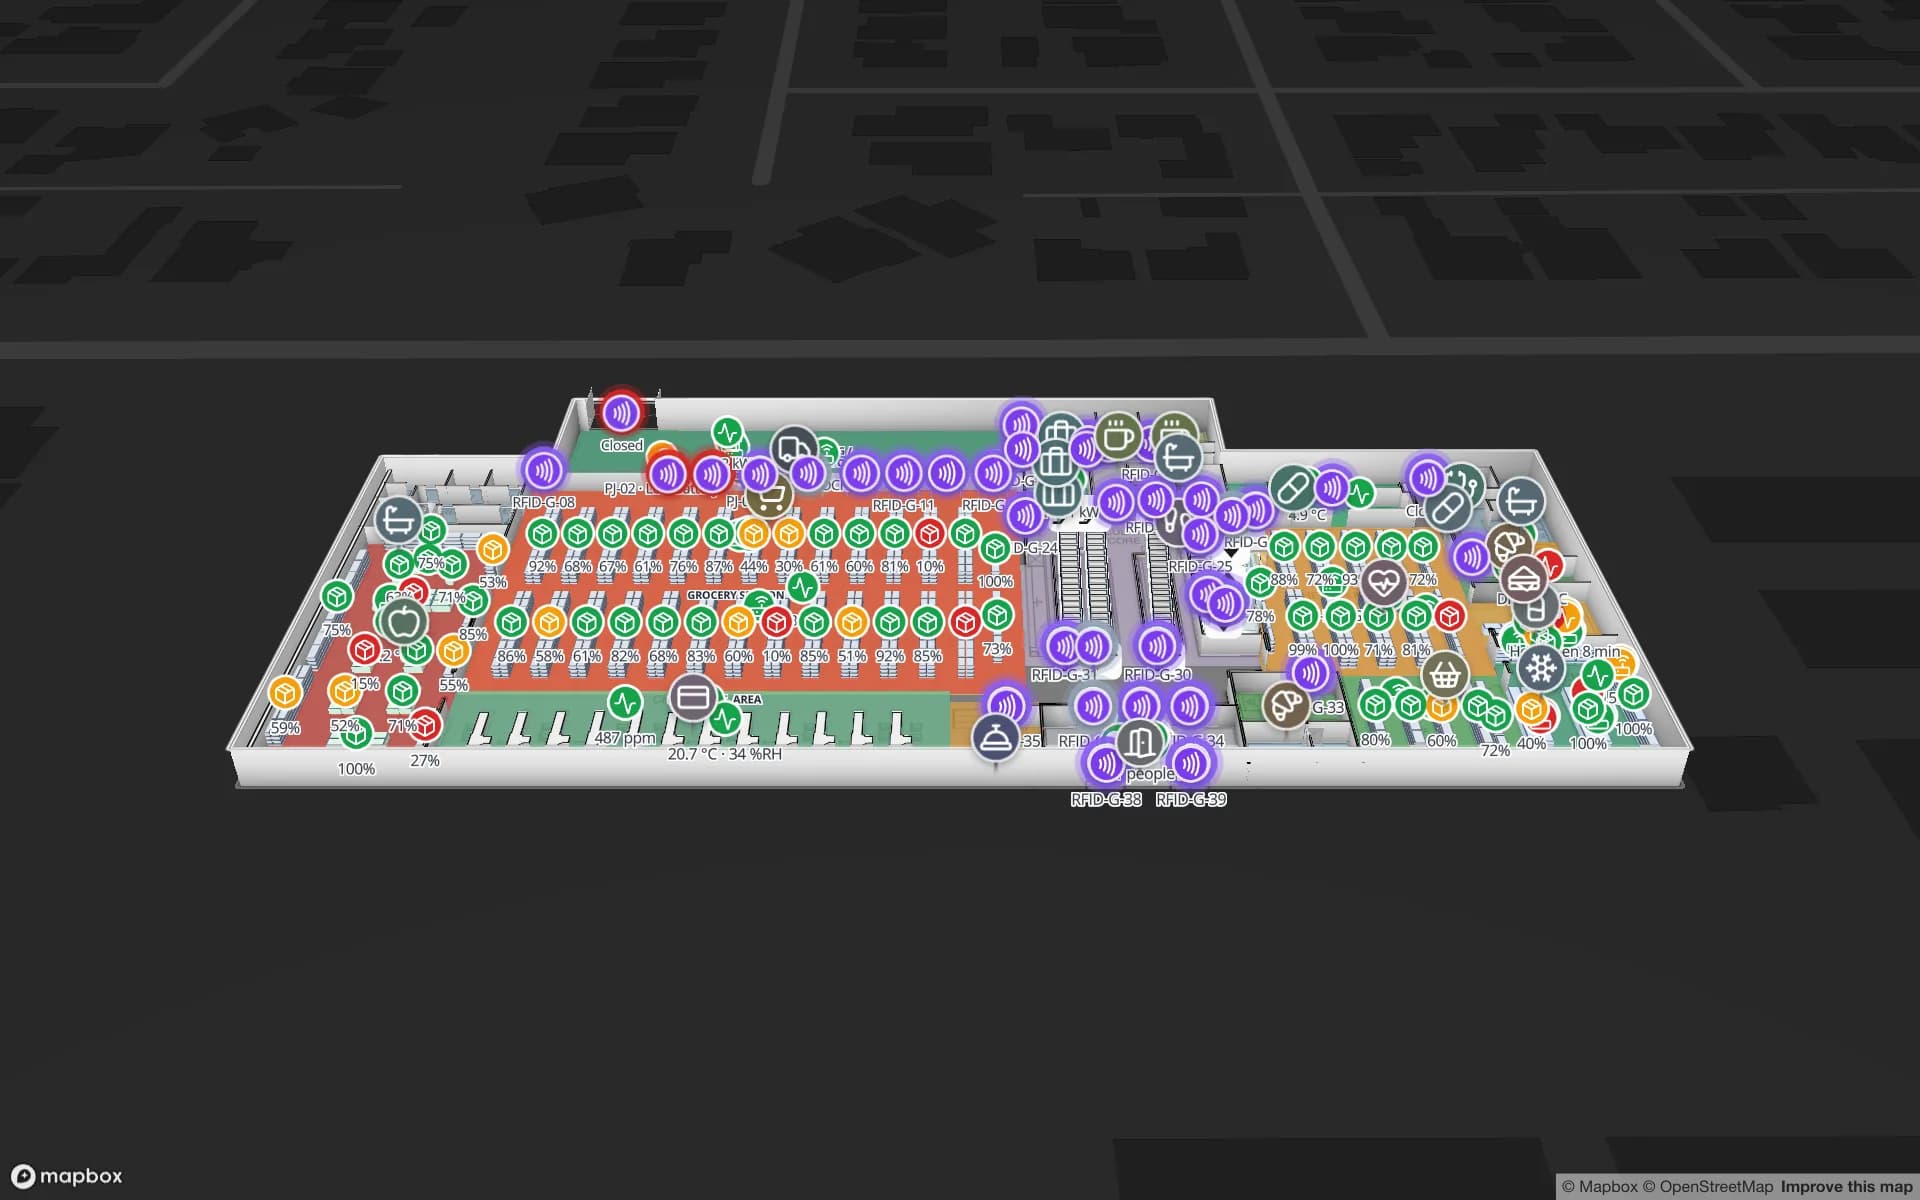
Crestline Fulfillment Center, a fulfillment center demo, in the Spatial Map 3D viewer with live device markers
Crestline Fulfillment Center
Crestline Fulfillment Center, a demo warehouse: 20 racks with 2,204 locations, pick-to-light, packing output, staging lanes, forklifts and the trailer yard.
Rack locations in the Crestline demo warehouse
2,204
RFID WIP carriers in the Summit Assembly demo
351
Interface languages, none of them Portuguese
6
Free trial, up to 5 facilities, no card
7 days

Leixões: the northern gateway, five kilometres from the Douro

The Port of Leixões sits in Matosinhos, just north of Porto. Construction began in 1884 and the port started operating in 1886; it is described as the primary maritime gateway for the Northern Region and handles containers, bulk cargo, breakbulk and ro-ro. It has two container terminals, at Dock 1 North and Dock 4 South, cruise terminals, and a railway link through the Leixões line. A Lusa report put its 2024 cargo at about 14.4 million tonnes, 2 % less than in 2023, and the authority’s own plans include modernising the rail freight terminal.

For the warehouses and freight stations around the port, the daily question is what is where: which pallet came off which vessel, which door it is staged at and whether it is held. Draw the dock doors, lanes and yard on the plan, post rows from your WMS or RFID middleware, and every pallet appears at its last read point. The Eastport Cross-Dock demo shows 50 dock doors, 44 yard slots and 1,180 RFID pallets. Spatial Map does not connect to port or customs systems.


Footwear: styles, sizes and lots

Portuguese footwear exported about 69 million pairs in 2025, worth about EUR 1.718 billion, and around 93 % of what the industry produced was sold abroad, according to AICEP and APICCAPS data. It is the second-largest producer in Europe, and the factories of the north are where much of it is made.

Inventory in a shoe business is mostly variants. One style comes in several colours and a run of sizes, boxed, cartoned and palletised per customer order. RFID on the carton read at the despatch door makes each carton a row; the staging lane for an order shows what has arrived and what is still on the line. Cartons held back for a quality check are marked on the rack, and a count rule raises an in-app alert when a lane is short against its order. RFID stock counting shows how portals and handhelds make cycle counts quicker, and the Crestline demo shows rack-level stock with a quality-hold area.

Textiles and clothing: work passed between factories

Portugal exported EUR 5,499 million of textiles and clothing in 2025, 0.8 % less than in 2024 although volumes rose 0.3 %, according to provisional INE data reported by the ATP. A 2021 industry report put 84 % of the sector’s employment in the north.

Inventory here is rolls, cut parts and part-finished garments that travel between a weaver, a dyer, a cutter and a sewing subcontractor, so the same lot can be in four buildings in a week. Each building is a facility; a lot code on the row ties them together in a table, and a report per order shows where its parts are. The Summit Assembly demo shows WIP carriers, three lines and 867 rack locations, the same pattern for a plant that passes work down a line. Spatial Map shows what your own tables hold; it does not link the factories’ systems to each other.

A small stock room in a World Heritage old town

The Historic Centre of Oporto, with the Luiz I Bridge and the Monastery of Serra do Pilar, was inscribed by UNESCO in 1996 and covers 51 hectares, with a 186 hectare buffer zone. Shops, restaurants and hotels in a historic centre work from small stock rooms in old buildings, over several floors, with narrow stairs and no loading bay.

A map of such a stock room is small: shelves and bays by floor, with the quantity per bay from a stock table. Count with a handheld, upload the result as CSV, and the bays recolour; add a few RFID tags for the high-value lines. The Retail Mart demo shows a three-floor store with RFID readers at the doors and shelf stock by department, and retail RFID covers the general case.

Services for teams in Porto

Porto teams tend to start where the stock is most variable:

  • Manufacturers and exporters start with inventory tracking by carton, lot and rack, then RFID stock counting.
  • Freight stations and forwarders near the port start with dock doors, lanes and the yard, then add asset tracking for forklifts, roll cages and returnable pallets.
  • Larger plants that must locate vehicles continuously look at RTLS and UWB; a BlueIOT server connects directly and other engines through the write API.
  • If you have no readers or tags yet, our team can source them on request, quoted per project, with warranty and device support from the manufacturer: see RFID readers and tags and hardware and demo kits.
  • Handheld stock-take apps and ERP integrations are built as client projects, for example an RFID inventory system. The product runs as cloud or on-premises.

Also served nearby

The same page covers Matosinhos and Vila Nova de Gaia, Maia and Vila do Conde, Santa Maria da Feira and São João da Madeira to the south, and Guimarães, Braga and Vila Nova de Famalicão in the Ave and Cávado valleys. The app has no Portuguese interface; product names, lot codes and room names in Portuguese display exactly as typed.

How Spatial Map does it

From a stock list to a live map

  1. 01

    Map one building

    Upload the layout as PDF, DWG (R2004–R2018, placed as a picture) or image, align it at scale, and let AI Map draft racks, doors and areas for a person to review.

  2. 02

    Name racks, lanes and doors

    Use the codes your WMS or stock sheet already uses so every row finds its place.

  3. 03

    Connect stock and reads

    CSV or Excel exports, a polled REST endpoint, or the table write API for bulk upserts from your WMS and RFID middleware.

  4. 04

    Add shortage and hold rules

    In-app alerts for short lanes, held lots and readers that stopped reporting; reports to PDF or Excel.

What Porto teams track

Footwear cartons and order lanes

Cartons read at despatch, staging lanes per order, quality-hold area on the rack.

Port-side freight stations

Dock doors, yard slots and pallets from the quay to the road or rail.

Textile and garment work in progress

Rolls, cut parts and carriers by line, with the lot code on every row.

Historic-centre shops and stock rooms

Bay-level stock by floor from a handheld count.

See it on real demo facilities

Fictional names, real floor plans, live sensors, RFID, BLE tags and gateways — open any of them in the browser.

All 13 demo facilities

Inventory tracking in Porto — questions we get

Not yet. The app is available in English, Spanish, French, German, Arabic and Chinese, and each user picks their own language. Your own content — style names, lot codes, rack labels — can be in Portuguese, accents included.

No. Most projects tag the carton or the pallet, and keep the style, colour and size run in the row. The map shows where each carton is; the pair-level detail stays in your own system.

Each factory is a facility in your workspace, and a shared lot or order code on the rows ties them together in a table and a report. Spatial Map shows what your tables hold and does not connect the factories’ own systems to each other.

No. It reads from your system and shows its data on the building. Data comes in through CSV and Excel uploads, REST polling or the table write API, and Spatial Map does not write back to your ERP or WMS.

No. Spatial Map is sold online and our team works with customers in Portugal remotely, by video call and through the contact form, in English. There are no local resellers or partners.

In US dollars, the same worldwide: a 7-day free trial for up to 5 facilities with no card, then Pro at $60 a month or $600 a year for up to 4 facilities. Larger estates are quoted as custom services.

Map one Porto warehouse and count it on the map.

Start the free trial and open the Crestline demo, or send us a layout and a CSV export of your stock through the contact form.