Venlo and Eindhoven · Greenport Venlo and the Brainport campuses

Warehouse tracking in Venlo, and the high-tech floors of Brainport Eindhoven

Spatial Map shows the stock, pallets, dock doors and equipment of a building on a live 3D map, fed by the RFID, barcode, BLE and WMS data you already produce. Warehouse tracking in Venlo is a cross-border job: the distribution centres on the Maas serve customers on both sides of the German border, and to the south the Brainport campuses around Eindhoven run high-tech plants where tools and parts matter more than pallets. One workspace holds both kinds of site.

No credit card. Runs in the browser. Pro is $60/month for up to 4 facilities. Book a demo

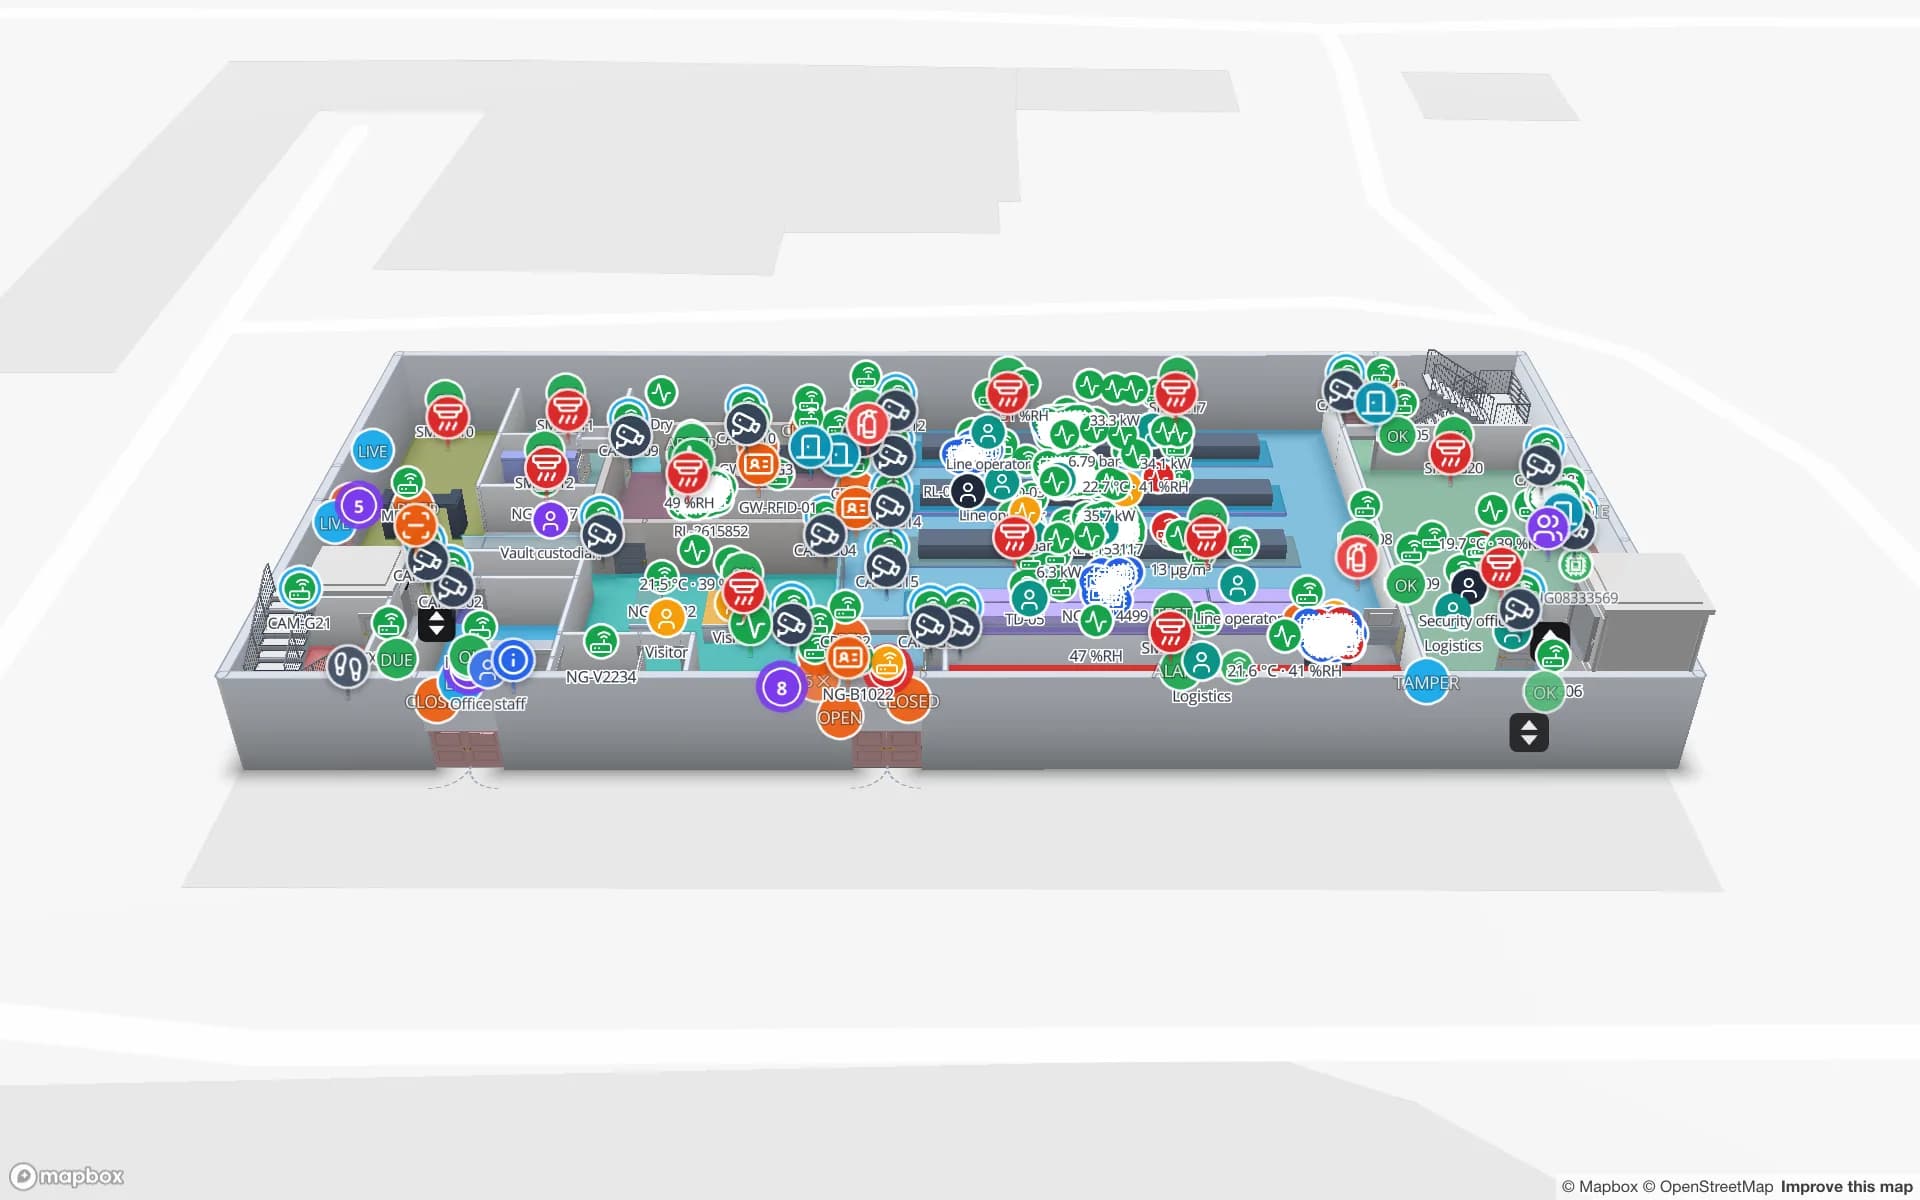
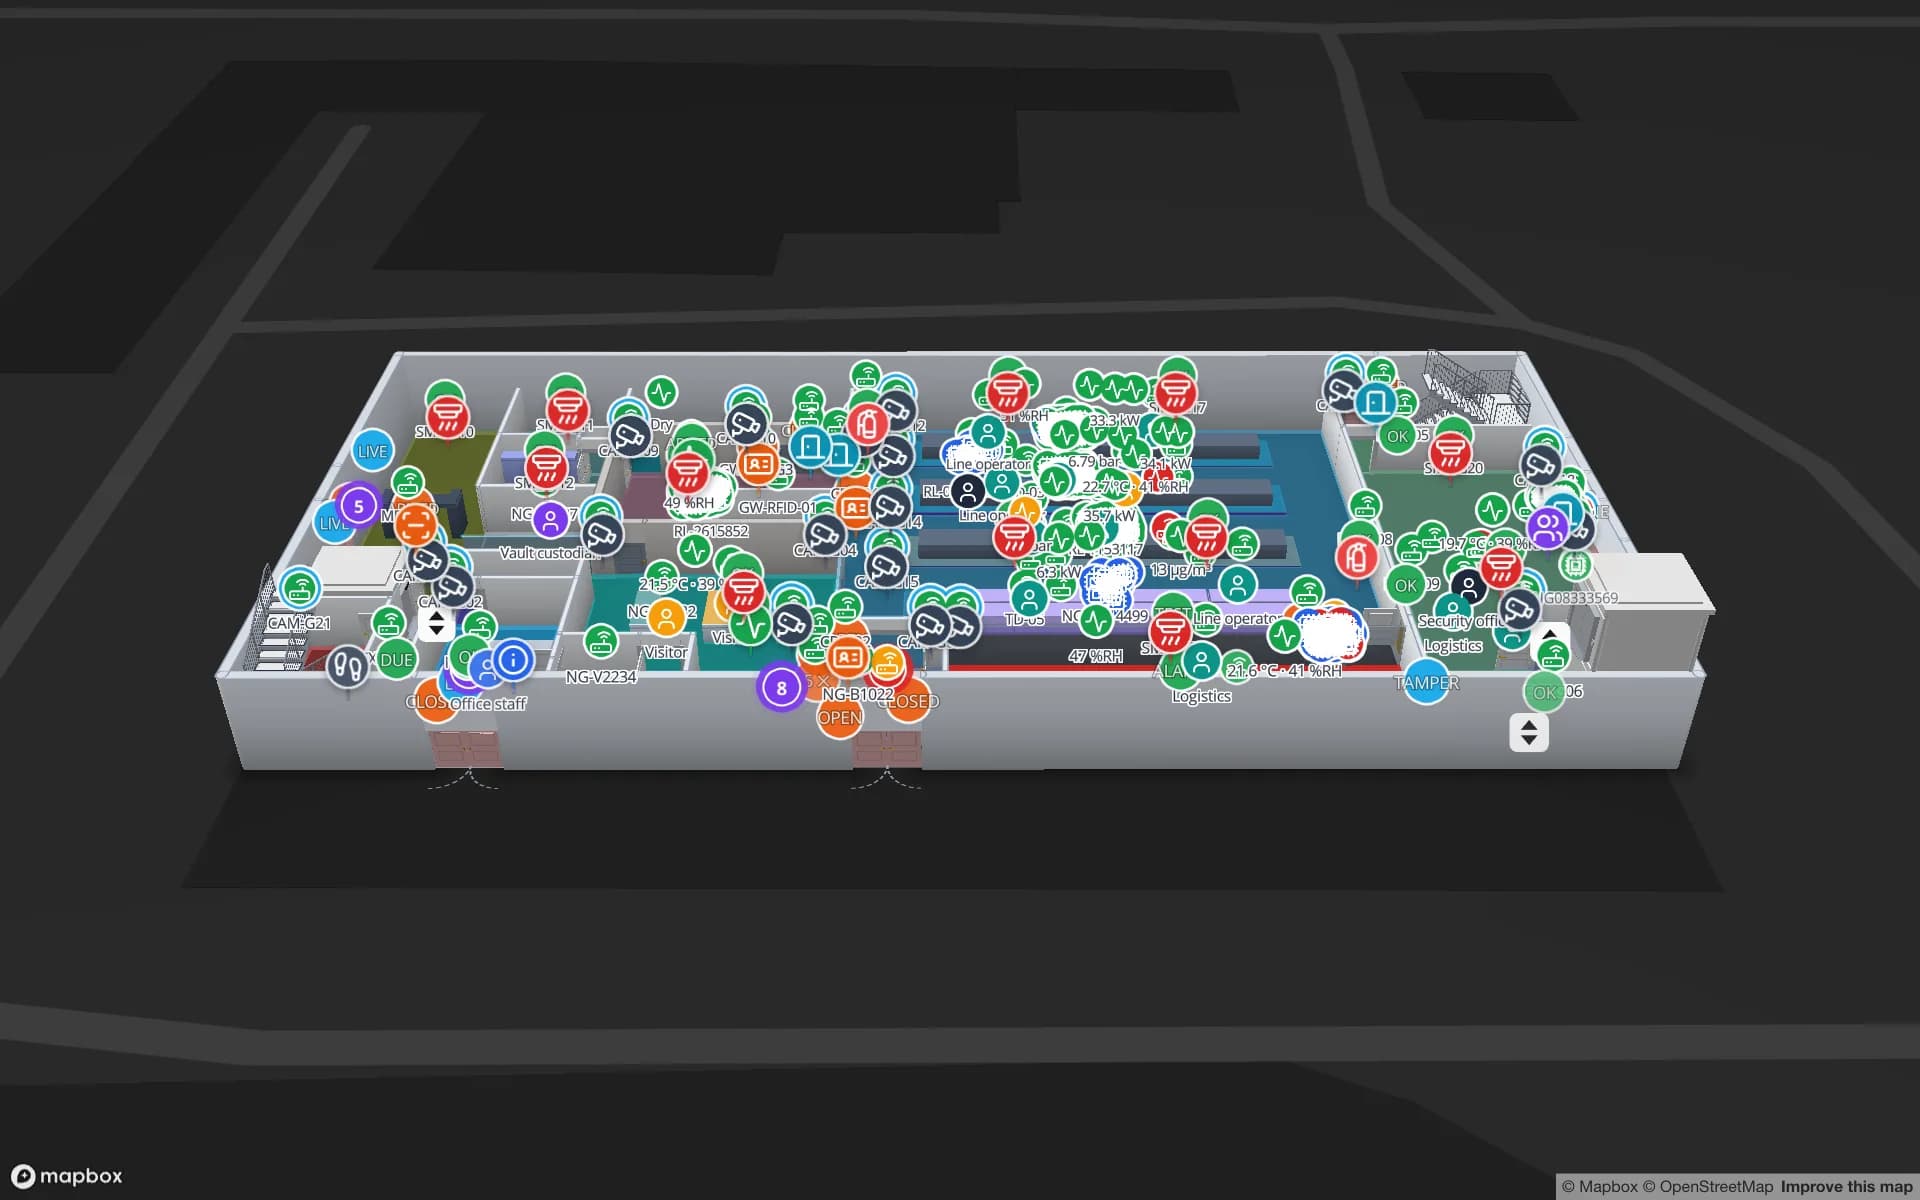
Crestline Fulfillment Center, a fulfillment center demo, in the Spatial Map 3D viewer with live device markers
Crestline Fulfillment Center
Crestline Fulfillment, a demo distribution centre: 20 racks with 2,204 rack locations, pick-to-light, packing and a trailer yard.
Rack locations in the Crestline fulfilment demo
2,204
Rack locations in the Summit assembly-plant demo
867
Interface languages that fit a border region, plus ES, AR and ZH
EN · DE · FR
Free trial, up to 5 facilities, no card
7 days

Greenport Venlo: a logistics park built around a rail terminal

Venlo sits on the Maas close to the German border. Its Greenport Venlo area is a development shared by the municipalities of Venlo and Horst aan de Maas, and its Trade Port Noord business park is where many of the newest and biggest distribution centres stand. A single 21.5-hectare plot there was sold in 2021 for a planned 130,000 square metre logistics campus, which gives a sense of the scale.

Rail is part of the picture. The Rail Terminal Greenport Venlo received its first train on 26 June 2020 and is connected to the public rail network, so trailers, containers and trains meet at the same park. For a warehouse that means more arrivals to sequence and more handovers to document. Spatial Map draws dock doors, yard slots, staging lanes and the gate on your plan; the Eastport demo shows 50 dock doors, 44 yard slots and 1,180 RFID pallets live.


Inside the box: rack locations, pick faces and returns

The country page already describes Venlo’s European distribution centres and their value-added services; here is what that looks like on a map. Each rack becomes a row of locations coloured by stock status from your WMS — empty, full, blocked, below minimum — and a click opens the location with its history. Pick-to-light and packing areas are drawn as areas, and RFID readers at the dock doors and the packing line place cartons in the building.

The Crestline demo has 20 racks and 2,204 rack locations. The usual first project is not the whole building but one process that goes wrong: returns, for example, where cartons come back mixed, are inspected and re-labelled, and then wait in a lane for a decision. Tag the carton at the returns door and the map shows how long each lane’s contents have been waiting; see RFID stock counting and the post on loading a CSV of bin stock onto a live rack map.

German and Dutch teams in the same building

Venlo’s workforce and customers cross the border every day, and many sites run in two or three languages. The Spatial Map interface is available in German, French and English as well as Spanish, Arabic and Chinese — not yet in Dutch — and each user chooses their own, so a German-speaking supervisor and an English-speaking planner work on the same facility. Rack codes, dock names and report titles stay exactly as you type them.

Read-only share links help with the customer side: pick the floors and layers, set an expiry date and a view cap, and send the link without an account. A client sees its own area of a multi-client building; you see the lot. For data, your WMS or yard system posts rows to a table through the write API, or Spatial Map polls its REST endpoint.

Brainport Eindhoven: tools, parts and cleanrooms

Eindhoven is a different kind of site. The High Tech Campus Eindhoven reports more than 300 companies and over 12,000 professionals on a campus area of 1,010,000 square metres, with labs, cleanrooms and pilot production. The Brainport Industries Campus describes itself as the hub for high-tech and deep-tech manufacturing in the region, with a campus area of 330,000 square metres, about 50 companies and flexible production spaces and shared facilities.

What gets lost there is rarely a pallet. It is a test fixture, a measuring tool, a reel of components, a prototype, a calibrated instrument that has to be back before the next run. Tag the tools with BLE or RFID, draw stores, labs and lines as areas, and the map shows where each item was last seen and which ones are overdue; RFID tool tracking covers the crib pattern. The Summit demo shows lines, workstations and 867 rack locations for raw material and finished goods on one plant map, and the post on supply-chain visibility inside a plant goes through the flow. Spatial Map does not run cleanrooms or measure particles; it shows what your own systems report.

Services for teams in Venlo and Eindhoven

Where teams in the two regions usually start:

  • Distribution centres start with inventory tracking at the dock doors and the returns lane, then add rack-level stock from the WMS.
  • Plants and labs in Brainport start with asset tracking for tools, fixtures and instruments, and with factory indoor mapping.
  • RTLS and UWB is for very large halls where forklifts and people must be located continuously; most sites do not need it first.
  • If you have no readers or tags yet, our team can source RFID readers, antennas and tags on request, quoted per project, with warranty and device support from the manufacturer: see hardware and demo kits on request.
  • Many Dutch operators have their own IT team; where yours does not, our team builds WMS and ERP integrations, handheld apps and back offices as client projects. The product runs as cloud or on-premises.

Also served nearby

The same approach covers Tegelen, Venray, Roermond and Horst aan de Maas around Venlo, and Helmond, Veldhoven and Best around Eindhoven; Tilburg and Breda are covered by the Netherlands page. Across the border, the Düsseldorf and Mönchengladbach area is a short drive away; see Germany.

How Spatial Map does it

From one process to the whole building

  1. 01

    Pick the process that hurts

    Returns lane, dock sequencing, a tool crib or a store of reels — one place where a missing item costs most.

  2. 02

    Map doors, racks and lanes

    Upload the plan, let AI Map draft the floor for review, and name read points like your middleware does.

  3. 03

    Connect WMS and reads

    Rows from your WMS and RFID middleware through the write API, a polled REST endpoint or CSV and Excel uploads.

  4. 04

    Share per customer or team

    Read-only links with the floors and layers each client or shift should see, in the viewer’s own language.

What Venlo and Brainport teams track

Multi-client distribution centres

Rack-level stock, RFID cartons and packing areas, with a read-only view per client.

Cross-border trailer and rail handovers

Dock doors, yard slots and pallets staged for the right load before cut-off.

Tools, fixtures and instruments in plants

Last-seen area, overdue returns and history per tagged item.

Component and finished-goods flow

Raw material, work in progress and finished goods from the line to the dock.

See it on real demo facilities

Fictional names, real floor plans, live sensors, RFID, BLE tags and gateways — open any of them in the browser.

All 13 demo facilities

Warehouse tracking in Venlo — questions we get

No. It reads from your WMS and yard system and shows their data on the building: stock by rack location, trailers by yard slot, pallets by dock door. Data comes in through REST polling, file uploads or the table write API, so a warehouse management system stays necessary.

Yes. Each user picks their interface language, and German, French and English are all available, along with Spanish, Arabic and Chinese. Your own labels, rack codes and report titles stay in whatever language you type them. Dutch is not yet an interface language.

Yes, through read-only share links with layers and floors chosen by you, an expiry date and a view cap. The client needs no account, and you can revoke the link at any time.

Yes, for tools, fixtures, instruments and parts: tag them with BLE or RFID, draw stores and lines as areas and let the map show the last-seen area and overdue returns. It does not control equipment or measure cleanroom conditions, and it does not compute positions from BLE signal strength itself; your tag system reports positions.

Your RFID middleware posts rows (tag, reader, time) to a table with the write API — HTTPS, bearer API key, bulk upsert, 60 requests per minute per key — or exposes a REST endpoint that Spatial Map polls. Reader names in the data match the door names on the map.

No. Spatial Map is sold online and our team works with customers in the Netherlands remotely, by video call and through the contact form. There are no local resellers or partners.

In US dollars, the same worldwide: a 7-day free trial for up to 5 facilities with no card, then Pro at $60 a month or $600 a year for up to 4 facilities. Larger estates are quoted as custom services.

Map one Venlo building this week.

Start the free trial and open the Crestline demo, or send us a plan of one distribution centre or plant and a sample of your WMS data through the contact form.