Netherlands · Nederland

RFID tracking and indoor mapping software for the Netherlands

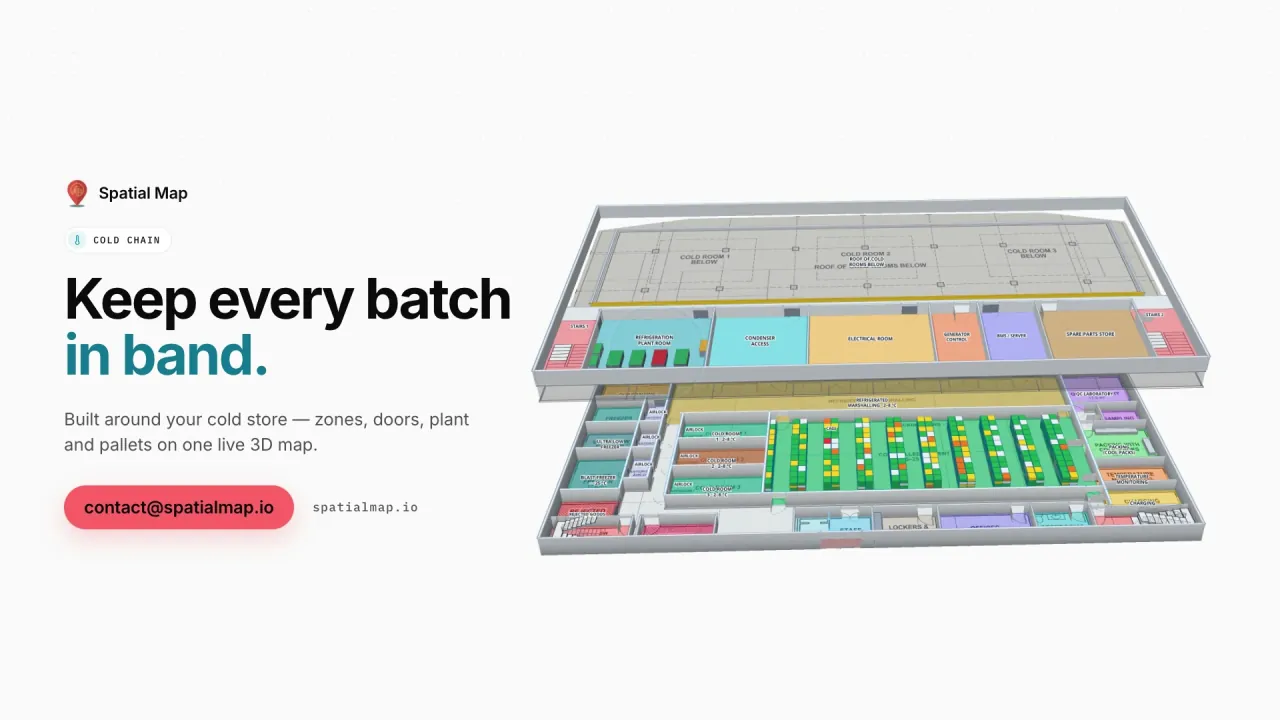
The Netherlands is one of Europe’s main gateways: goods arrive through Rotterdam and Schiphol, are stored and finished in distribution centres across Brabant and Limburg, and leave by truck, barge and rail for the rest of the continent. Spatial Map turns those buildings — distribution centres, cross-docks, cold stores — into live 3D maps of docks, racks and yards, fed by the RFID, BLE and WMS data you already have.

No credit card. Runs in the browser. Pro is $60/month for up to 4 facilities. Book a demo

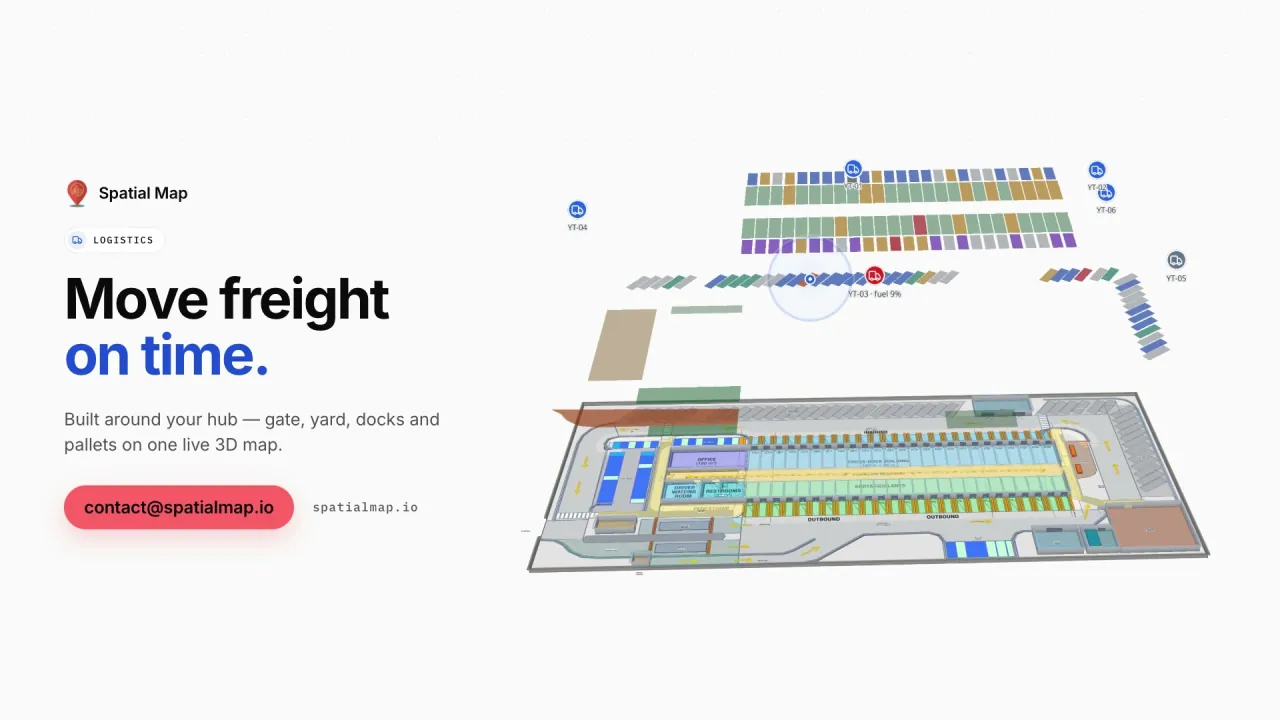
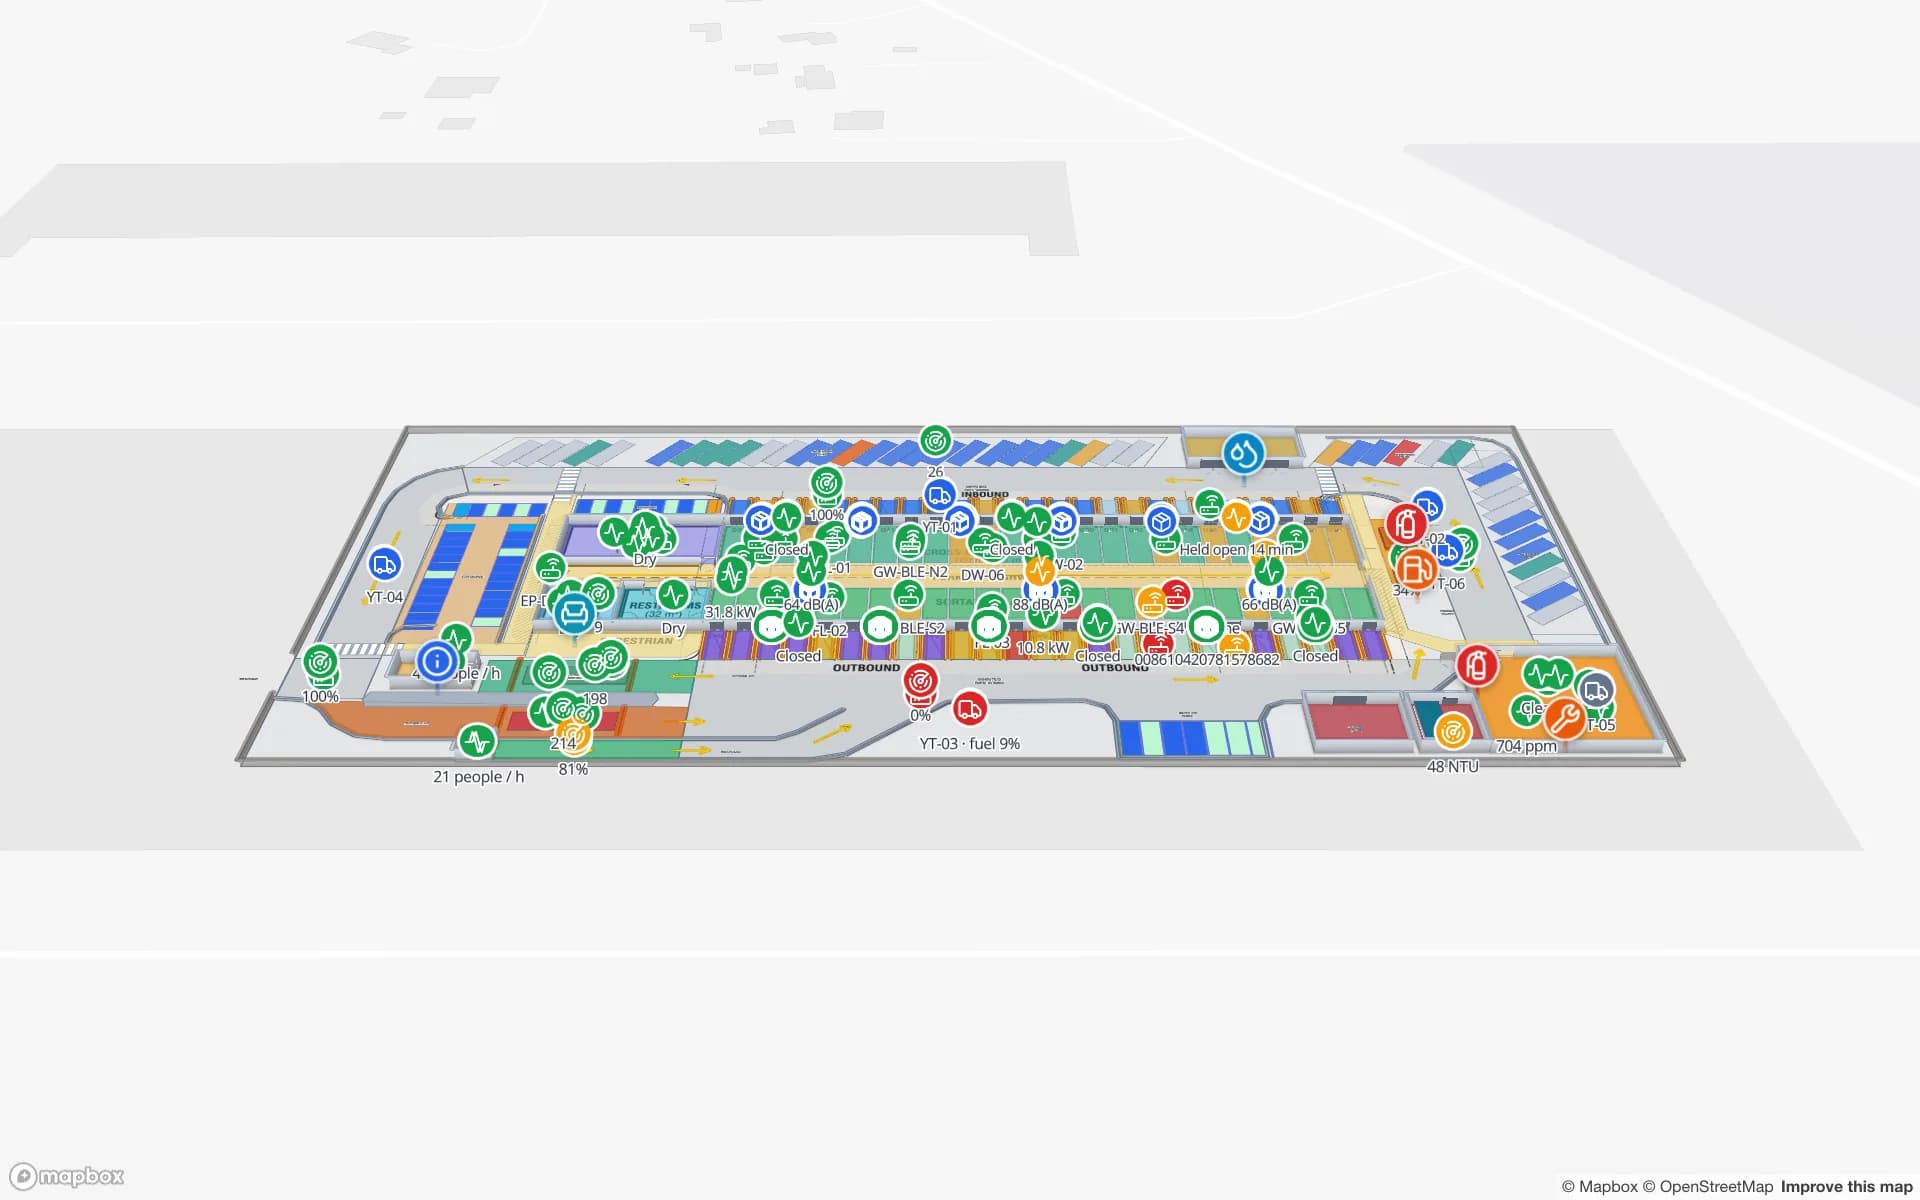
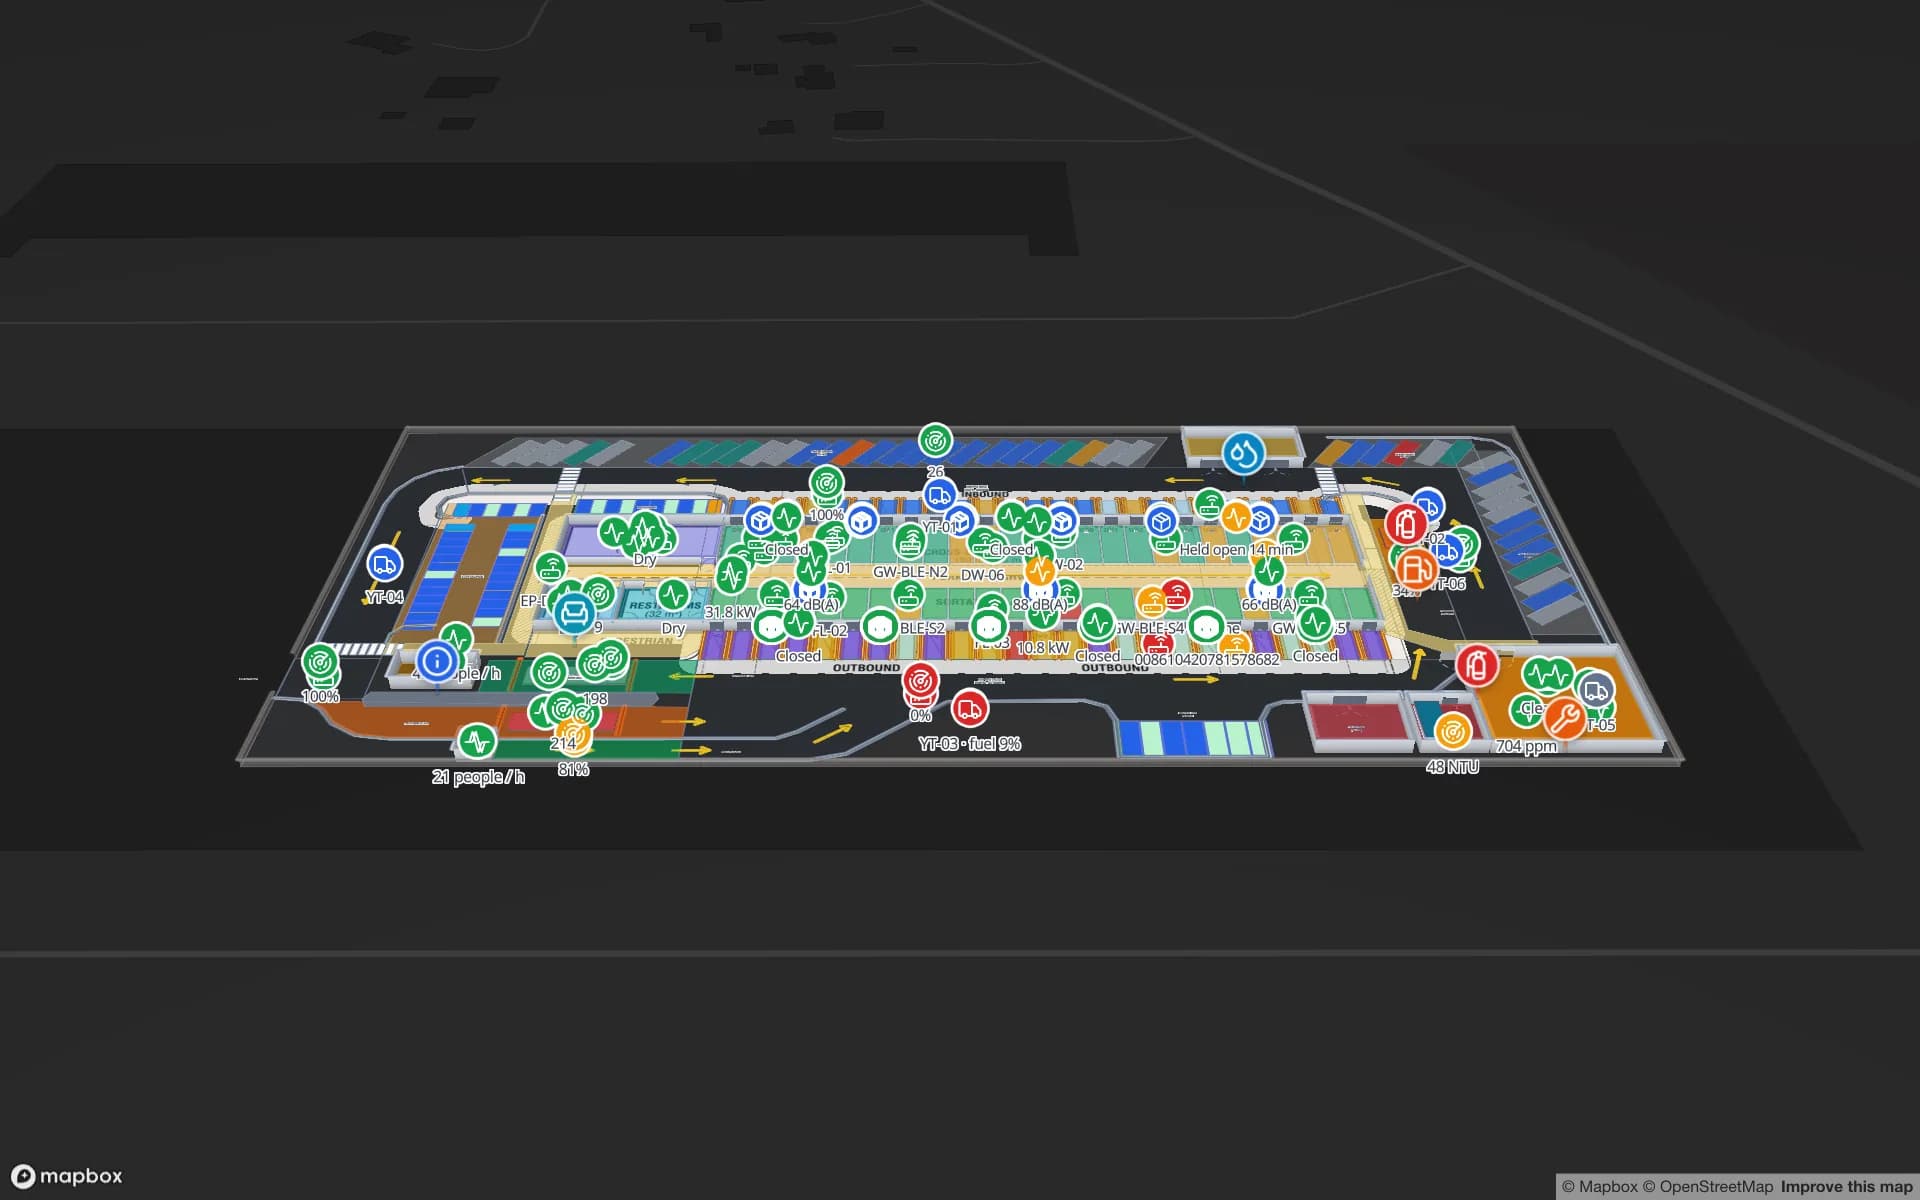
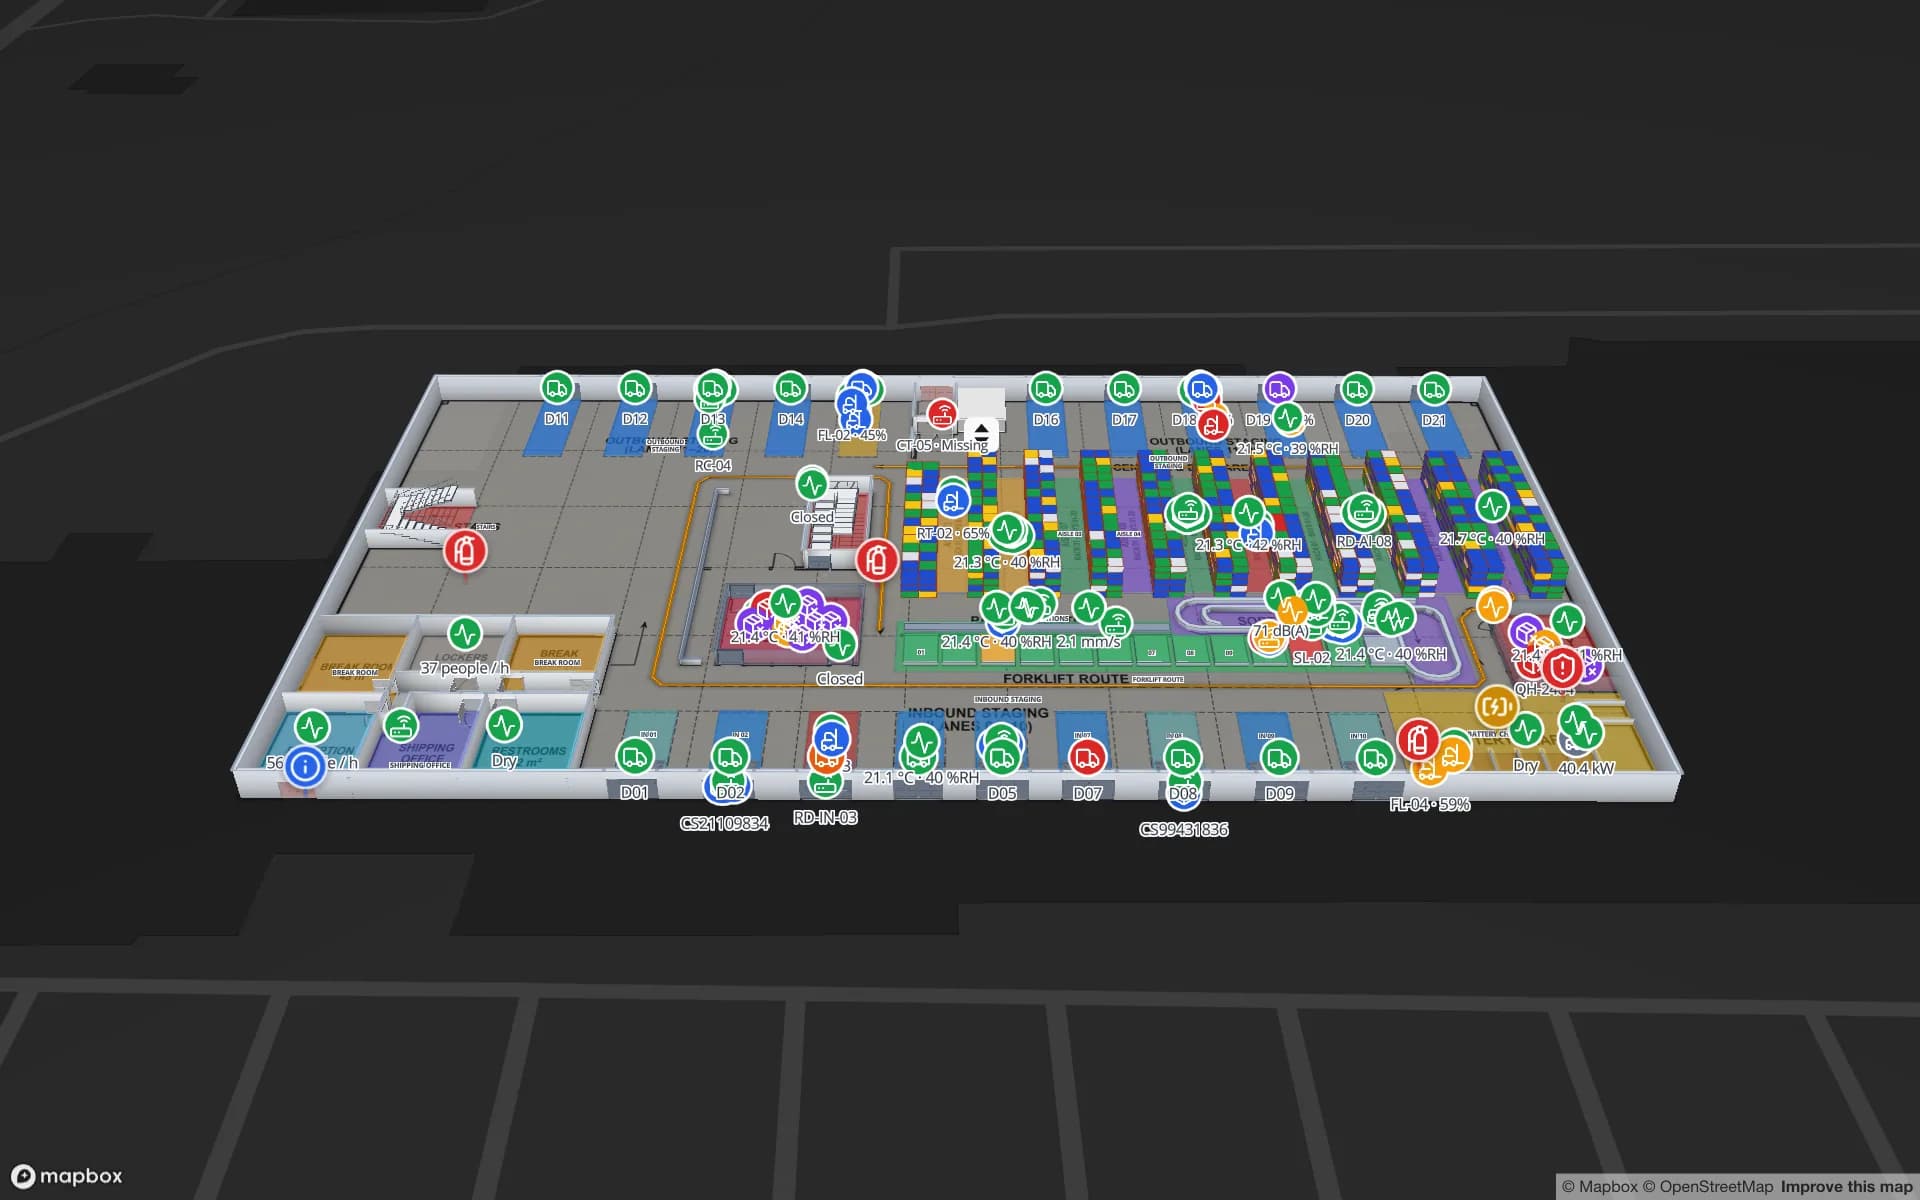
Eastport Cross-Dock Freight Hub, a cross-dock & trailer yard demo, in the Spatial Map 3D viewer with live device markers
Eastport Cross-Dock Freight Hub
Eastport Cross-Dock, a demo freight hub: 50 dock doors, 44 yard slots and 1,180 RFID pallets, with the gate and weighbridge.
Dock doors in the Eastport Cross-Dock demo
50
RFID pallets live in the same demo
1,180
Interface languages (Dutch not yet available)
EN · DE · FR · ES
Free trial, up to 5 facilities
7 days

Gateway to Europe: Rotterdam and Schiphol

The Port of Rotterdam is Europe’s largest port, and Amsterdam Airport Schiphol is one of the continent’s major cargo airports. With inland waterways and rail links into Germany and Belgium, they make the Netherlands a natural place to receive goods for the whole European market — and the warehouses around them handle containers, pallets and air freight that are often bound for several countries.

For those operations, minutes and lanes matter: which dock door a trailer is at, which pallets are staged for which outbound load, what is still in the yard before cut-off. Spatial Map draws dock doors, staging lanes, yard slots, the gate and the weighbridge on your site plan and binds RFID reads, yard data and WMS status to them.
European distribution centres in Brabant and Limburg

Many international manufacturers and retailers run their European distribution centre in the Netherlands, and logistics regions such as Venlo, Tilburg and the wider Brabant–Limburg corridor are among the best-known locations for them. These are large, often multi-client buildings that serve customers across the EU and add services on top of storage: labelling, kitting, returns.

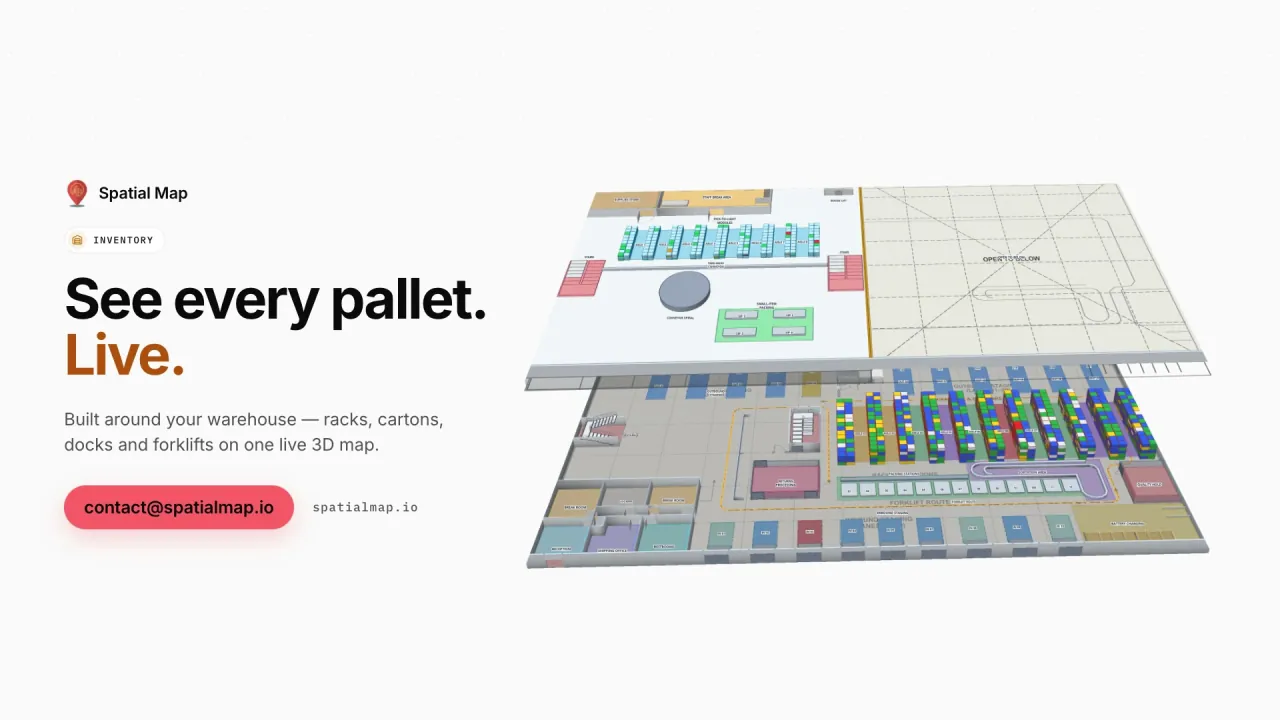
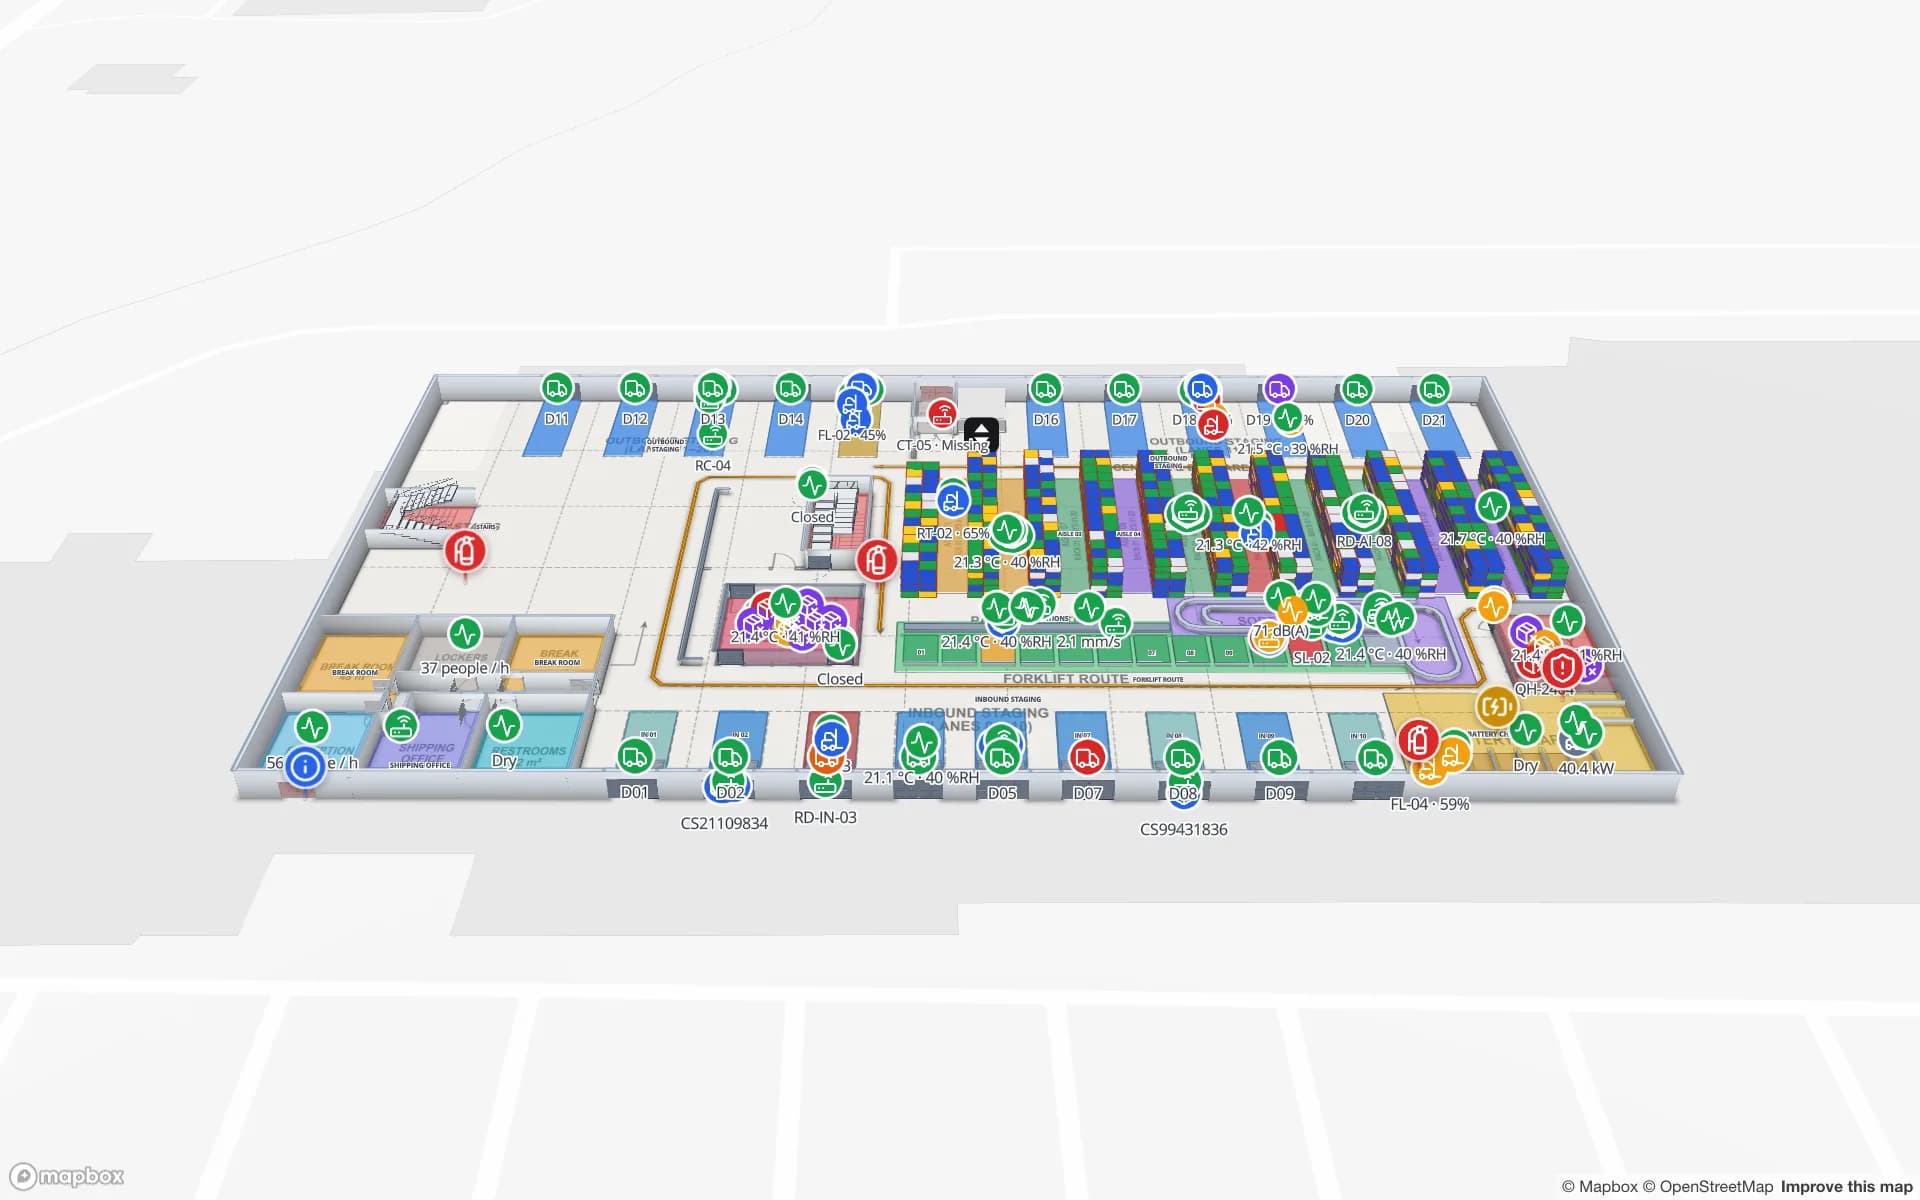
Spatial Map shows such a distribution centre as one live map: rack locations coloured by stock or status from your WMS, RFID cartons and pallets followed door to door, forklifts as live markers, packing and staging areas in context. The Crestline Fulfillment demo has 20 racks with 2,204 rack locations, pick-to-light, packing and a trailer yard. For multi-client sites, read-only share links let each client see only the floors and layers you choose, with an expiry date and no account needed.

Cross-docks and the yard

Cross-docking is where Dutch logistics is most time-critical: pallets come in, are sorted and leave again within hours, often for another country. A pallet in the wrong lane or a trailer forgotten in the yard means a missed departure.

In the Eastport Cross-Dock demo, 50 dock doors, 44 yard slots and 1,180 RFID pallets are live on one map, with a pallet staged in the wrong lane and short loads before cut-off visible in place, and dock, gate and yard reports exported for the shift. Your own site works the same way: your RFID middleware or yard management system posts rows to a table, or Spatial Map polls its REST endpoint.

Agrifood, horticulture and the cold chain

The Netherlands is one of the world’s largest exporters of agricultural products, and its horticulture sector — the greenhouses of the Westland, the flower auction at Aalsmeer — ships flowers, plants, vegetables and fruit across Europe and beyond, much of it chilled. Fresh produce, dairy and flowers pass through cold rooms, ripening rooms and temperature-controlled cross-docks on the way.

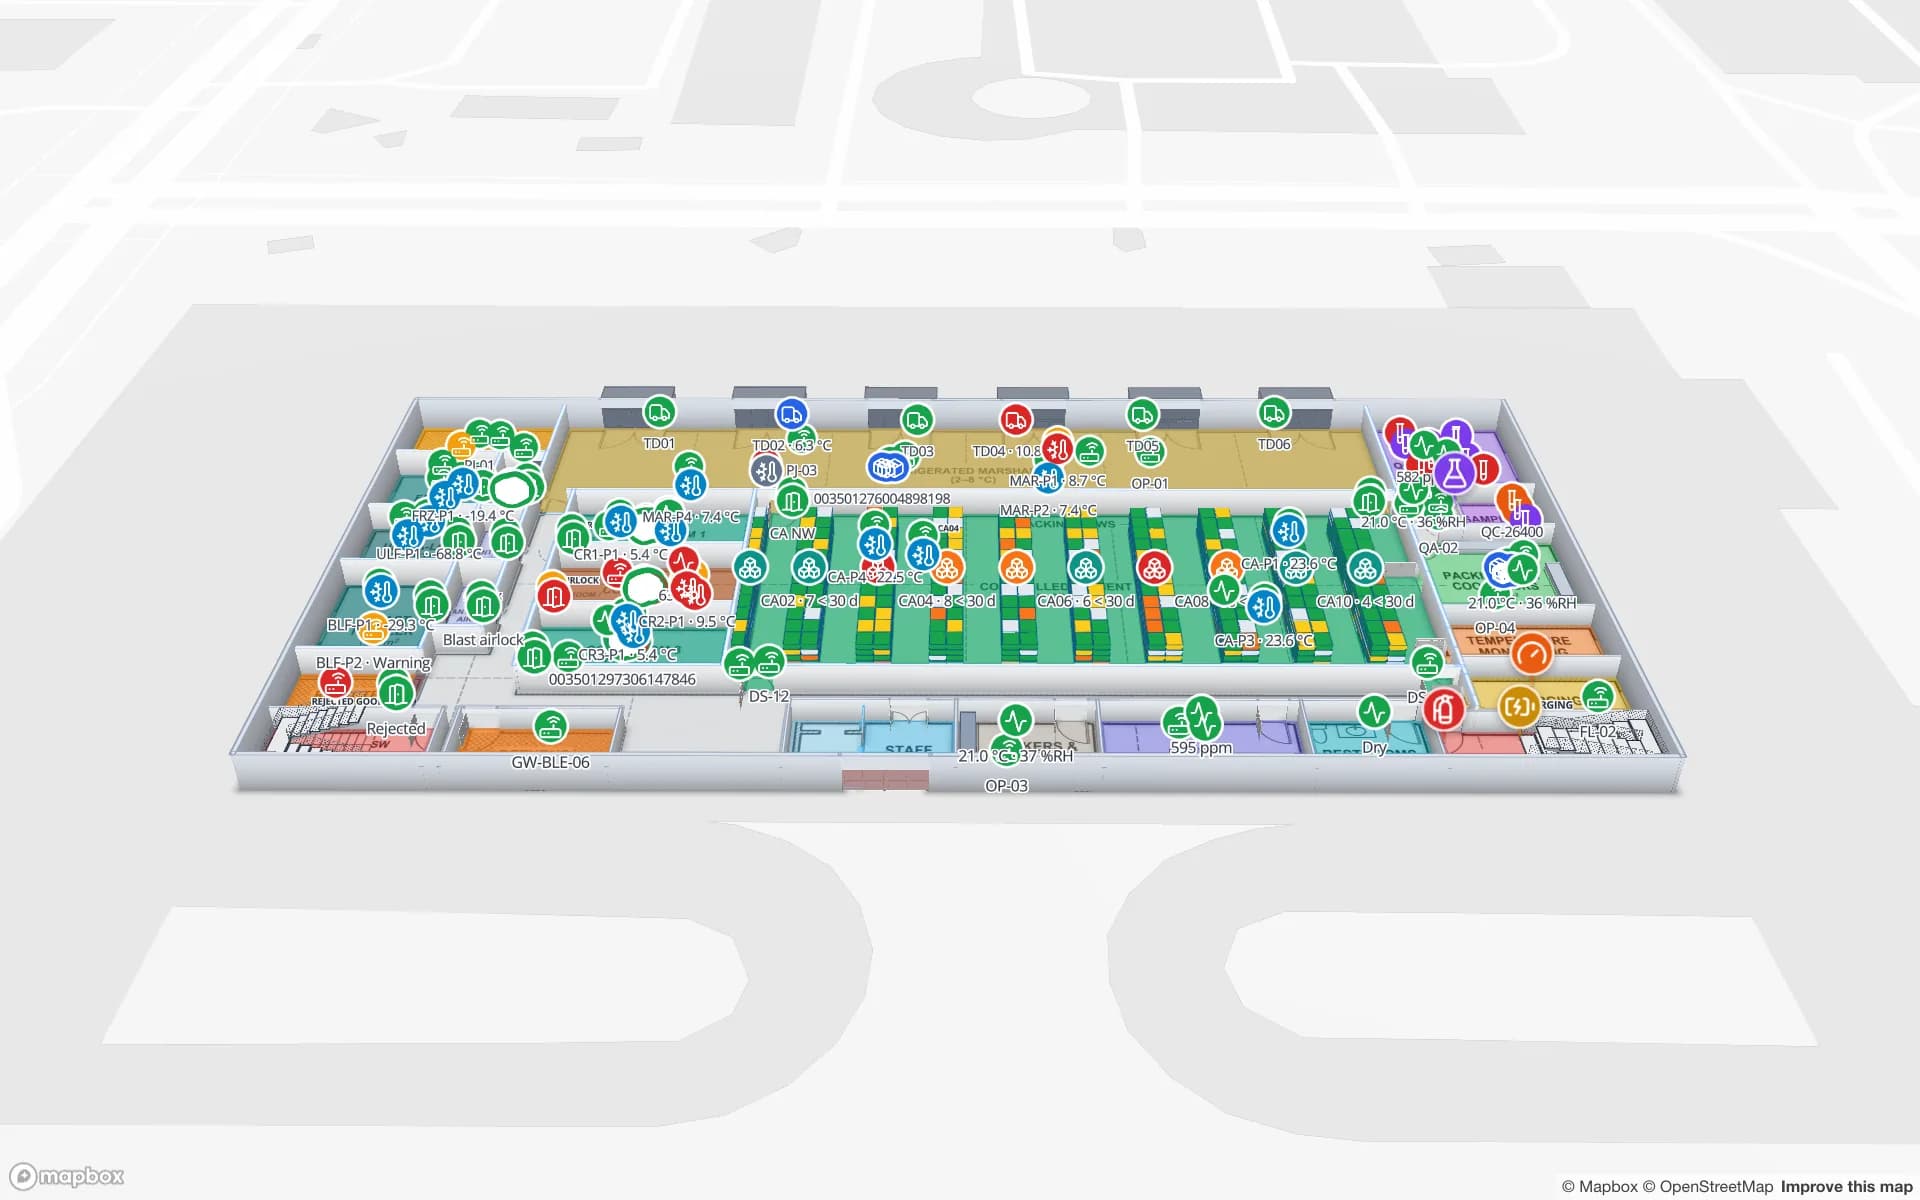
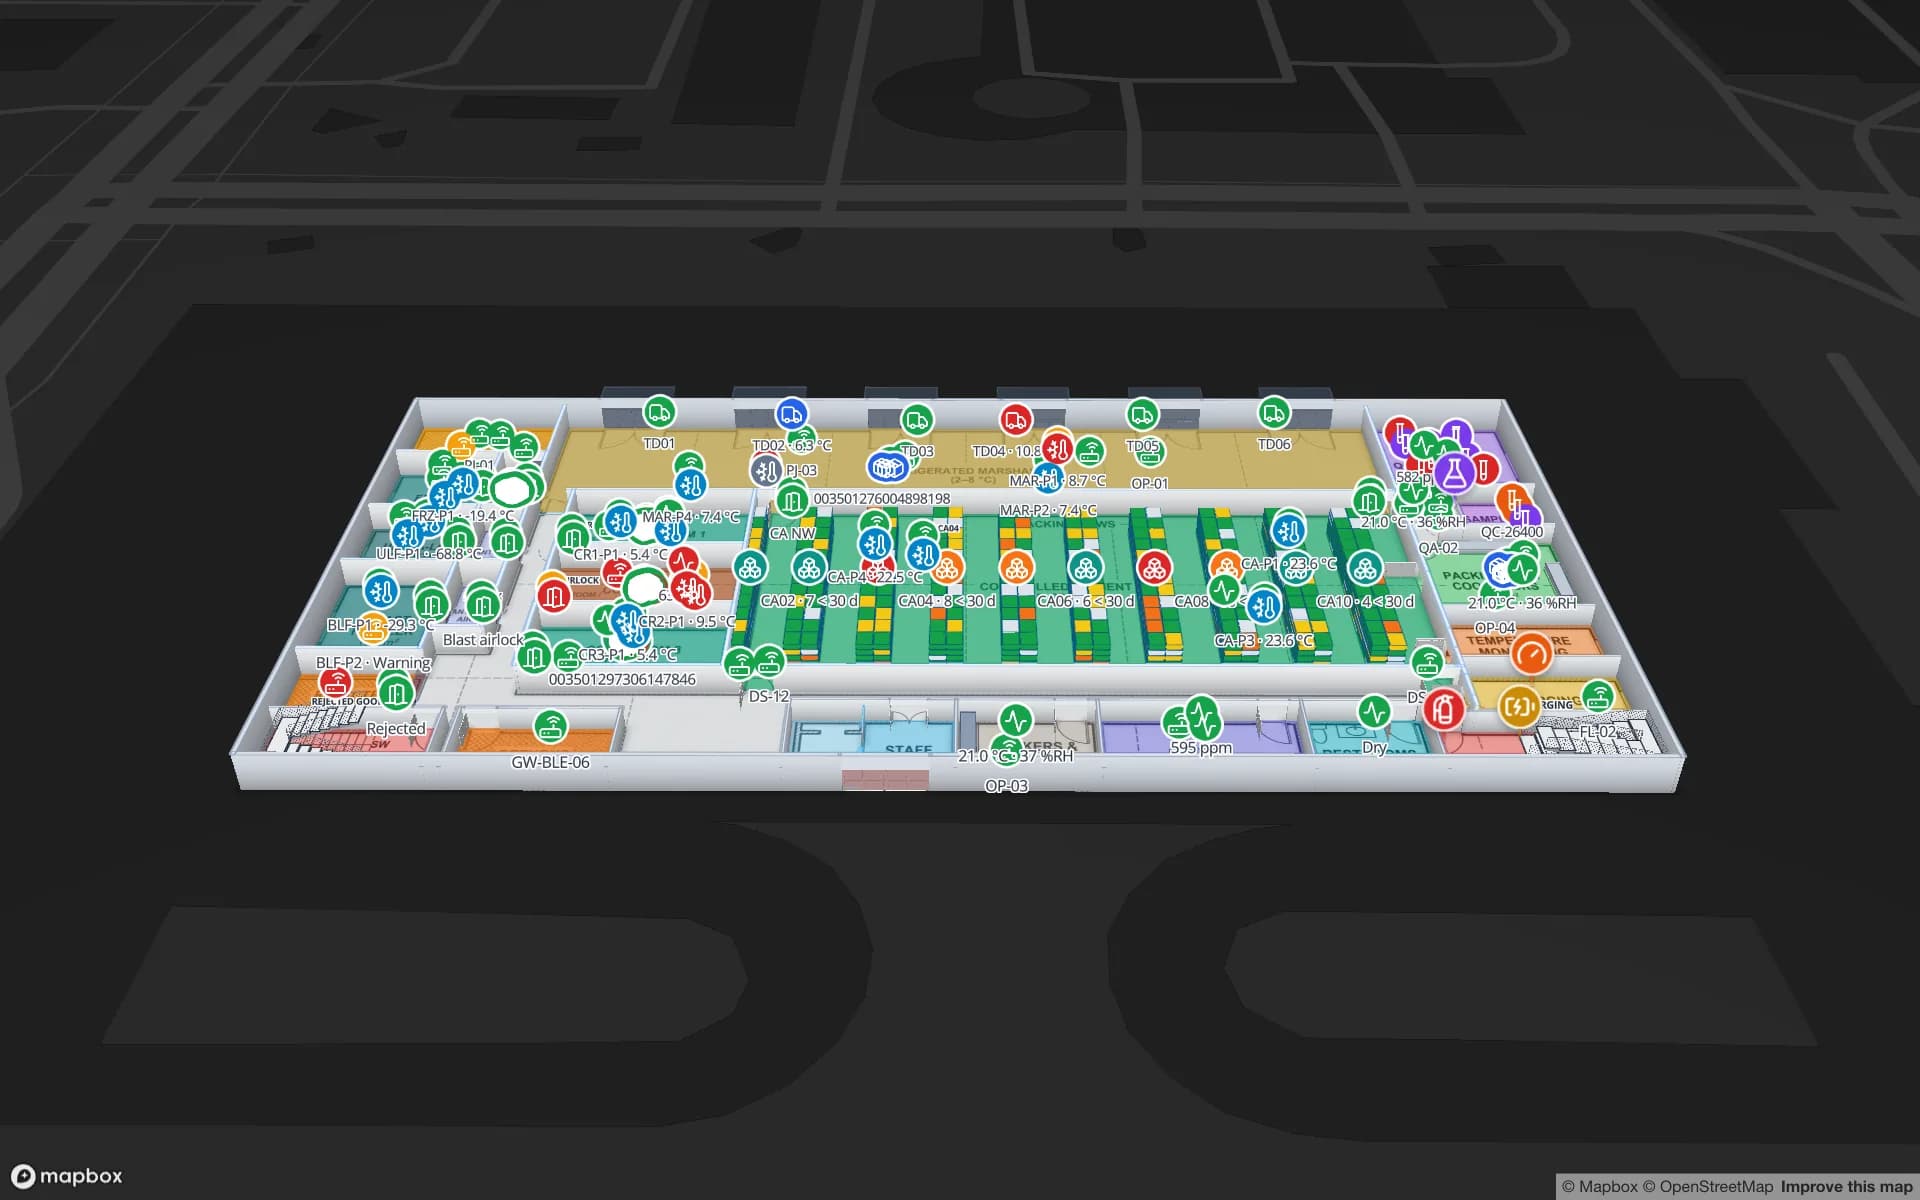
Spatial Map colours each cold room and dock by the live reading from your sensors, shows doors open or closed and pallets on hold, and replays recent changes with the History player. The Polar Pharma demo shows the same pattern for a pharma cold store with temperature zones, doors and 1,140 rack locations — relevant too for the pharmaceutical distribution centres that serve Europe from the Netherlands.

Language, privacy and working with us

The interface is not yet available in Dutch. Dutch teams typically use it in English — convenient for the international workforce common in Dutch logistics — and it is also available in German, French and Spanish, plus Arabic and Chinese. Dock names, rack codes and column names stay exactly as you write them. There is a Dutch version of this page.

Under the GDPR (AVG), location data that can be linked to employees is personal data, and staff tracking can also involve your works council (ondernemingsraad); most logistics projects therefore tag pallets, cartons, trailers and equipment rather than people. A data processing agreement is available and the security page describes how data is protected. Spatial Map is sold online at the same USD price worldwide, and our team works with customers remotely, by video call and through the contact form.

How Spatial Map does it

From site plan to live distribution-centre map

  1. 01

    Import the site plan

    Upload a PDF or DWG (AutoCAD R2004–R2018) of the building and yard and place it at scale.

  2. 02

    Draw docks, racks and lanes

    Trace dock doors, yard slots, staging lanes, racks with their locations and cold rooms.

  3. 03

    Connect WMS, YMS and RFID

    Your systems post rows to a table with the write API, or Spatial Map polls their REST endpoint.

  4. 04

    Run the shift and share

    Live map, history playback, dock and yard reports, and read-only links for clients.

What Dutch teams use it for

European distribution centres

Rack-level stock, RFID cartons, packing and the trailer yard for multi-client DCs.

Cross-docks and freight hubs

Dock doors, yard slots, gate and weighbridge, with pallets staged in the right lane.

Cold stores for food, flowers and pharma

Temperature zones, doors and held pallets, with exportable reports.

Returnable carriers

Roll cages, horticultural trolleys and returnable pallets tracked as tagged assets.

Port-side supply chains

Inbound containers, deconsolidation and outbound loads followed through the building.

See it on real demo facilities

Fictional names, real floor plans, live sensors, RFID, BLE tags and gateways — open any of them in the browser.

All 13 demo facilities

Questions from Dutch teams

Not yet. The app is available in English, German, French, Spanish, Arabic and Chinese, and each user picks their own language. Your own content — dock names, rack codes, columns — can be in Dutch.

Yes, through read-only share links: you choose the layers and floors, set an expiry and a view cap, and can revoke the link at any time. The client does not need an account. For ongoing access you can also add people with the Viewer role.

No. It reads from them and shows their data on the building: stock by rack location, trailers by yard slot, pallets by dock door. Data comes in through REST polling, file uploads or the table write API.

Your RFID middleware posts rows (tag, reader, time) to a table with the write API — HTTPS, bearer API key, bulk upsert, 60 requests per minute per key, so reads are sent in batches — or exposes a REST endpoint that Spatial Map polls. Reader names in the data match the door names on the map.

The same worldwide, in US dollars: a 7-day free trial for up to 5 facilities, then Pro at $60 a month or $600 a year for up to 4 facilities. Larger estates are quoted as custom services.

Map your first Dutch site this week.

Start the free trial, or send us a site plan and a sample of your WMS or RFID data through the contact form.