Turin · Piedmont suppliers, Lingotto, Orbassano, Caselle cargo

Asset tracking in Turin, from the supplier floor to the Orbassano yard

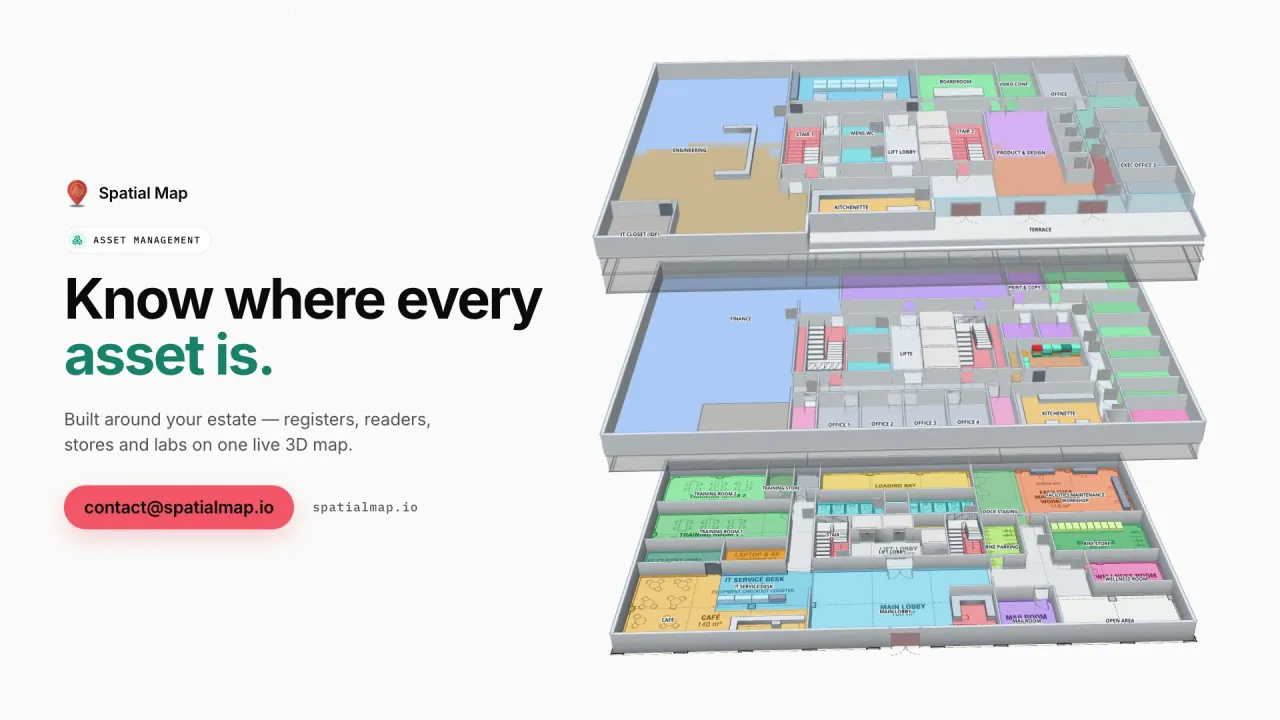
Spatial Map shows where tagged tooling, containers and equipment are on a live 3D map of each building, using the reads and positions your RFID and BLE systems already produce. Asset tracking in Turin starts with the automotive supply chain around the city: plants that depend on dies, fixtures, gauges and returnable racks moving between customer, supplier and repairer, plus the rail, air and event sites that move the same kind of equipment. Each is its own facility, and all of them can sit in one workspace.

No credit card. Runs in the browser. Pro is $60/month for up to 4 facilities. Book a demo

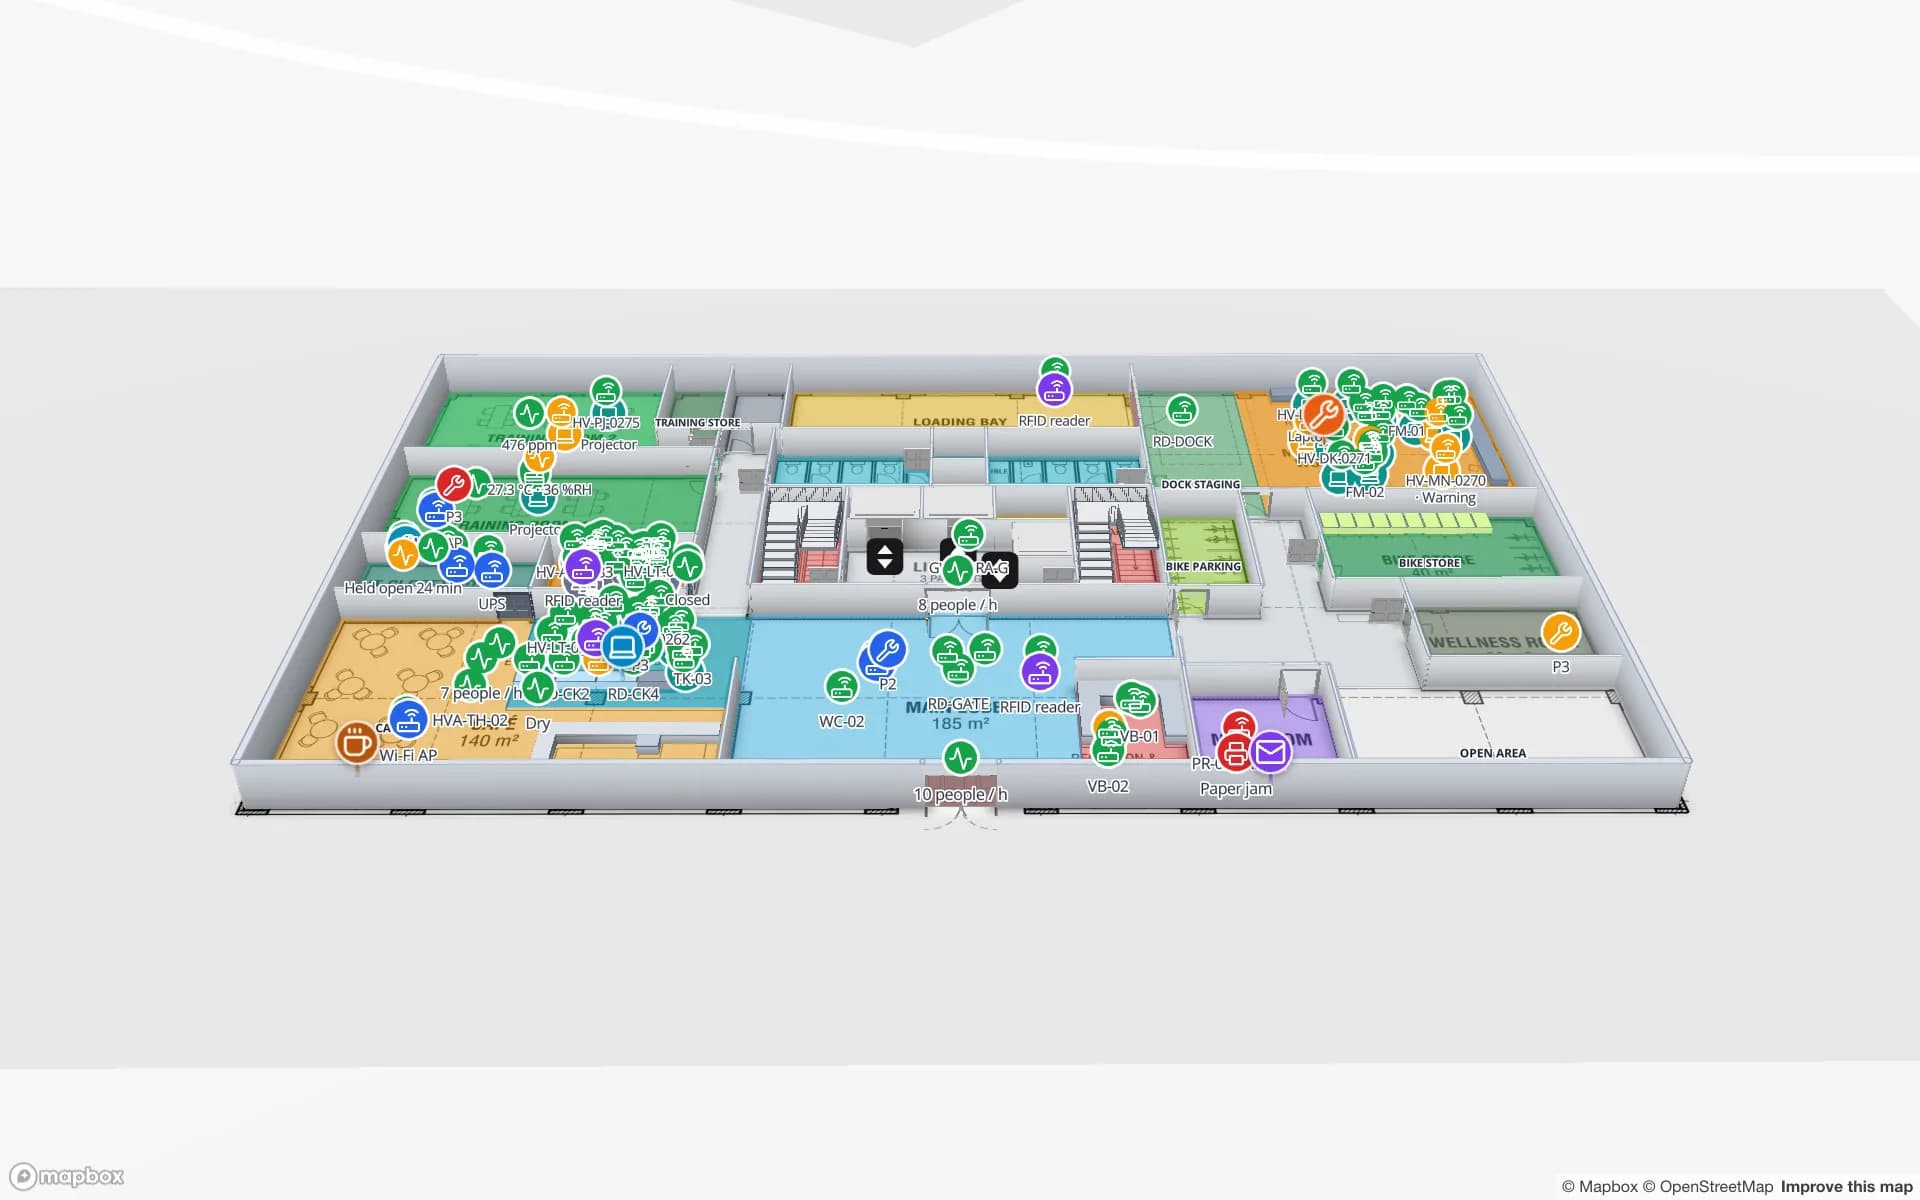
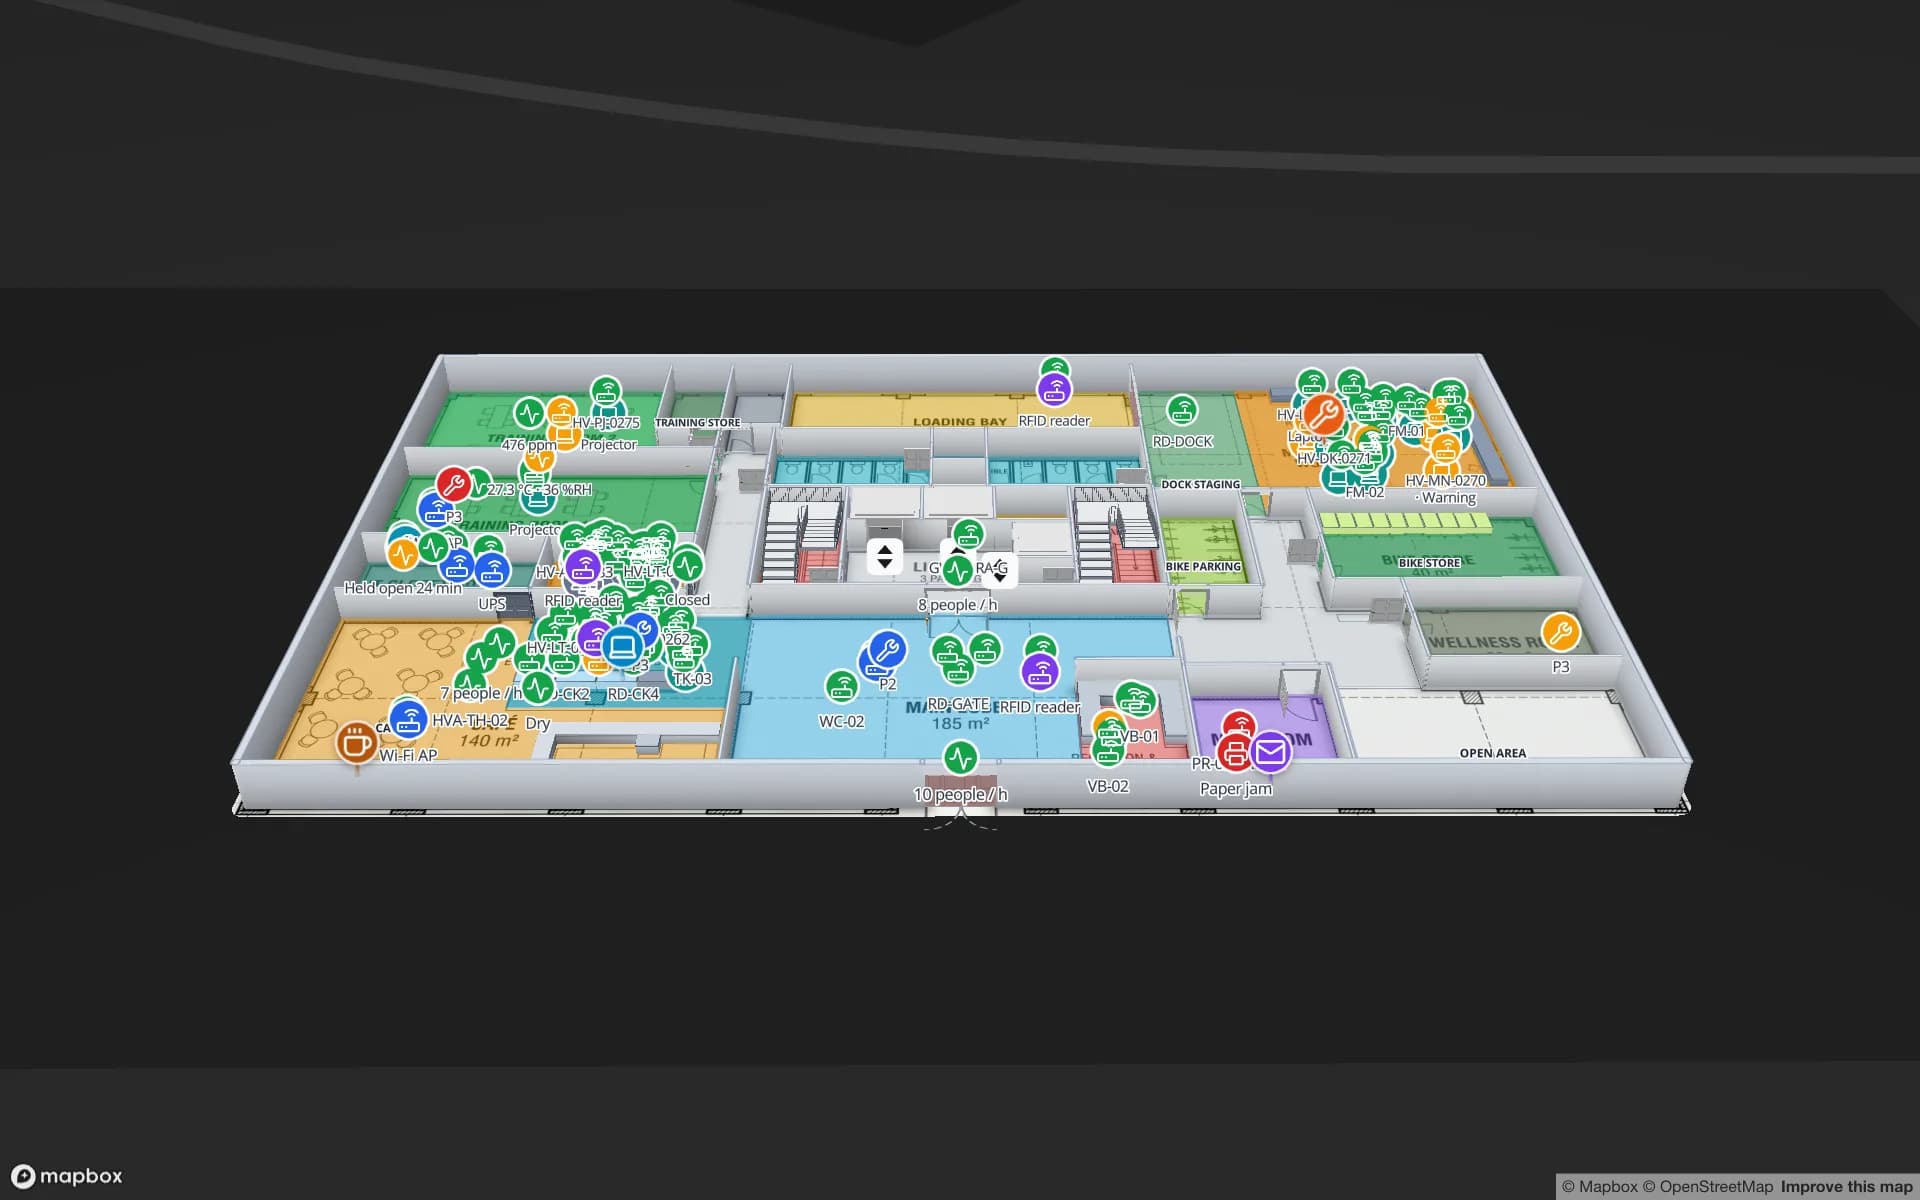
Summit Assembly Plant, a assembly plant demo, in the Spatial Map 3D viewer with live device markers
Summit Assembly Plant
Summit Assembly Plant, a demo factory on two floors: assembly lines and workstations, WIP carriers read between stations, and 867 raw-material and finished-goods rack locations.
Rack locations in the Summit assembly-plant demo
867
Yard slots in the Eastport cross-dock demo
44
How often alert rules are checked, with alerts shown in the app
15 s
Free trial, up to 5 facilities, no card
7 days

The supplier belt: when the asset is a die or a rack

A March 2025 article on the regional Vehicle Valley initiative cites 713 automotive firms in Piedmont, 33.6 % of the Italian total, with EUR 20.4 billion of turnover and more than 56,000 employees; it does not state the year of the data. Most of those firms are suppliers, and a supplier’s costly assets are rarely the product: they are the dies and moulds that live at the customer for months, the checking fixtures, the gauges due for calibration and the returnable racks and containers that must come back.

Keep the asset register as a table — tag ID, owner, customer, status, due date — and draw each plant so every store, press line and despatch bay is an area. RFID read at the tool-crib and despatch doors, or BLE tags with gateways named after the areas, tell your system where each item was last seen; a style rule colours items overdue for return, and the History player replays where one has been. RFID tool tracking covers the crib pattern, the Summit demo shows WIP carriers and 867 rack locations on a plant map, and the post on RFID versus BLE for asset tracking helps choose.


Lingotto: a factory built upwards, now a fair and a landmark

The Lingotto was designed in the 1920s by Giacomo Mattè Trucco as a car factory, and the city’s tourist board still calls its rooftop test track a symbol of industrial Turin. Beside it, Lingotto Fiere runs an Oval of 20,000 m² of column-free space, built for the 2006 Winter Olympics and managed by the fair since 2009. A multi-storey industrial building and a big single-storey hall are the two plan types the 3D indoor map handles every day.

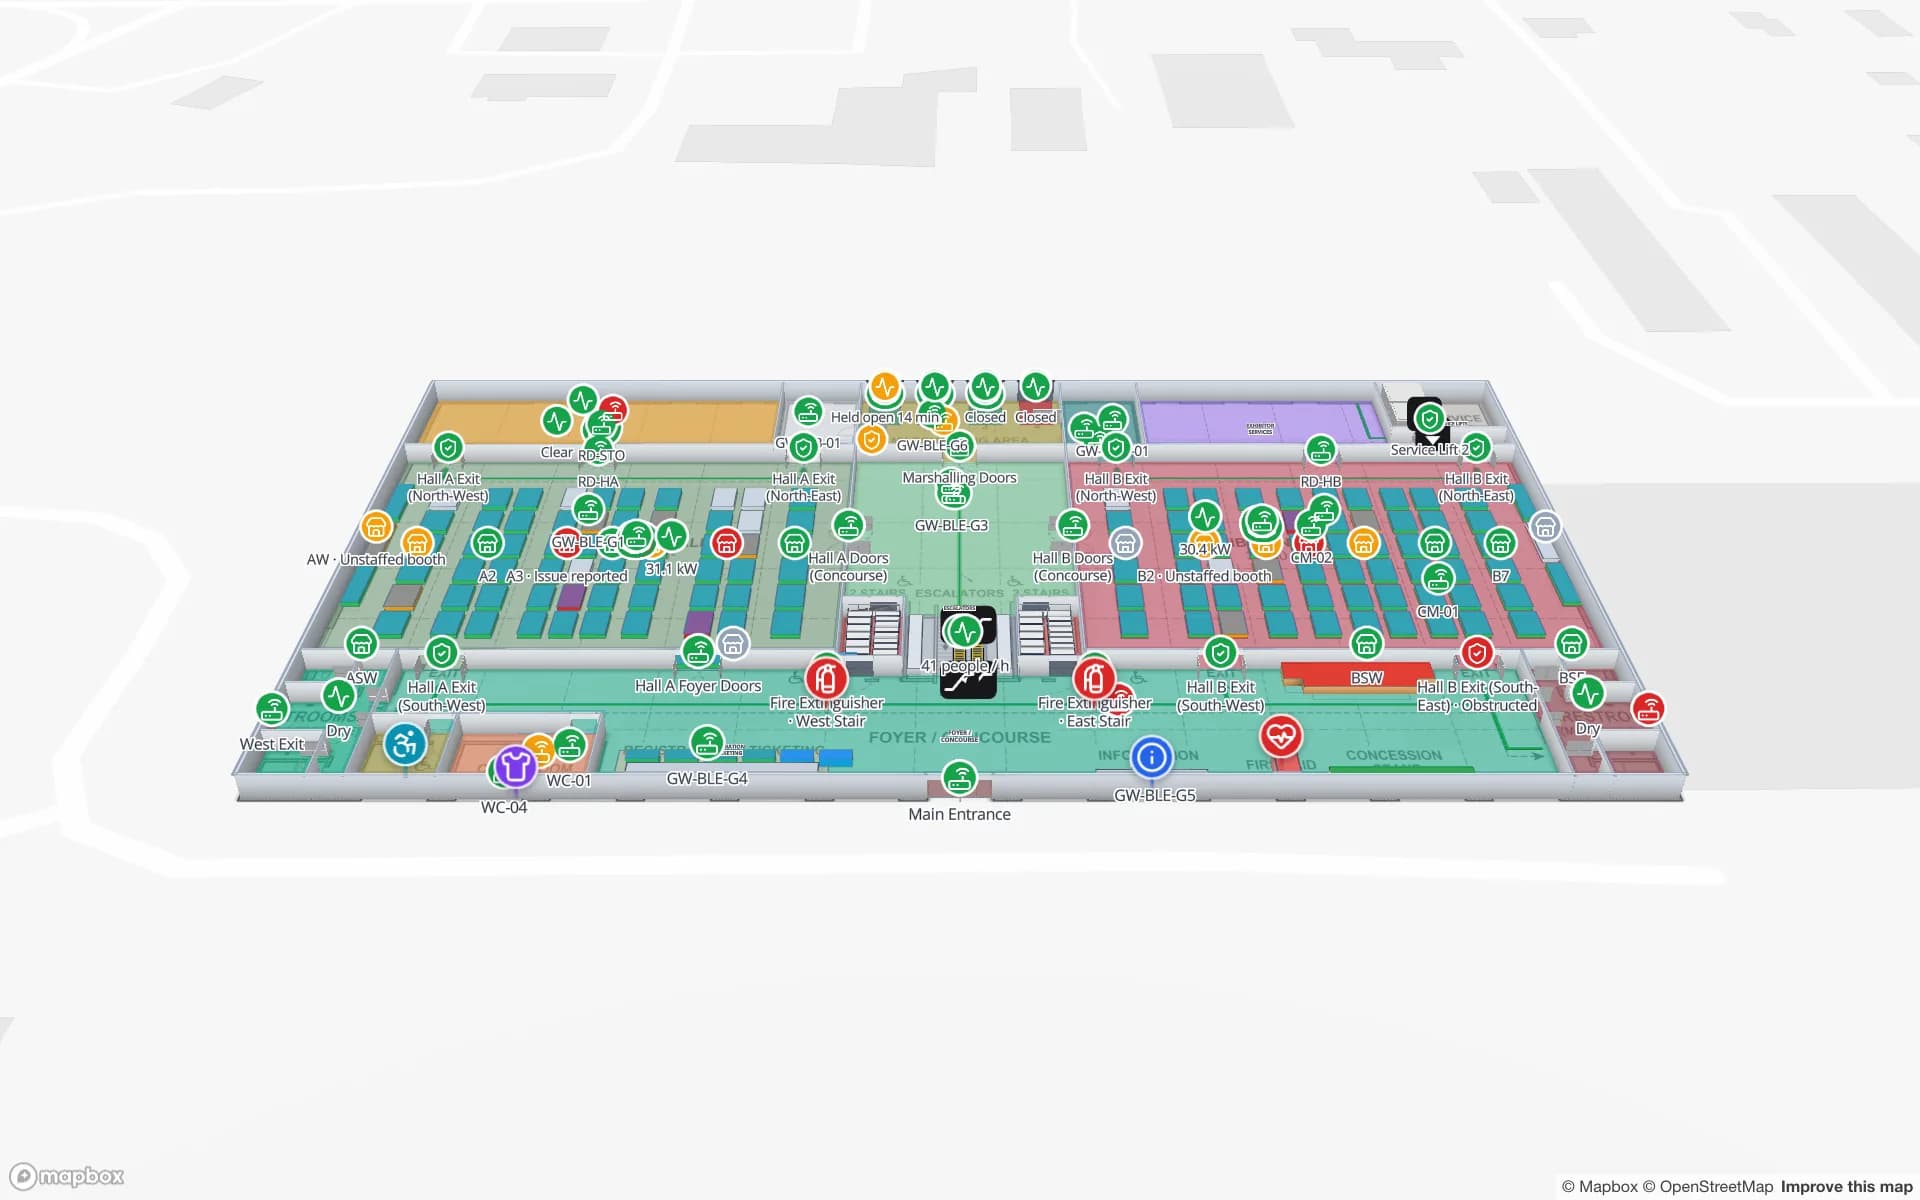
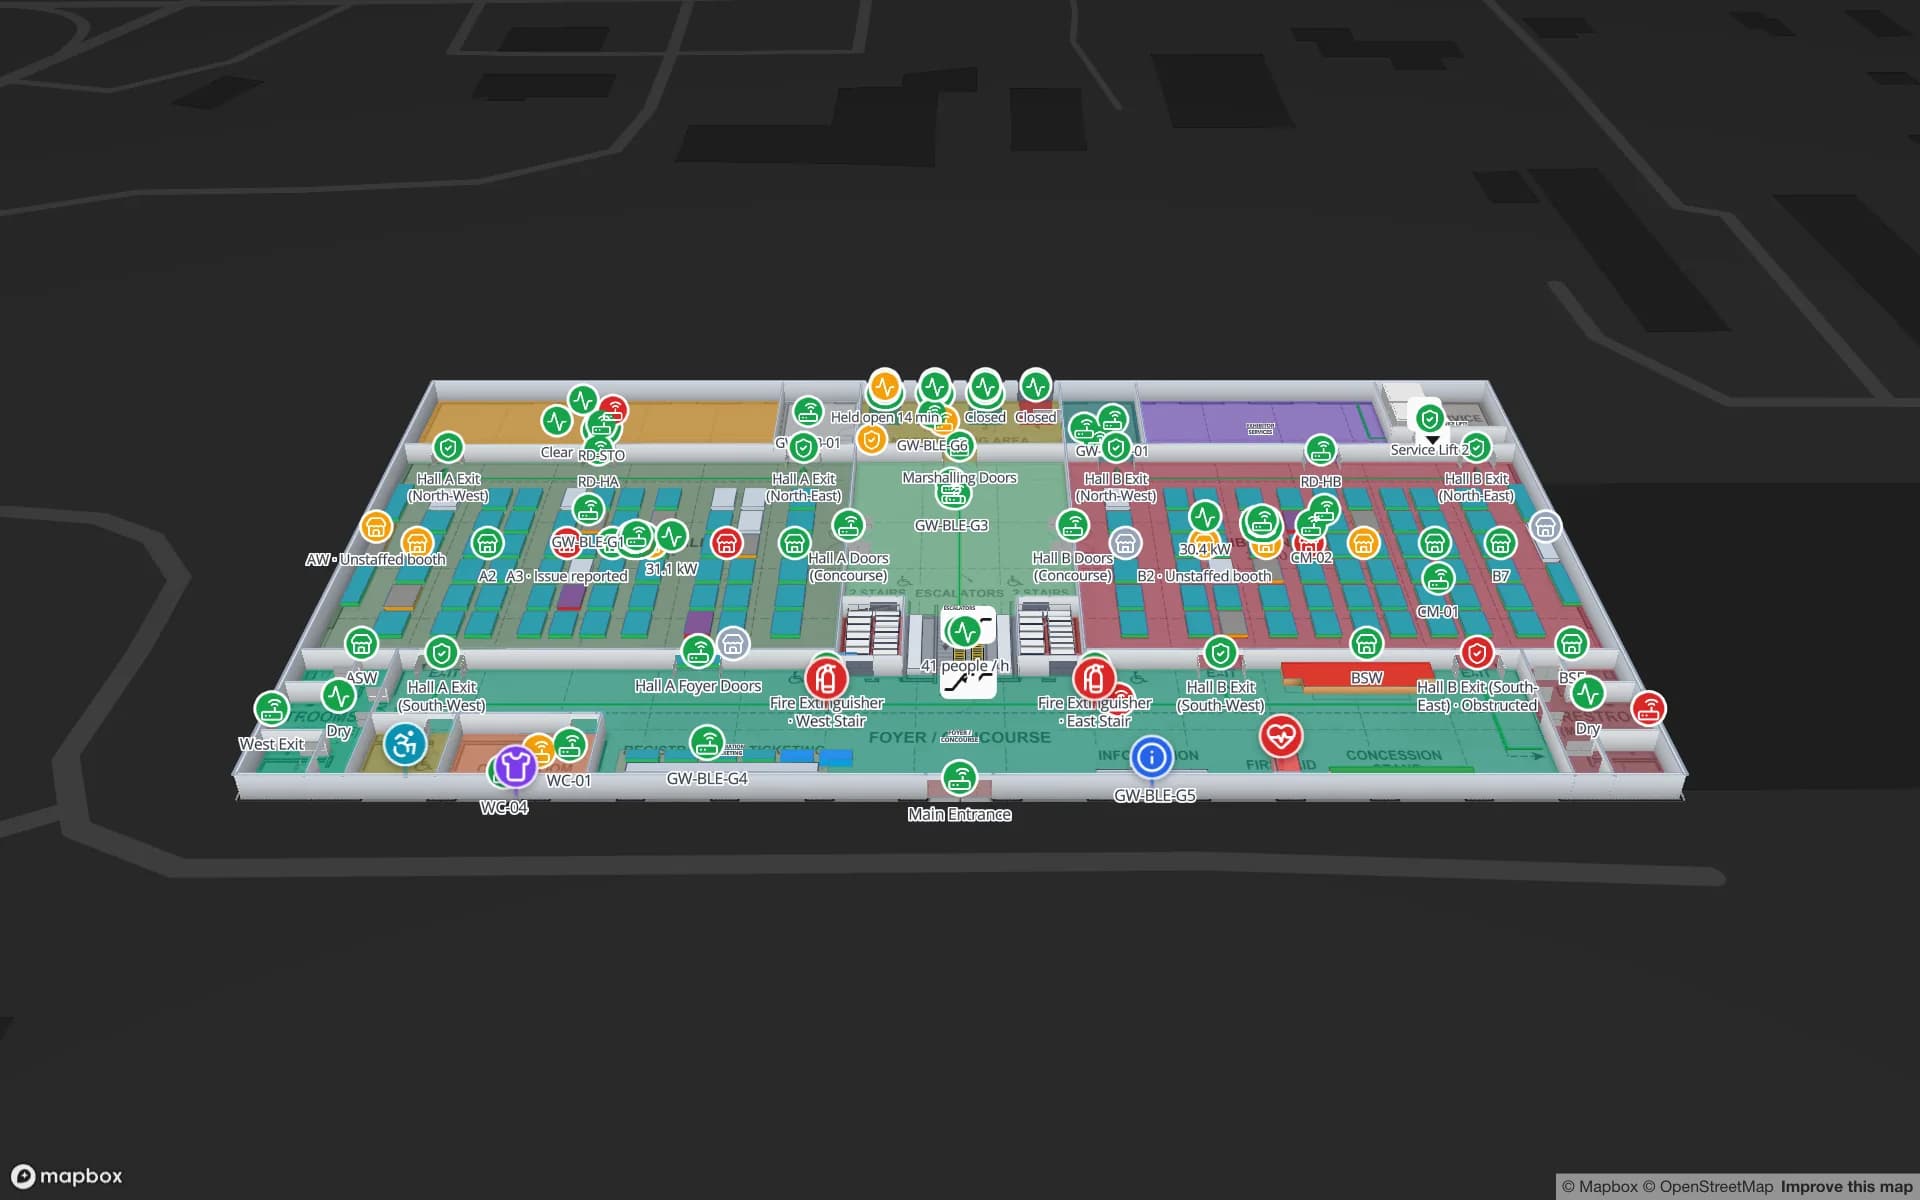
For an events team the assets are stands, screens, AV flight cases, barriers and cabling drums that go in and out of the hall for every show. Tag the cases at the loading dock, read them at the hall doors and the map shows which are inside, which are in the store and which are still on a truck; the Lakeside demo shows halls, booth blocks and loading docks. Equipment pools like this sit well in the asset tracking pattern: a register, a last-seen area and an overdue colour.

Orbassano: the interport where returnable containers change trains

The terminal at the Orbassano interport, south-west of Turin, covers about 100,000 m², according to the Piedmont Region’s March 2022 announcement of works that add about 10,000 m² of yard and lengthen two tracks to 750 m, the first of that length in the Orbassano rail complex, over 730 days. Whatever the final layout, the yard is where containers and returnable racks change from road to rail.

A rail or road terminal is a yard problem: which container is on which track, which trailer is waiting at which gate, which rack went to which customer. Draw the yard as slots and tracks, tag containers and racks, and read them at the gate and the loading lane. The Eastport demo shows 44 yard slots, 50 dock doors and 1,180 RFID pallets through a cross-dock, and the post on cross-dock yard visibility walks through it. Spatial Map does not connect to rail or terminal systems; it shows what your own reads say.

Caselle: the freight clock at the airport

Turin-Caselle airport lists a 3,300 m runway, a maximum turnaround of three hours for a Boeing 747 freighter and cargo cut-offs of 1h30 before departure for domestic flights, 2h30 for EU flights and 3h30 for extra-EU flights, with the apron within a few metres of the warehouse. Those cut-offs are the deadlines for a shipper’s own stock: the goods, the cages and the pallets must be staged and documented before the clock runs out.

Put each staged consignment in a table with its flight and cut-off, draw the staging area as lanes, and an alert rule on rows still marked ‘staging’ for N minutes flags them in the app, so a supervisor can compare them with the cut-off; there is no email, SMS or push. The Crestline demo shows staging lanes in front of docks. Spatial Map does not connect to airline or airport cargo systems, and the reads and statuses come from your own.

Services for teams in Turin

Turin teams usually follow one of these starting points:

  • Supplier plants start with asset tracking for dies, fixtures and returnable racks, then link it to inventory tracking for finished goods.
  • Interport, rail and air-cargo teams start with the yard and the gate, then add RTLS and UWB only where vehicles and people must be located continuously.
  • Events and exhibition teams start with equipment pools and a hall plan, often before any hardware is bought.
  • If you have no readers or tags yet, our team can source them on request, quoted per project, with warranty and device support from the manufacturer: see hardware and demo kits on request.
  • ERP and MES integrations, handheld apps and an asset management system are built as client projects. The product runs as cloud or on-premises, which matters where a customer requires data to stay inside your own network.

Also served nearby

The same page covers Orbassano, Rivalta di Torino, Grugliasco, Beinasco and Moncalieri around the city, Settimo Torinese and Chivasso to the north-east, and the Caselle area. The map opens in a browser at any of them. Italian-language text is on the Italian version of the Italy page.

How Spatial Map does it

Building a Turin asset map

  1. 01

    Load the asset register

    Upload a CSV or Excel list of dies, fixtures, racks and gauges with tag IDs, owners and home locations as a table.

  2. 02

    Map the plant and the yard

    Import the plant or yard plan, draw stores, press lines, gates and tracks as areas named like your readers and gateways.

  3. 03

    Connect reads

    RFID middleware, BLE gateways and your ERP post rows through the write API or a polled REST endpoint.

  4. 04

    Add return and cut-off rules

    In-app alerts for assets overdue at a customer, containers short of a loading lane and consignments not ready before cut-off.

Where Turin teams track assets

Dies, fixtures and WIP carriers

Last-seen store or line, overdue return and calibration dates coloured on the plant plan.

Returnable racks and rail yards

Containers and trailers by yard slot, track and gate.

Event equipment pools

Cases and stand kit by hall, store and truck.

Plant and office IT

Registers of laptops, test equipment and spares by room and floor.

See it on real demo facilities

Fictional names, real floor plans, live sensors, RFID, BLE tags and gateways — open any of them in the browser.

All 13 demo facilities

Asset tracking in Turin — questions we get

Often RFID at the tool-crib and despatch doors, where an item is checked out and back in, and BLE for the few items you want to find between reads. Spatial Map shows either, as long as your system sends a tag ID with a read point, a zone or a position.

Yes, in a limited way. A read-only share link can lock the floor and the layers and carry an expiry date, or the customer can be given a Viewer role. Both show only what you have chosen to show.

No. It has no link to terminal, customs or airline systems. It shows your own reads, tables and sensors, and it does not write back to your ERP or WMS.

Yes. Developers can post rows to a table through the write API (HTTPS, bearer API key, bulk upsert, 60 requests per minute per key), or Spatial Map can poll a REST endpoint. CSV and Excel uploads also work.

Not yet. It is in English, Spanish, French, German, Arabic and Chinese; supplier names, part numbers and notes you write can be in Italian. There is an Italian version of the Italy page.

No. Spatial Map is sold online and our team works with customers in Italy remotely, by video call and through the contact form, in English. There are no local resellers or partners.

In US dollars, the same worldwide: a 7-day free trial for up to 5 facilities with no card, then Pro at $60 a month or $600 a year for up to 4 facilities. RFID hardware, if you ask us to source it, is quoted per project and is not part of the subscription.

Track one shared-tooling pool first.

Start the free trial and open the Summit demo, or send us your asset list and the plan of a plant or yard through the contact form.