Toronto · Peel, Pearson cargo and the intermodal terminals

Warehouse tracking in Toronto, from the Pearson cargo apron to the Peel dock door

Spatial Map shows where pallets, trailers and forklifts are inside a building, on a live 3D map that reads the counts, scans and RFID events your own systems produce. Warehouse tracking in Toronto is mostly warehouse tracking in Peel: Mississauga, Brampton and Caledon hold the sheds that sit between the 400-series highways, the airport and the rail yards. The map is a layer on top of your WMS, not a replacement, and each building can have its own.

No credit card. Runs in the browser. Pro is $60/month for up to 4 facilities. Book a demo

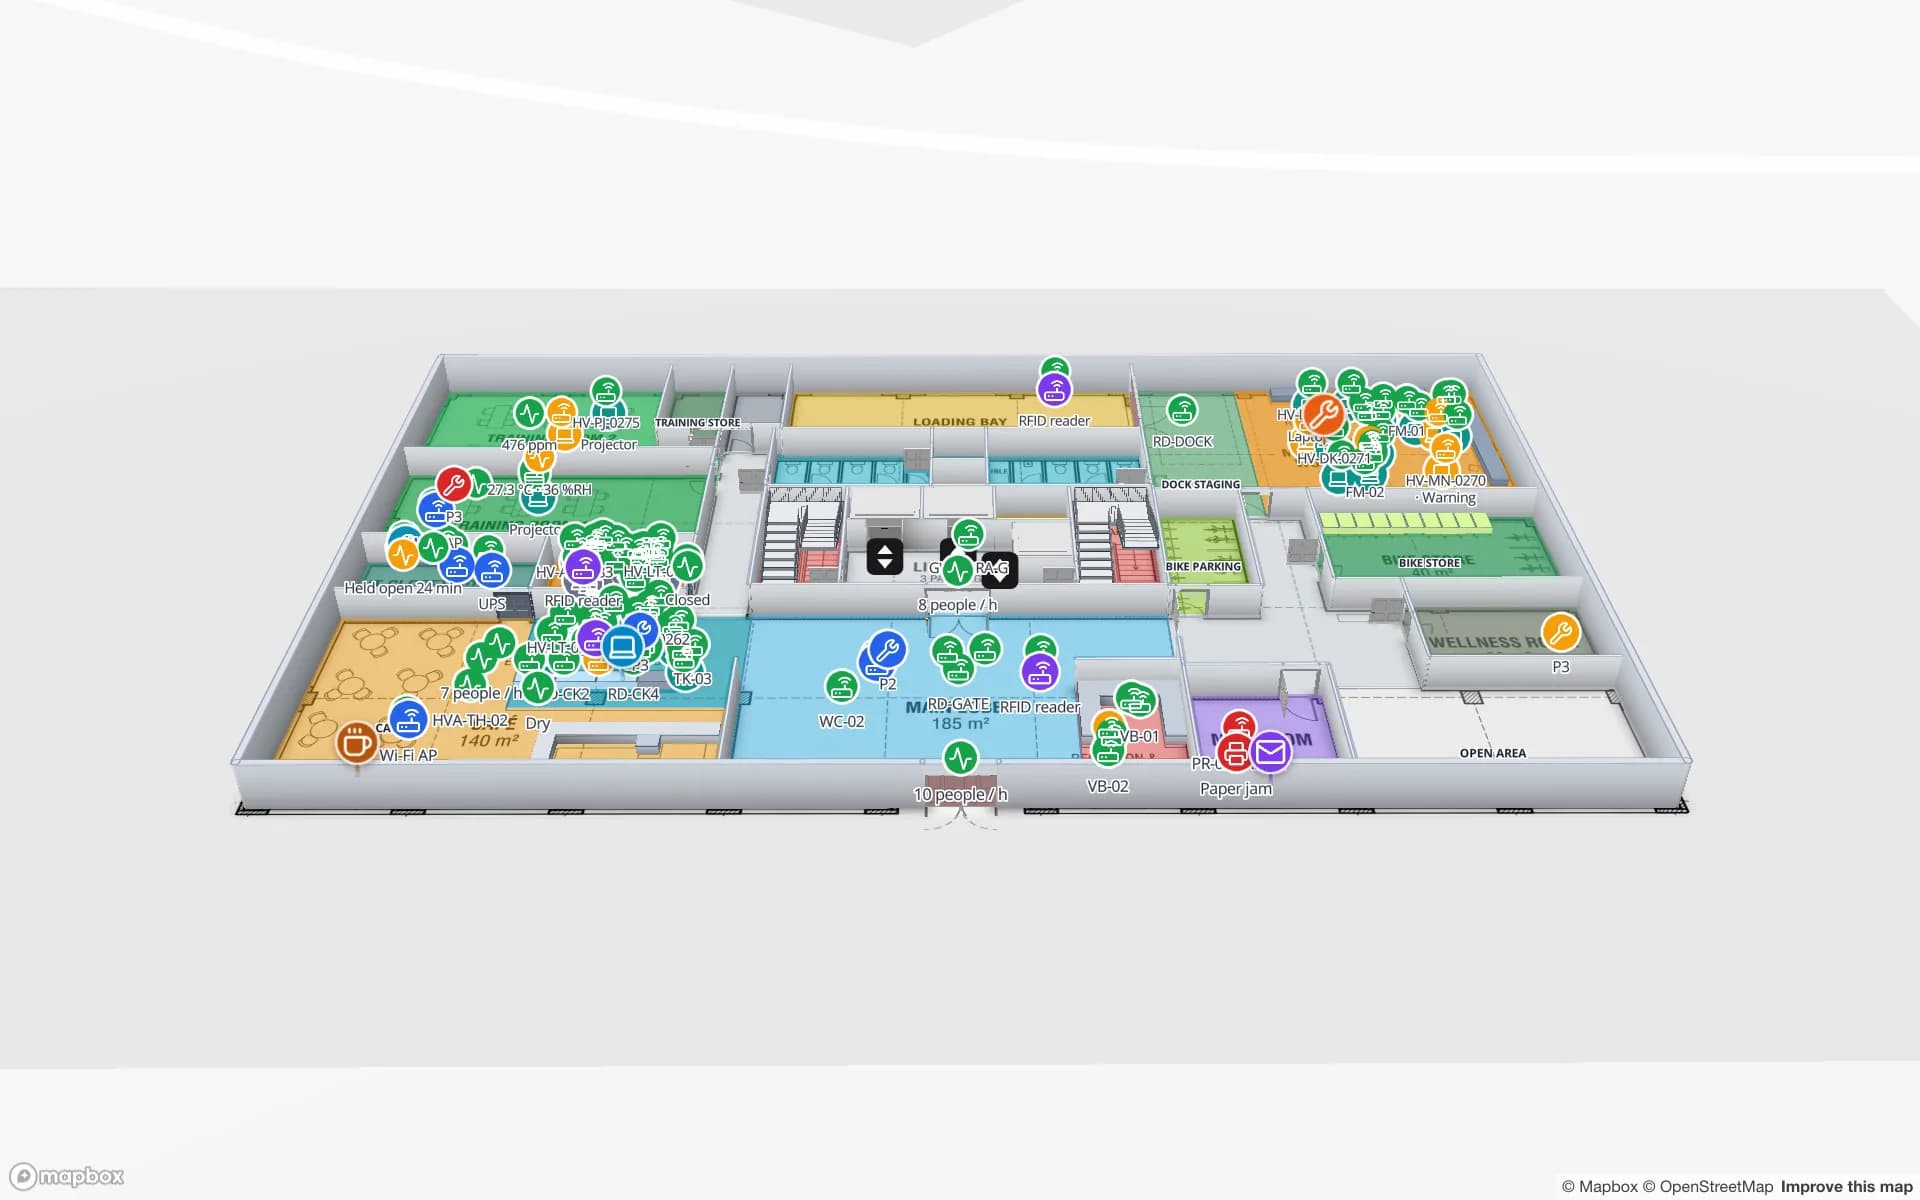
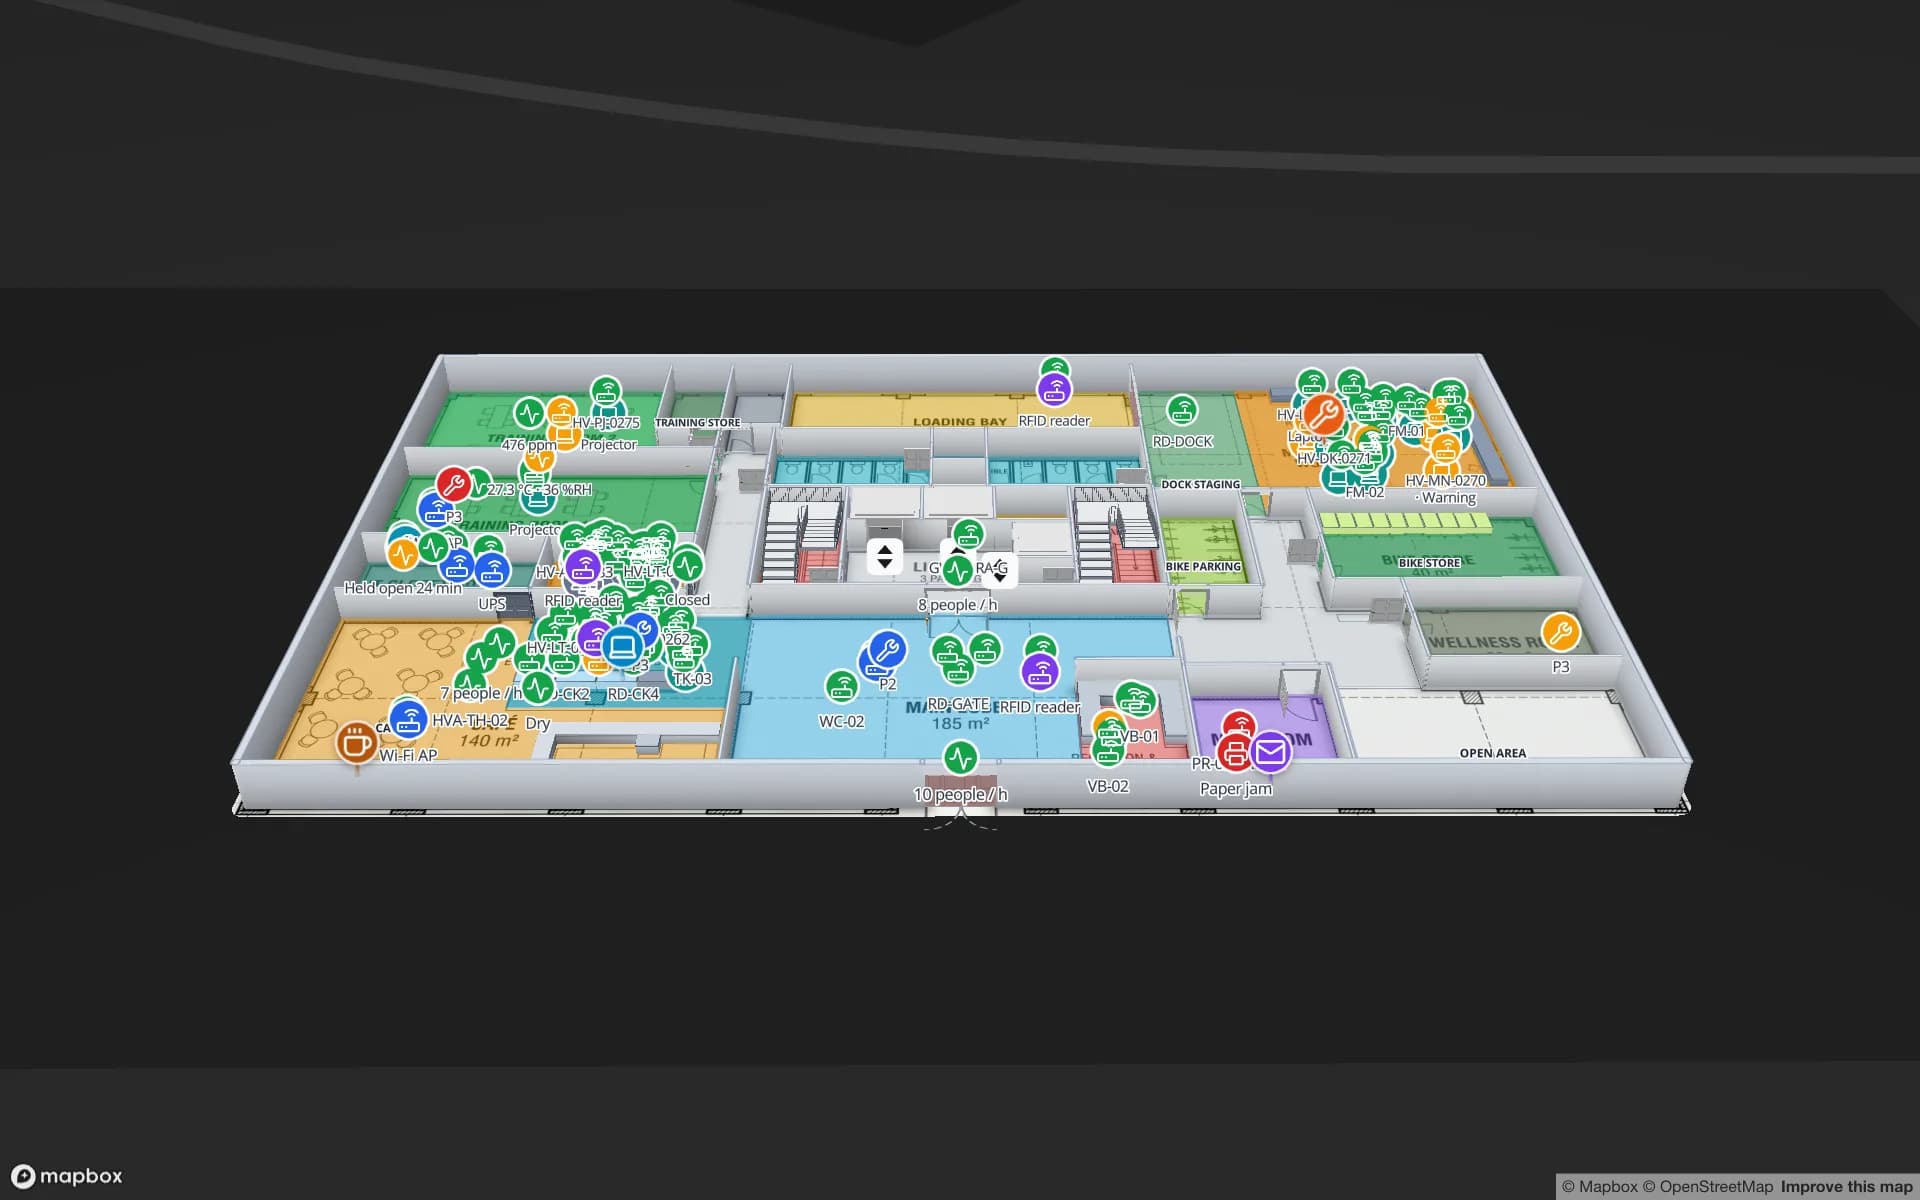
Crestline Fulfillment Center, a fulfillment center demo, in the Spatial Map 3D viewer with live device markers
Crestline Fulfillment Center
Crestline Fulfillment Center, a demo distribution building: 20 racks with 2,204 locations, staging lanes, packing and the trailer yard.
Rack locations in the Crestline demo
2,204
Dock doors in the Eastport cross-dock demo
50
How often alert rules are checked, with alerts shown in the app
15 s
Free trial, up to 5 facilities, no card
7 days

Peel: a region whose jobs depend on moving goods

The Region of Peel, made up of Mississauga, Brampton and Caledon, says on its goods-movement page that 4 in every 9 jobs in Peel depend on the movement of goods, and that approximately 68,000 vehicles carry goods along its roads. It has a long-term goods-movement plan that runs to 2041, and a Peel 2051 employment planning report lists goods movement, warehousing and logistics among the predominant employment types.

A building in that setting is rarely one company’s. Third-party logistics sheds hold several clients’ stock under one roof, with a WMS that knows every bin and a floor team that still walks the aisles to find a pallet. Spatial Map puts each rack location, staging lane, dock door and trailer on one map and colours them from your WMS rows. The Crestline demo has 20 racks and 2,204 locations coloured by stock status, with the trailer yard beside the docks. Each client can be given a read-only share link limited to the floors and layers you choose, with an expiry date and a view cap, so they see their own area without an account. The post on a warehouse digital twin versus a WMS explains where the map stops and your WMS carries on.


Pearson’s cargo buildings: the flight is the deadline

Toronto Pearson says its cargo facilities are rated to process 1 million metric tonnes a year, that it handled about 500,000 metric tonnes in 2024, and that its cargo network reaches 175 destinations. Around the airport, forwarders and handlers build consolidations from cartons and pallets that arrive from many senders and leave on one flight, and a piece that misses the cut-off waits for the next one.

Tag each carton or pallet at receiving, read it at the door of the build-up area, and the map shows which pieces of a shipment have arrived, which are staged in the right lane and which are still on the road. A “matches for N minutes” alert rule raises an in-app alert when a pallet has sat in a staging lane for too long, and Show on map takes the supervisor to it. The Eastport demo shows 50 dock doors, 44 yard slots and 1,180 RFID pallets on one map. Spatial Map does not connect to airline, customs or airport systems; it shows what your own reads and tables say about your own building.

Intermodal terminals and the transload shed

A Peel Region report lists the Brampton intermodal terminal among the rail infrastructure in Peel, and a second national railway terminal sits just across the boundary in Vaughan. Containers come off the train at those terminals, travel a short way by truck to warehouses nearby, and are unpacked there; the goods are then re-sorted onto pallets and trailers for delivery. That unpacking step is where a container number turns into many pallet numbers, and where a mix-up is easiest.

Read the container ID or its label when the doors open, read the pallet labels as they leave the container, and the map links one to the other in your table. Yard slots show which trailer waits at which door, and the History player replays the night shift when a pallet is queried. The post on cross-dock yard visibility covers the dock-door and yard pattern in detail, and RFID gates explains how a row of readers at a door becomes a checkpoint.

Caledon and the new build: start from the drawings you already have

Caledon’s 2025 background report for its logistics land-use study flags development pressure for warehousing, distribution centres and truck-based logistics. New distribution buildings arrive with fresh CAD drawings, which makes mapping the easy case. Upload the PDF or DWG (AutoCAD R2004–R2018, placed as a picture), align it at real scale, and let AI Map draft racks, walls, doors and areas for a person to review. AI Map is available on paid plans and the trial, with a monthly limit.

Older buildings in Mississauga and Brampton often have drawings that stopped matching the floor after the last racking change. Start from a photographed plan or a quick sketch of the aisles instead. Once the racks are drawn, a heatmap of read events shows which lanes carry the most traffic, and it stops at walls, so a busy aisle does not appear to glow through the shelving; see warehouse heat maps.

Services for teams in Toronto

Teams in Peel and around the airport tend to start in one of three places:

  • Third-party logistics operators start with inventory tracking: rack locations from the WMS, then RFID or handheld counts at the docks, with a share link for each client.
  • Forwarders and transload operators start with RFID warehouse management at dock doors, where the container-to-pallet link is made.
  • Asset tracking follows for forklifts, returnable totes and pallets, and RTLS and UWB is for the few buildings where vehicles and people must be located continuously.
  • If you have no readers or tags yet, our team can source RFID, BLE and UWB devices on request, quoted per project, with warranty from the manufacturer: see hardware and demo kits on request.
  • Where a handheld app or WMS connector is missing, our team builds Android RFID handheld apps, ERP and WMS integrations and other custom software as client projects. The product runs as cloud or on-premises.

Also served nearby

The same page covers Vaughan, Markham, Milton, Oakville, Burlington and Hamilton, and the distribution parks along the highways between them. Nothing needs to be installed on site: the map opens in a browser, in English or French.

How Spatial Map does it

From a Peel shed to a live map

  1. 01

    Pick one building

    The shared shed, the transload door or the airport-side build-up area where a lost pallet costs most.

  2. 02

    Draw racks, lanes and doors

    Upload the plan or a photo, let AI Map draft it, and name the locations the way your WMS does.

  3. 03

    Connect stock and events

    The WMS and RFID middleware post rows through the write API, or Spatial Map polls a REST endpoint; CSV and Excel work for a start.

  4. 04

    Add staging and silence rules

    In-app alerts for pallets staged too long and readers that stopped reporting, plus a read-only link for each client.

What Toronto-area teams track

Multi-client distribution centres

Rack-level stock from the WMS, packing output and the trailer yard, with a read-only view per client.

Air-cargo build-up and consolidation

Dock doors, staging lanes and pallets against a flight cut-off.

Intermodal transload sheds

Containers unpacked, pallets labelled and trailers matched to doors.

Forklifts, totes and returnable pallets

Equipment pools located by zone, with overdue items coloured on the plan.

See it on real demo facilities

Fictional names, real floor plans, live sensors, RFID, BLE tags and gateways — open any of them in the browser.

All 13 demo facilities

Warehouse tracking in Toronto — questions we get

It shows the building. Your WMS knows what should be where; the map shows rack locations, staging lanes, dock doors and trailers in place, coloured from the rows your WMS sends. Spatial Map does not write back to the WMS or ERP, so the WMS stays the record.

A read-only share link can carry an expiry date, a view cap, a floor lock and a choice of layers, and a data link can filter rows, for example by a client code, so a layer shows one client’s stock only. See data link filters. Clients need no account.

No. A CSV or Excel list of bins with their contents already gives a live rack map, and handheld counts can update the same table. RFID at the dock doors is usually the first upgrade, because that is where pallets are lost. RFID vs barcode in the warehouse helps you decide.

No. It has no link to airport, customs, terminal or railway systems. It shows what happens inside your own building from your own reads, tables and sensors, so it complements those systems rather than replacing them.

No. Spatial Map is sold online and our team works with customers in Canada remotely, by video call and through the contact form, in English or French. There are no local resellers or partners.

In US dollars, the same worldwide: a 7-day free trial for up to 5 facilities with no card, then Pro at $60 a month or $600 a year for up to 4 facilities. Larger networks are quoted as custom services; RFID hardware, if you ask us to source it, is quoted per project.

Map one Peel dock door before the next peak.

Start the free trial and open the Crestline demo, or send us the plan of a distribution building and a sample of your WMS rows through the contact form.