
Warehouse heat map: from an Excel template to a live floor plan
Warehouse heat map options compared: Excel and BI grids vs a live map heatmap for pick density, slotting, congestion and travel — and why heat stops at walls.
Four things people mean by a warehouse heat map
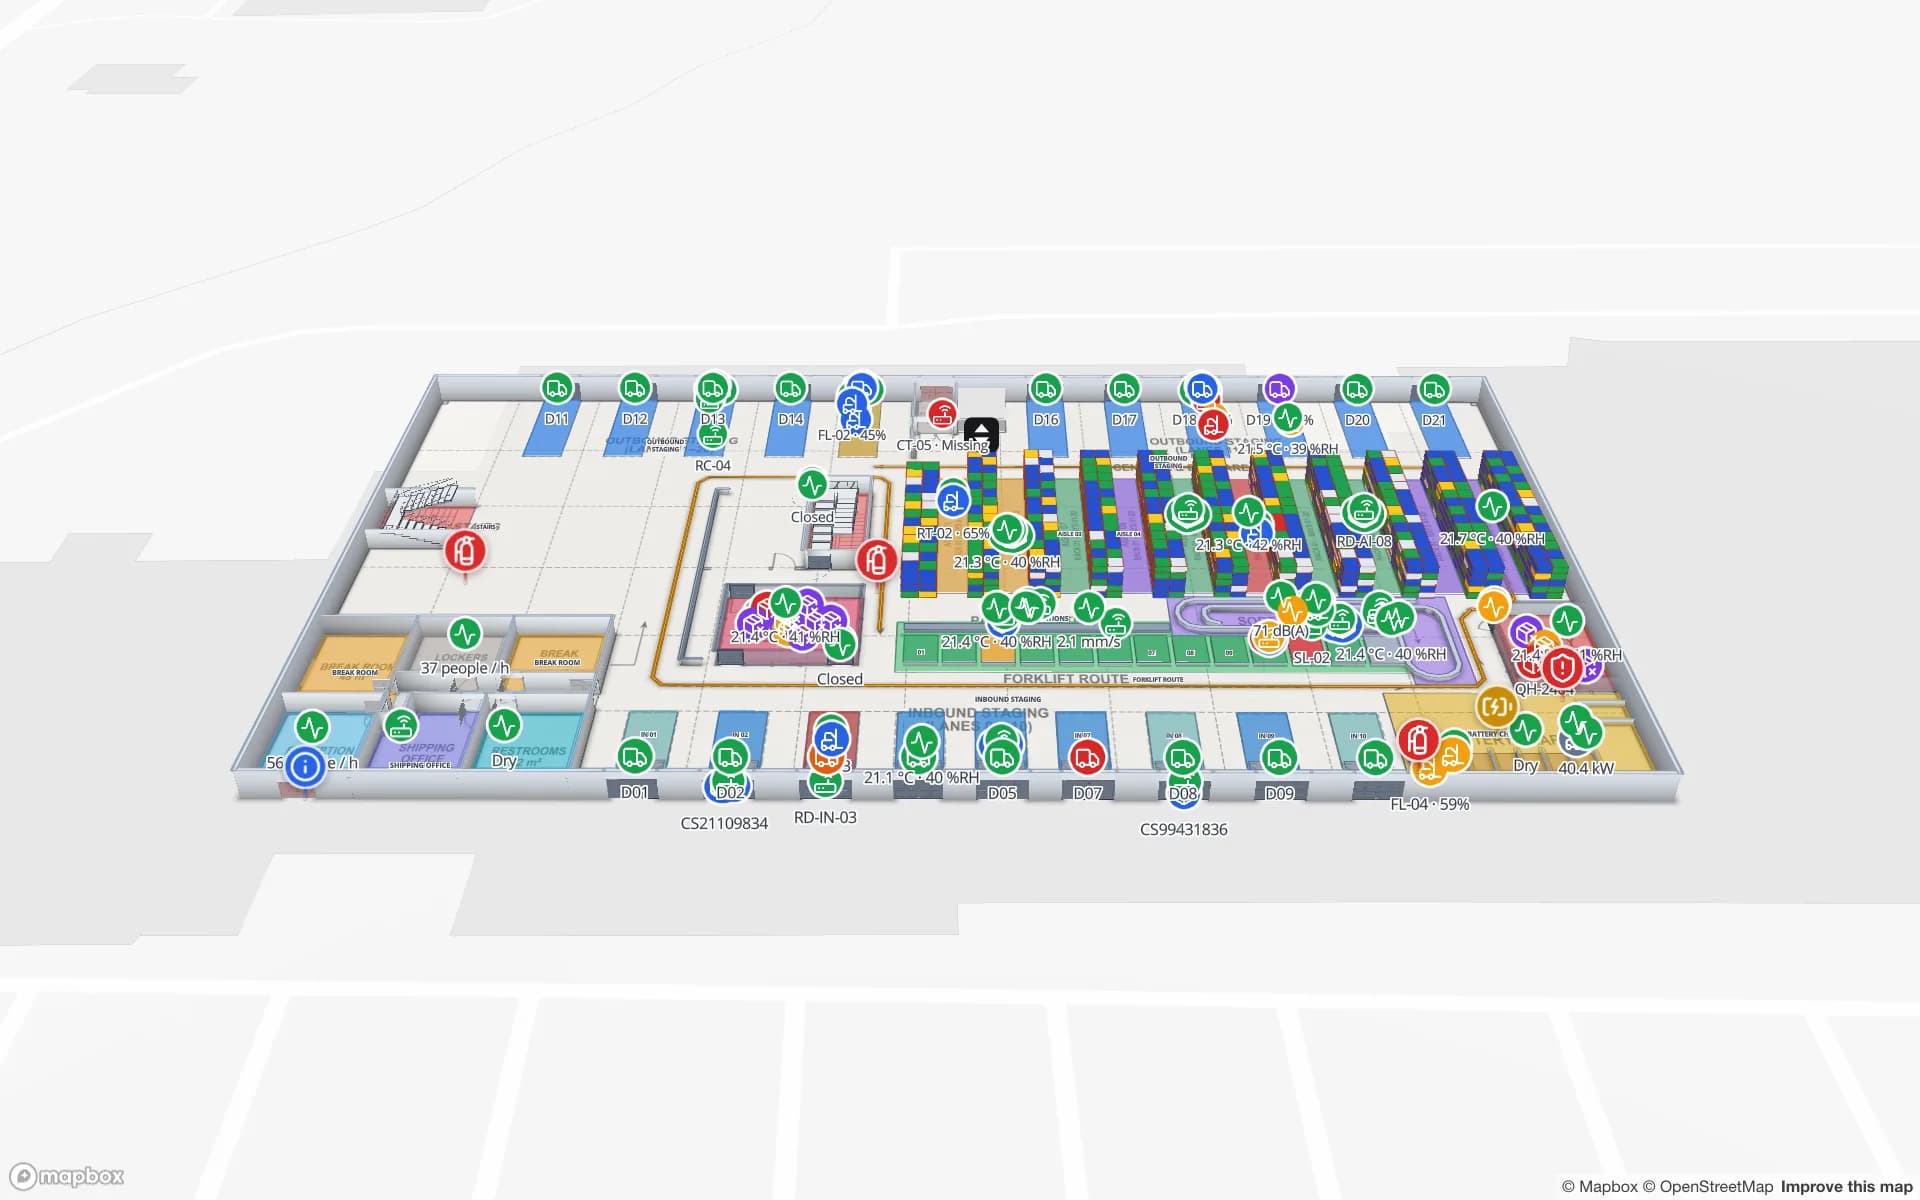
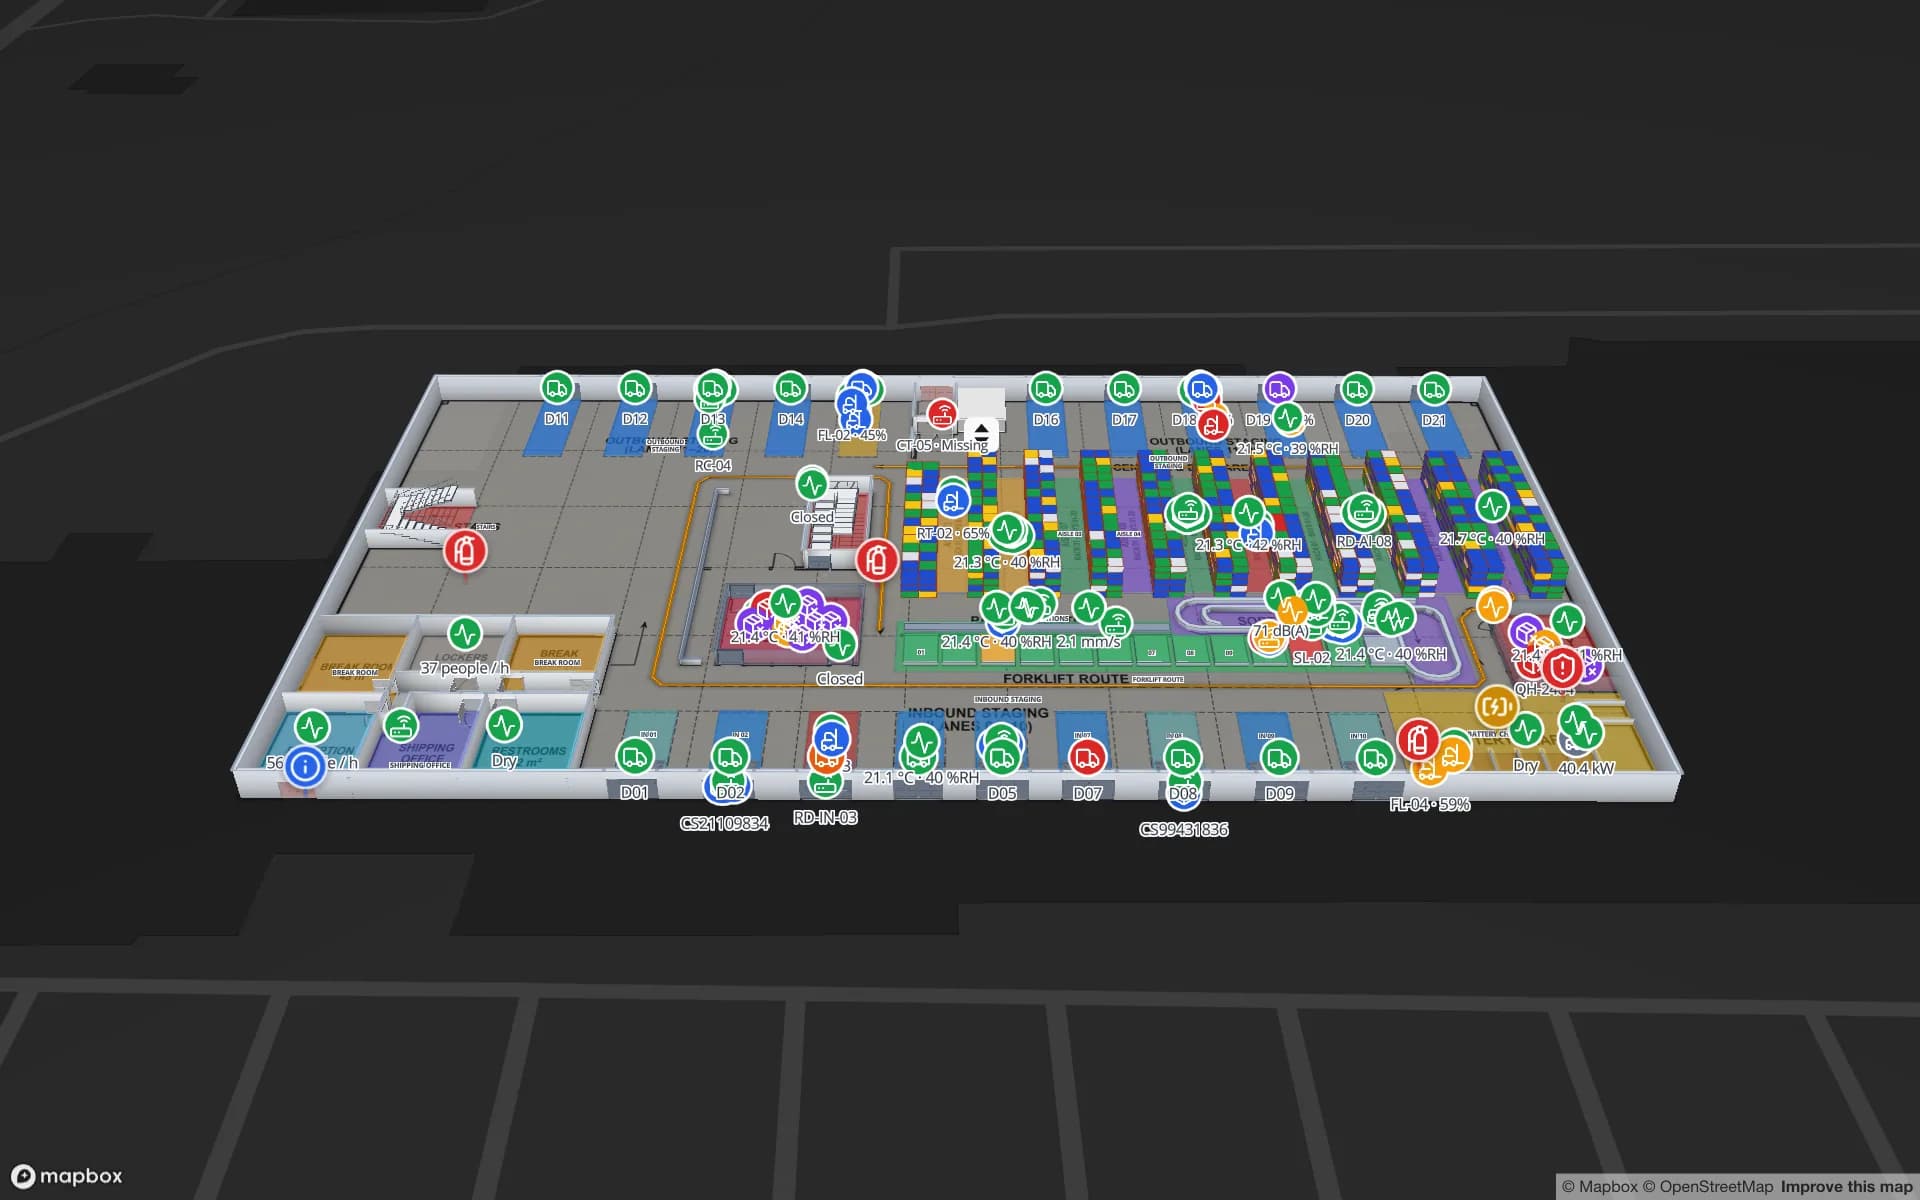
Spatial Map is a live indoor map for warehouses and other facilities, and it can show any layer of points as a heatmap on the floor plan. But a warehouse heat map is not one thing. Ask four operations people what theirs shows and you will get four answers:
- Pick density — how many pick lines each location or aisle served over a period. The classic input to slotting.
- Congestion — where pickers, forklifts and carts bunch up, and when.
- Travel — which paths people actually walk or drive, and how far.
- Stock and space — which locations are full, empty, low or blocked right now.
The Excel or BI heat map
The common template is a grid: aisles across, bays or levels down, each cell holding a pick count exported from the WMS, coloured with conditional formatting. Power BI, Tableau or Looker do the same with a matrix visual or a picture of the layout behind it. For a quarterly slotting review this is often all you need.
| Spreadsheet / BI heat map | Live map heatmap | |
|---|---|---|
| Set-up | An export and a template — an afternoon | A traced floor plan and a data link |
| Data | A snapshot of a period | What the table holds now, refreshed as rows change |
| Layout | A grid that drifts from the real building over time | The real floor plan, walls, doors and floors |
| Positions (people, trucks) | Hard to show | Native: one point per position |
| Best for | Slotting analysis, ABC reviews, one-off reports | Congestion, live stock, sensors, daily operations |
Where spreadsheet heat maps go wrong
- The grid is not the building. Templates draw every aisle the same length and ignore cross-aisles, mezzanines and the dock. Travel looks shorter on paper than on the floor.
- Locations get renamed. After a re-rack, half the codes in last quarter’s export point at cells that no longer exist, and the template quietly drops them.
- Picks are not effort. A pick from the top level of a high-bay rack costs more than one at waist height; weight by level or by handling time if you can.
- One snapshot, then nothing. The heat map is built for a meeting and never refreshed, so the slotting it justified is never checked.
None of this makes the spreadsheet wrong for slotting. It means a spreadsheet answers “what happened last quarter?”, and a map answers “what is happening now, and where exactly?”.
Which data for which heat map
| Question | Data | Weight | Typical period |
|---|---|---|---|
| Which locations are hit hardest? | Pick lines per location from the WMS | Pick count per location | 4–13 weeks |
| Are fast movers in the right place? | Velocity per SKU joined to its location | Picks or units per day | A season |
| Where do forklifts and pickers bunch up? | Positions from your RTLS, one row per tag | Number of positions | Hours or a shift |
| Where are the docks and lanes busiest? | Dock events, pallets staged per lane | Pallets or minutes of dwell | A day or week |
| Which areas are full right now? | Stock per location | — colour each cell instead | Now |
Two notes. Positions come from your RTLS, BLE gateways or RFID middleware; Spatial Map shows them but does not compute them from radio signals — see RTLS software for how that split works. And for “which areas are full right now”, a density heatmap is the wrong tool: you want each rack location coloured by its own value, which is a style rule on the rack cells, as in CSV bin inventory to a live rack map.
How the heatmap works on a Spatial Map floor plan
In the facility viewer and on report maps, the Heatmap control turns any point layer into a heatmap. Its options are short:
| Option | What it does |
|---|---|
| Off · Heatmap and items · Heatmap only | Markers only; heat with the markers on top; or just the density |
| Layers | Tick several point layers; each glows in its own colour, so forklifts and pickers can share one map |
| Weight | “Number of items”, or a number field of the layer’s table — picks, pallets, minutes. Weighting by a number works with one layer |
| Floors | One floor at a time; stacked floors would blur into each other, so the viewer asks you to pick one |
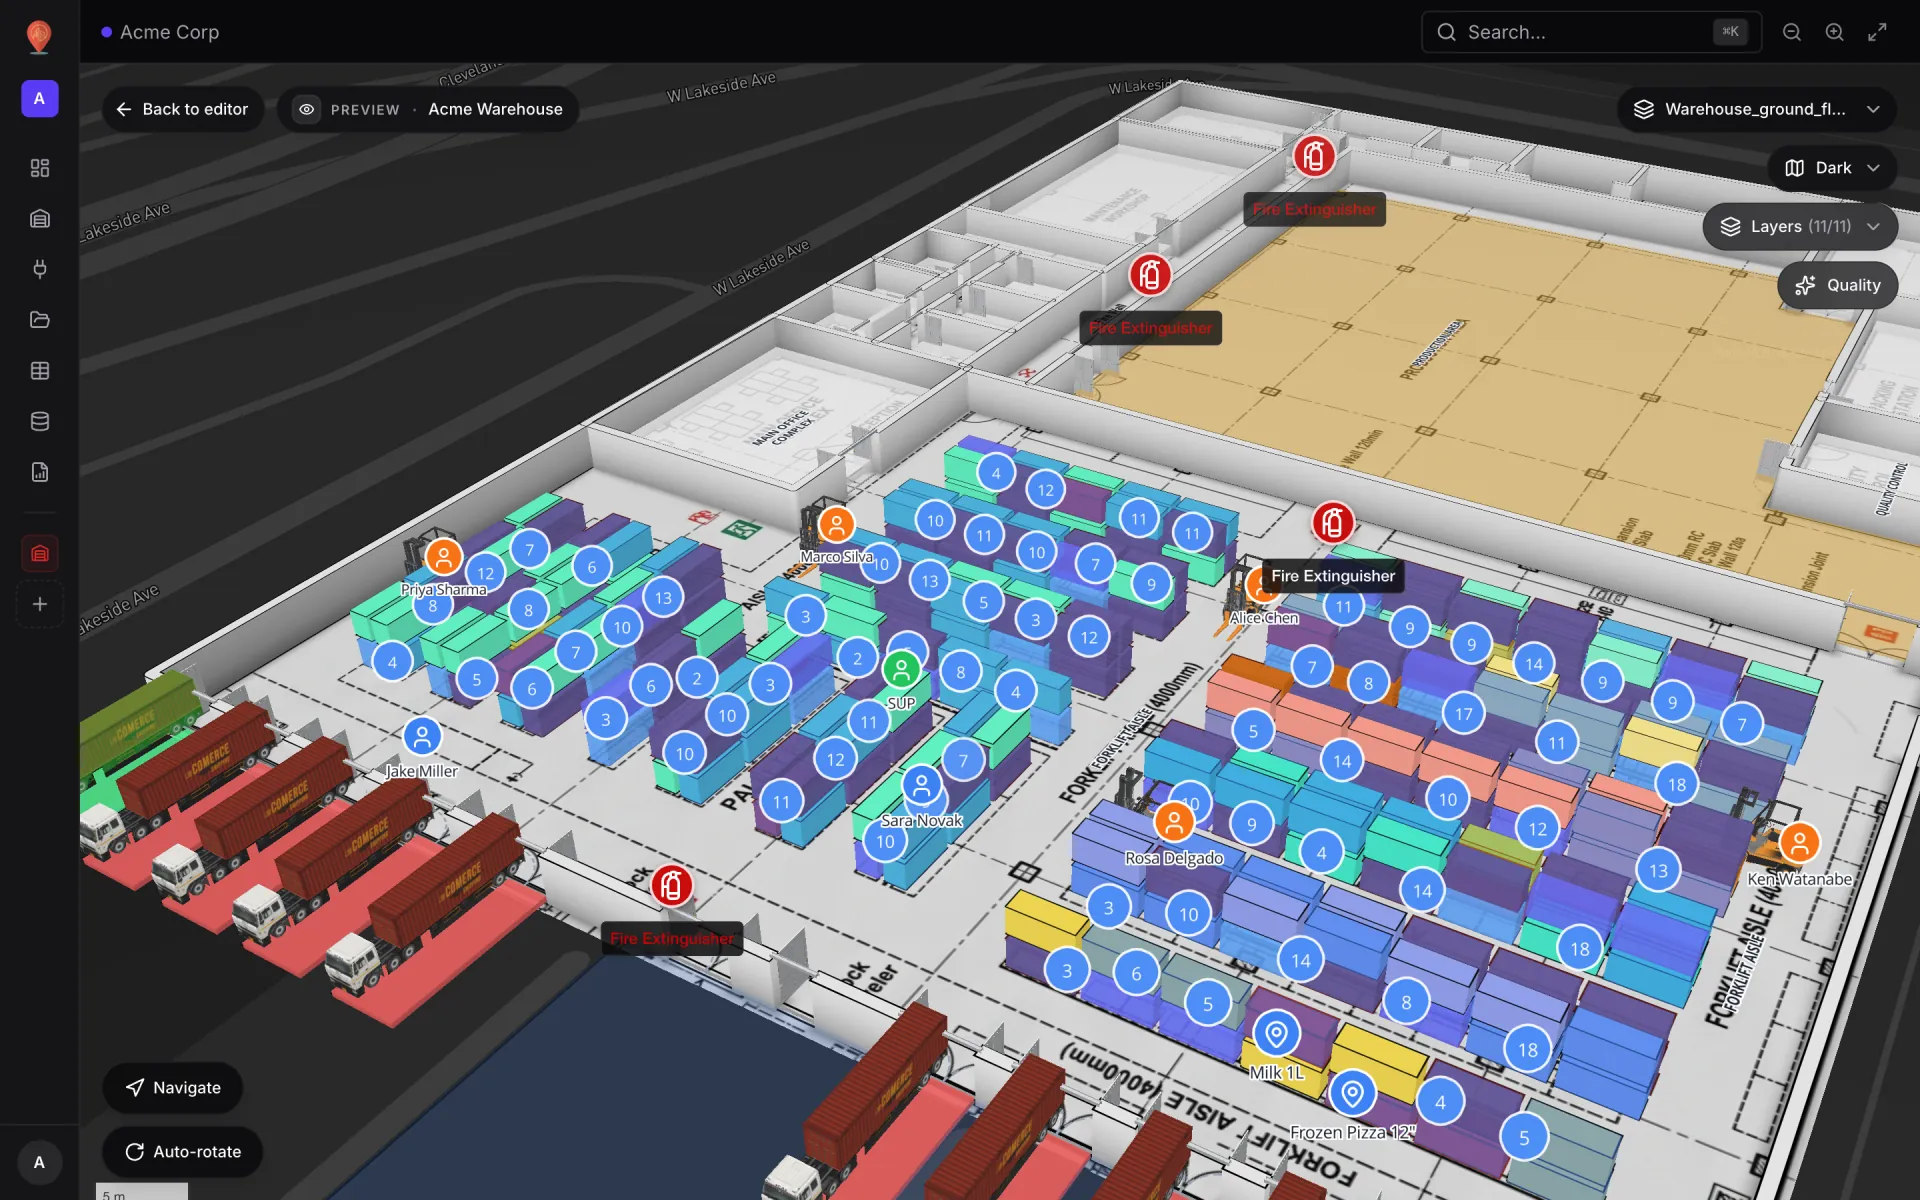
The detail that matters most in a building: heat stops at walls and closed doors. A busy packing room does not glow into the quiet returns room behind its wall, and a cold store behind a closed door stays its own space. When you tilt the map in 3D, heat behind a wall is hidden rather than painted over it. More on the feature on the indoor heatmap software page.
Setting it up
- 1Trace the warehouse once
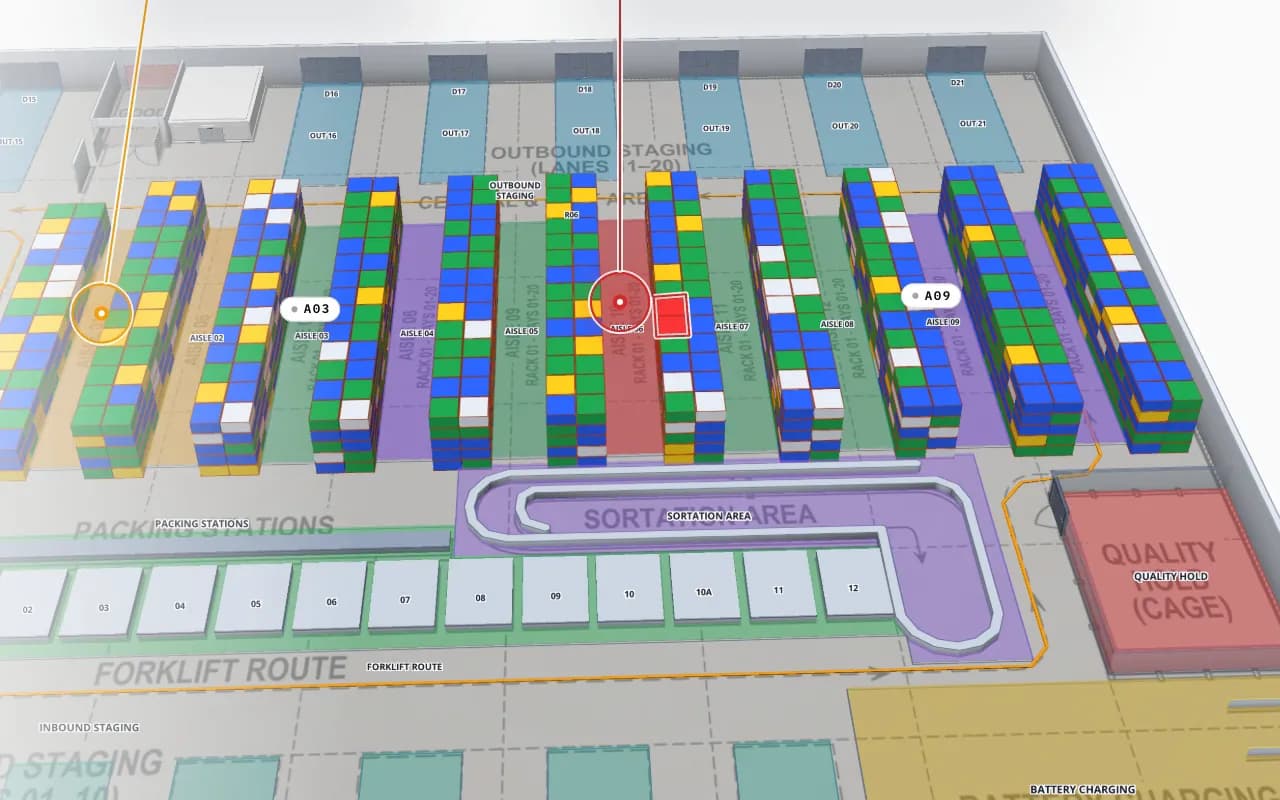
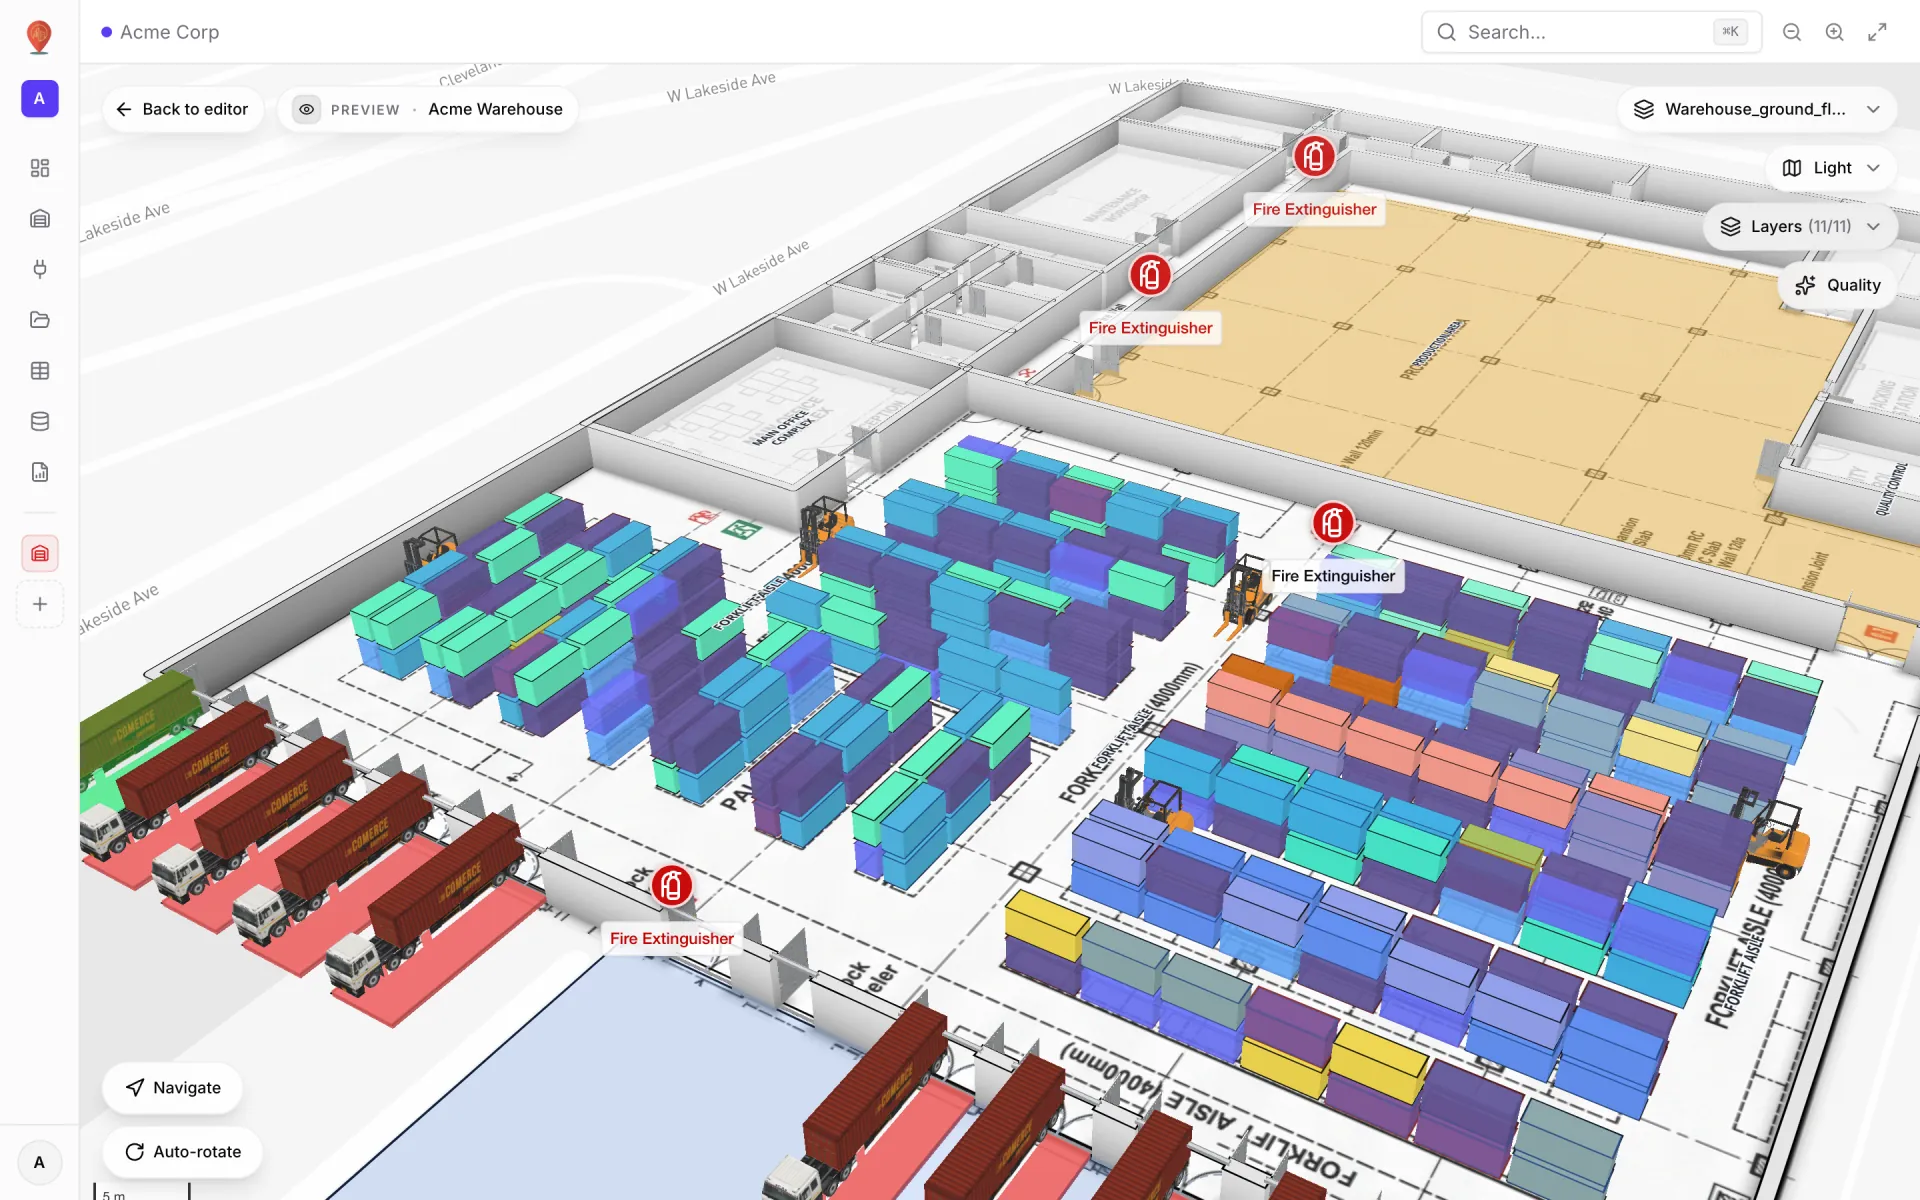
Import the floor plan, draw the walls, doors, racks, docks and staging lanes. Rack locations get the same codes your WMS uses.
- 2Bring the data in as a table
Upload a CSV or XLSX of pick lines per location, let a script write rows through the table’s API, or schedule a pull from a REST endpoint. RTLS positions go into their own table with longitude and latitude.
- 3Link the table to the map
Match rows to rack cells by location code, or place them by coordinates. Add the fields people want in the tooltip.
- 4Turn on the heatmap
In the viewer, pick the layers, choose the weight and the floor. The same control is on a full-map report, for a view the team opens every morning.
Reading a warehouse heat map without fooling yourself
- Normalise before you compare. Two aisles with equal picks are not equal if one has twice the locations.
- Pick the period on purpose. A peak week and a quiet month tell different stories; keep both.
- Mind the gaps. No heat can mean no activity — or no sensor coverage. Check where your readers and gateways are.
- One question per view. Congestion and pick density in one colour ramp is unreadable; use separate layers.
- Act, then look again. After a re-slot, compare the same period before and after.
The Crestline Fulfillment Center demo has the parts to try this on: 20 racks with 2,204 locations, pick modules, staging lanes, docks and forklifts on one map. Start a 7-day free trial to do it with your own layout — no card, up to five facilities; Pro is $60 a month for up to four.
Try the platform your data belongs on.
Spatial Map turns spreadsheets, sensor streams, and CAD drawings into one live 3D facility view — nothing to install, seven-day free trial.
Keep reading
- Use caseOccupancy heatmap: from people counts to a floor planPIR, desk sensors, door counters, Wi-Fi counts — each answers a different occupancy question. This guide picks the sensor for the job, keeps the data private and turns counts into a heatmap on the real floor plan.
- Use caseAirport terminal operations on a live map: RFID bag tags, queues and gatesA terminal runs on hand-offs: from check-in to screening, from the gate to the carousel. Each hand-off happens in a place, so each one belongs on a map. Here is how our Silverbay Terminal 2 demo puts bag tags, queues, gates and crowding on one live two-floor view.
- Use caseCross-dock and yard visibility on a live map: dock doors, trailers and gatesA cross-dock runs on timing: which door is turning, which trailer has sat in the yard too long, which gate lane is backing up. Putting the building and the yard on one live map makes those answers visible at a glance. Here is how, using our Eastport Cross-Dock Freight Hub demo.