Sydney · Port Botany, Moorebank, Western Sydney and the new airport

RFID tracking in Sydney, from Botany Bay to the Western Sydney sheds

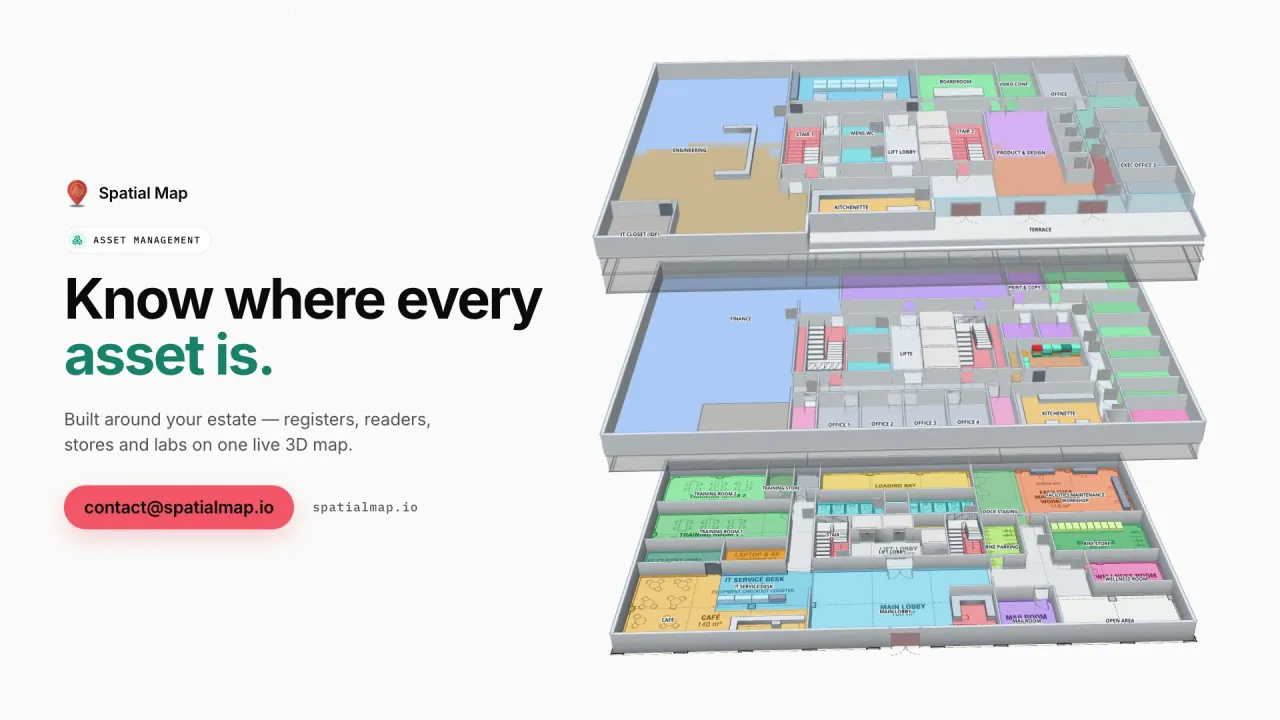
Spatial Map shows RFID reads on a live 3D map of the building where they happen, so a tag at a dock door becomes a pallet in a lane, a carton in a container or a tote in a store room. RFID tracking in Sydney follows the freight: boxes come ashore in Botany Bay, trains arrive at Moorebank, and the pallets end up in big sheds in the city’s west. Your readers and middleware do the reading; Spatial Map shows each read in place, in a browser.

No credit card. Runs in the browser. Pro is $60/month for up to 4 facilities. Book a demo

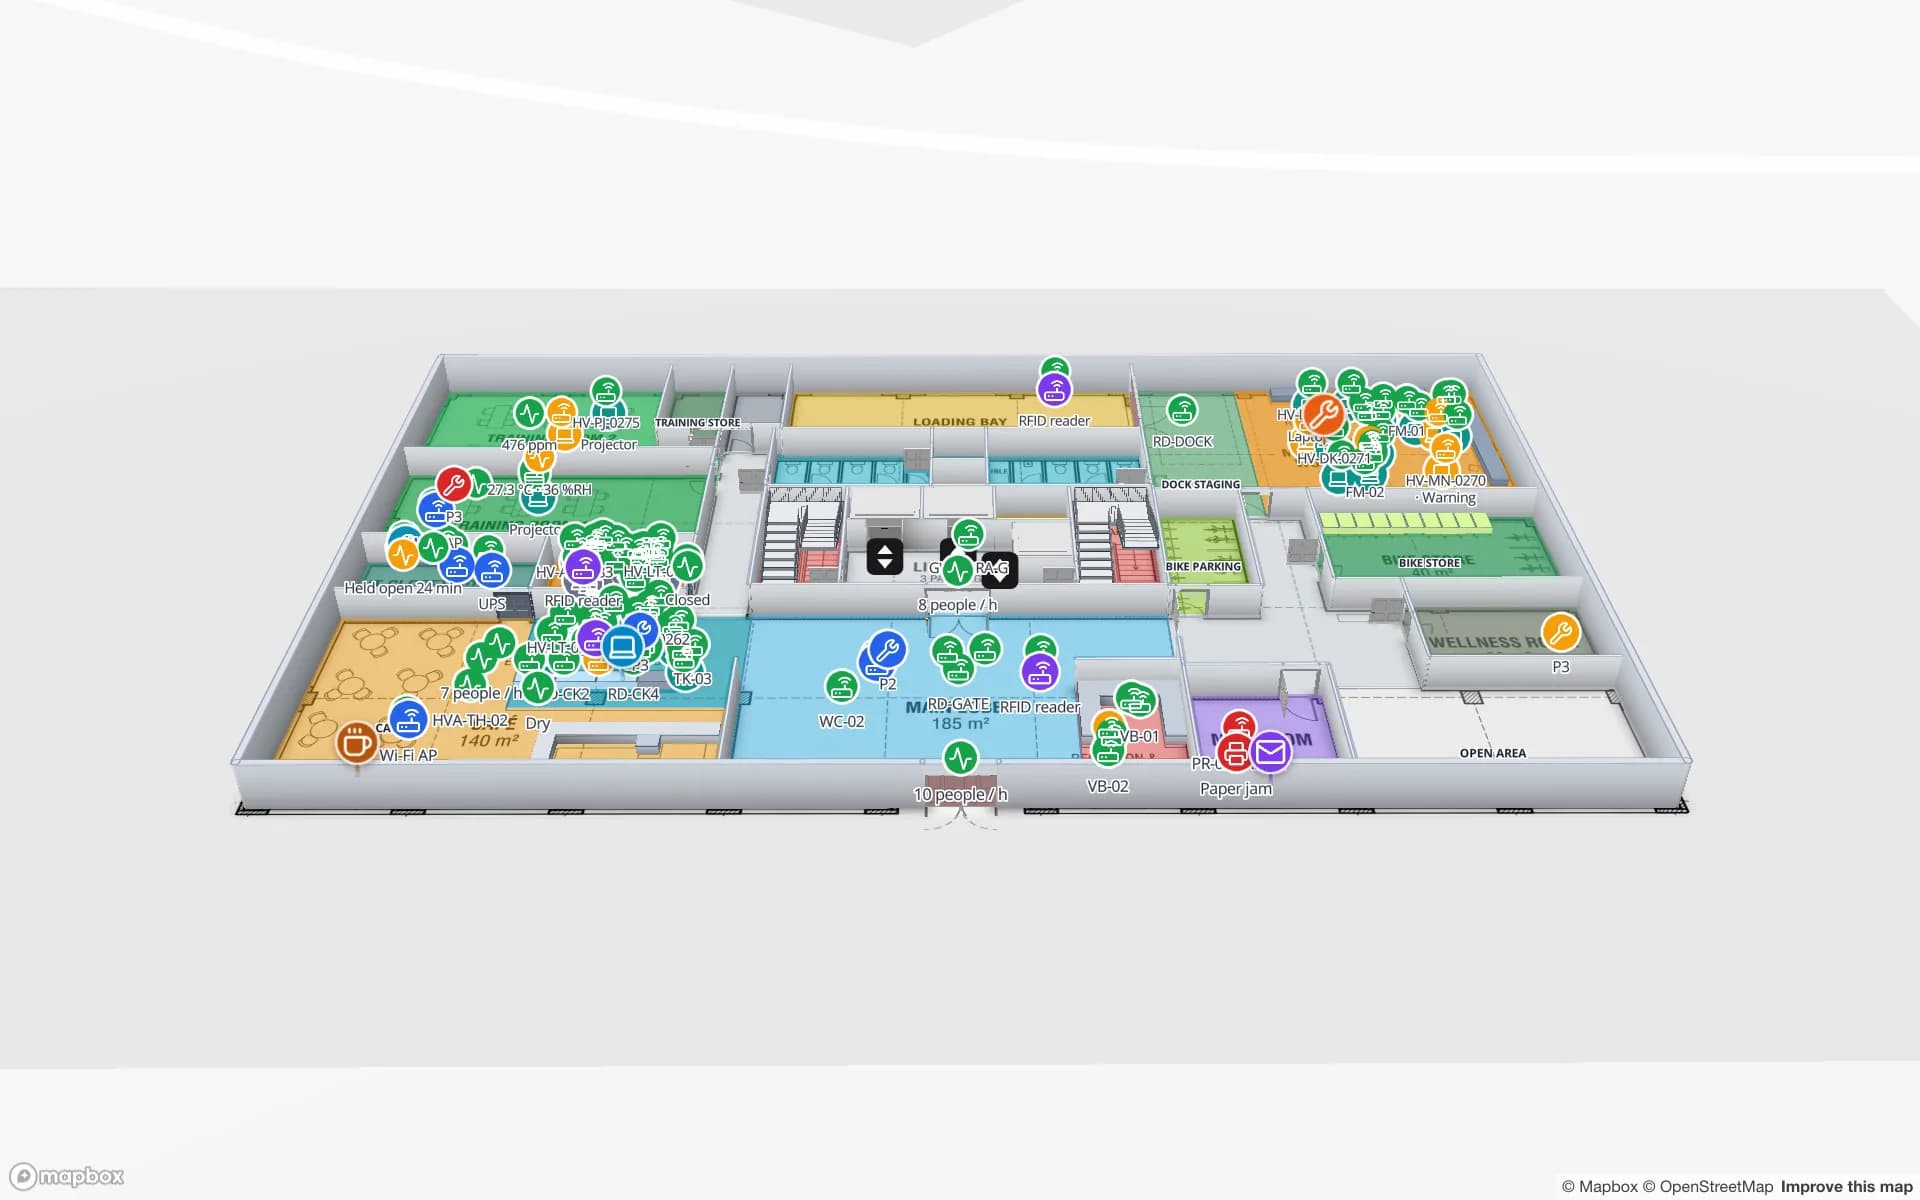
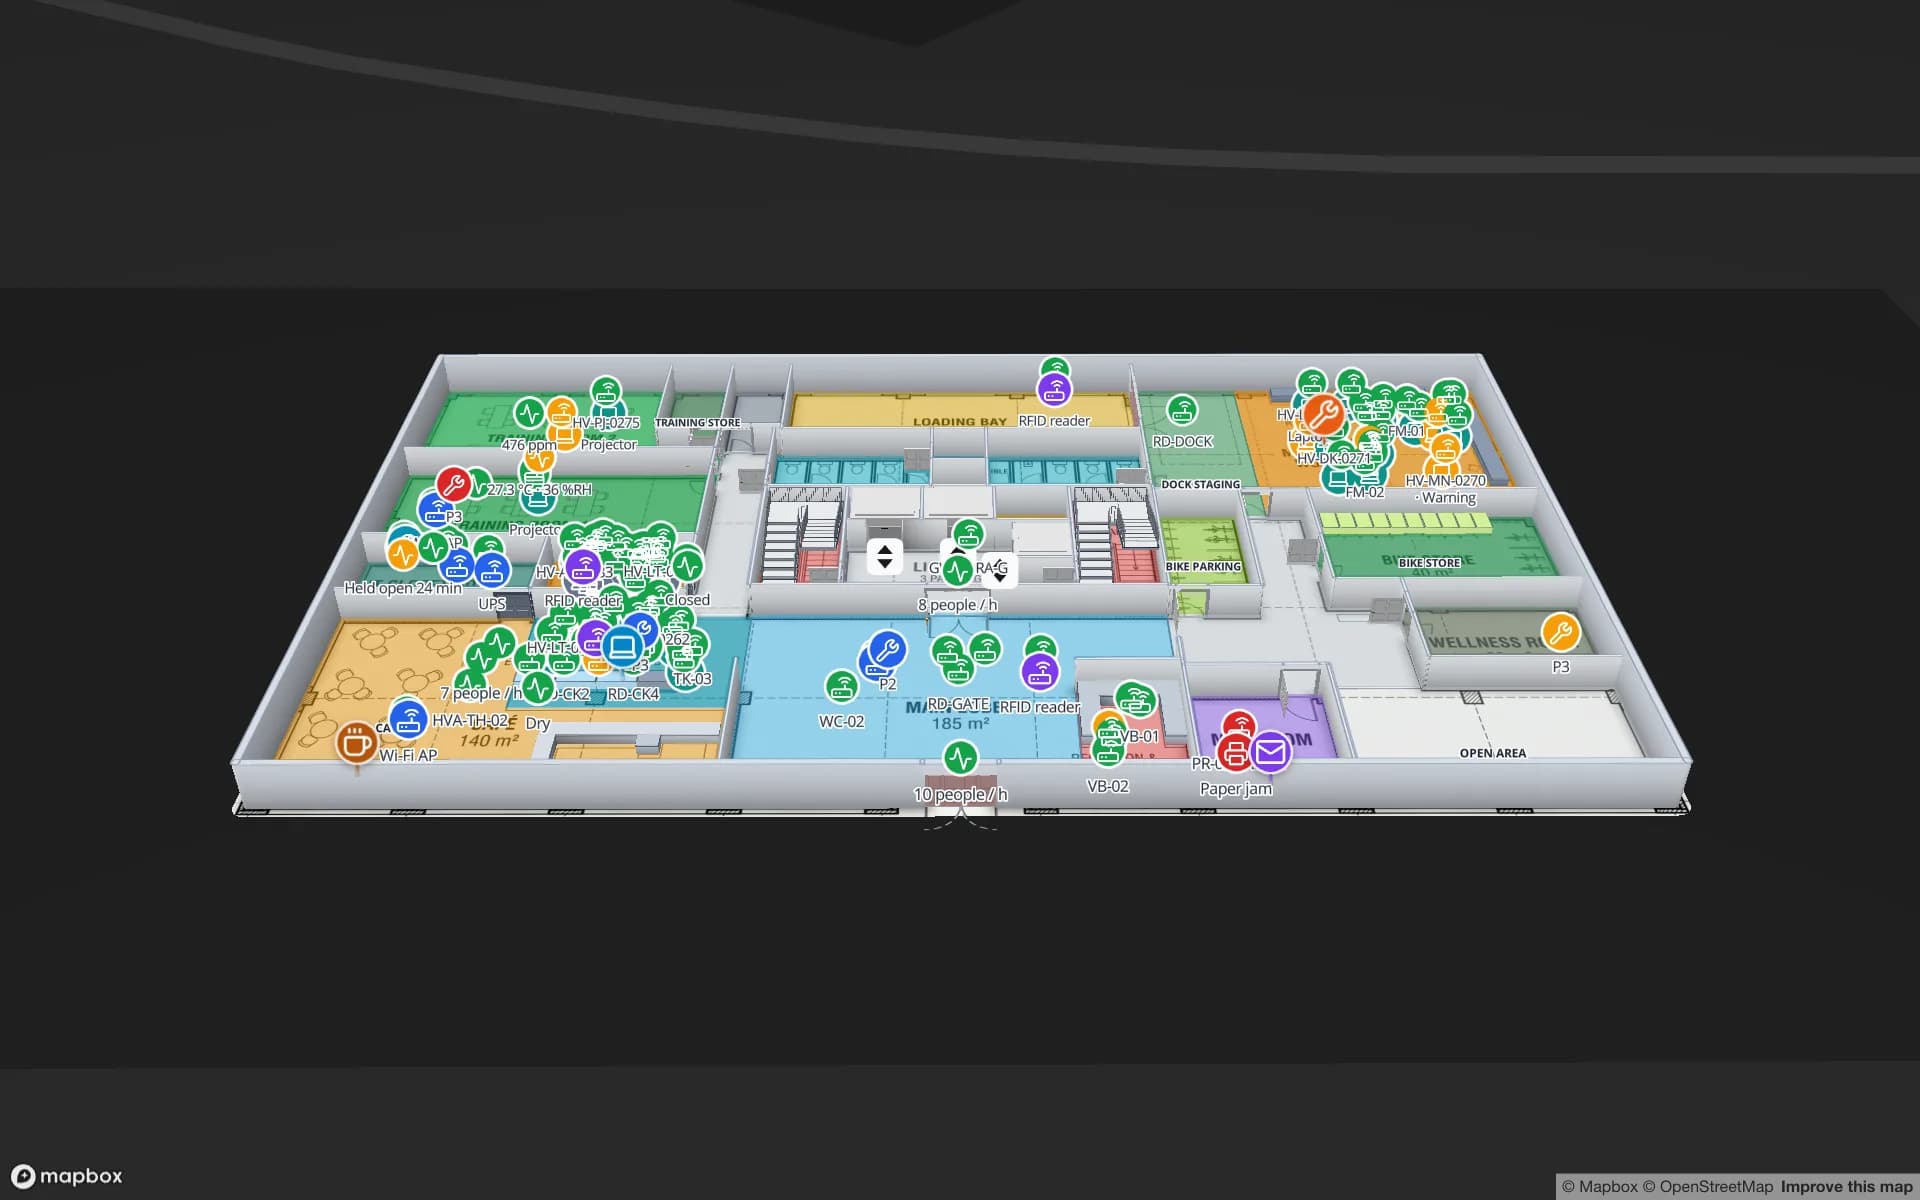
Eastport Cross-Dock Freight Hub, a cross-dock & trailer yard demo, in the Spatial Map 3D viewer with live device markers
Eastport Cross-Dock Freight Hub
Eastport Cross-Dock, a demo freight hub: 50 dock doors, 44 yard slots and 1,180 RFID pallets, with the gate and weighbridge.
Dock doors in the Eastport cross-dock demo
50
RFID pallets moving through Eastport
1,180
How often alert rules are checked, with alerts shown in the app
15 s
Free trial, up to 5 facilities, no card
7 days

Port Botany, and the buildings that empty its boxes

Port Botany is a deep-water seaport in Botany Bay, in Sydney’s south. Its landside operations are managed by NSW Ports, and Sydney’s Vessel Traffic Services, which watches ship movements across Botany Bay and the harbour, is based there too. Everything that arrives in a box then has to be unpacked somewhere: in container parks, deconsolidation sheds and distribution centres within trucking distance of the port.

Inside one of those sheds the question is not about the port at all. It is which pallet is in which lane, which carton went back into which container, and which trailer is waiting at which door. RFID portals at the dock doors answer it, and the Eastport demo shows 50 dock doors, 44 yard slots and 1,180 RFID pallets on one map. Spatial Map does not connect to port, customs or terminal systems; it shows what your own reads, WMS and yard data say. The post on dock doors, trailers and yard visibility covers the layout.


Moorebank: when a long train arrives at once

The Moorebank Intermodal Precinct in Sydney’s south-west changes the rhythm of receiving. Its Interstate Terminal was officially opened in April 2024; it has four 900 m tracks today, a planned build-out of eight, and is designed for interstate freight trains of 1,800 m. A train that long does not trickle into a warehouse. It arrives as a burst of pallets and cartons that the receiving dock has to put away in one shift.

That burst is where an RFID gate earns its place. Pallets pass the portal on the way in, each read is matched against the advance shipping notice, and the map shows what is staged, what is short and what has already been put away. A few extra tags in the first week do more than a perfect tagging plan in the sixth. The RFID gates page explains how to place readers at a door, and RFID for warehouse management covers staging lanes and put-away.

Western Sydney: employment lands and a new airport

Much of Sydney’s newer distribution space sits in the Western Sydney Employment Area, which the NSW Government describes as located in Sydney’s west, with rezoned precincts including Eastern Creek, Erskine Park, Huntingwood, Greystanes Northern, Mamre Road and Ropes Creek. These are big, recent buildings, often leased to retailers and consumer-goods companies, and their drawings are modern CAD files, which suits Spatial Map: upload the DWG or PDF, align it and draw racks, docks and staging.

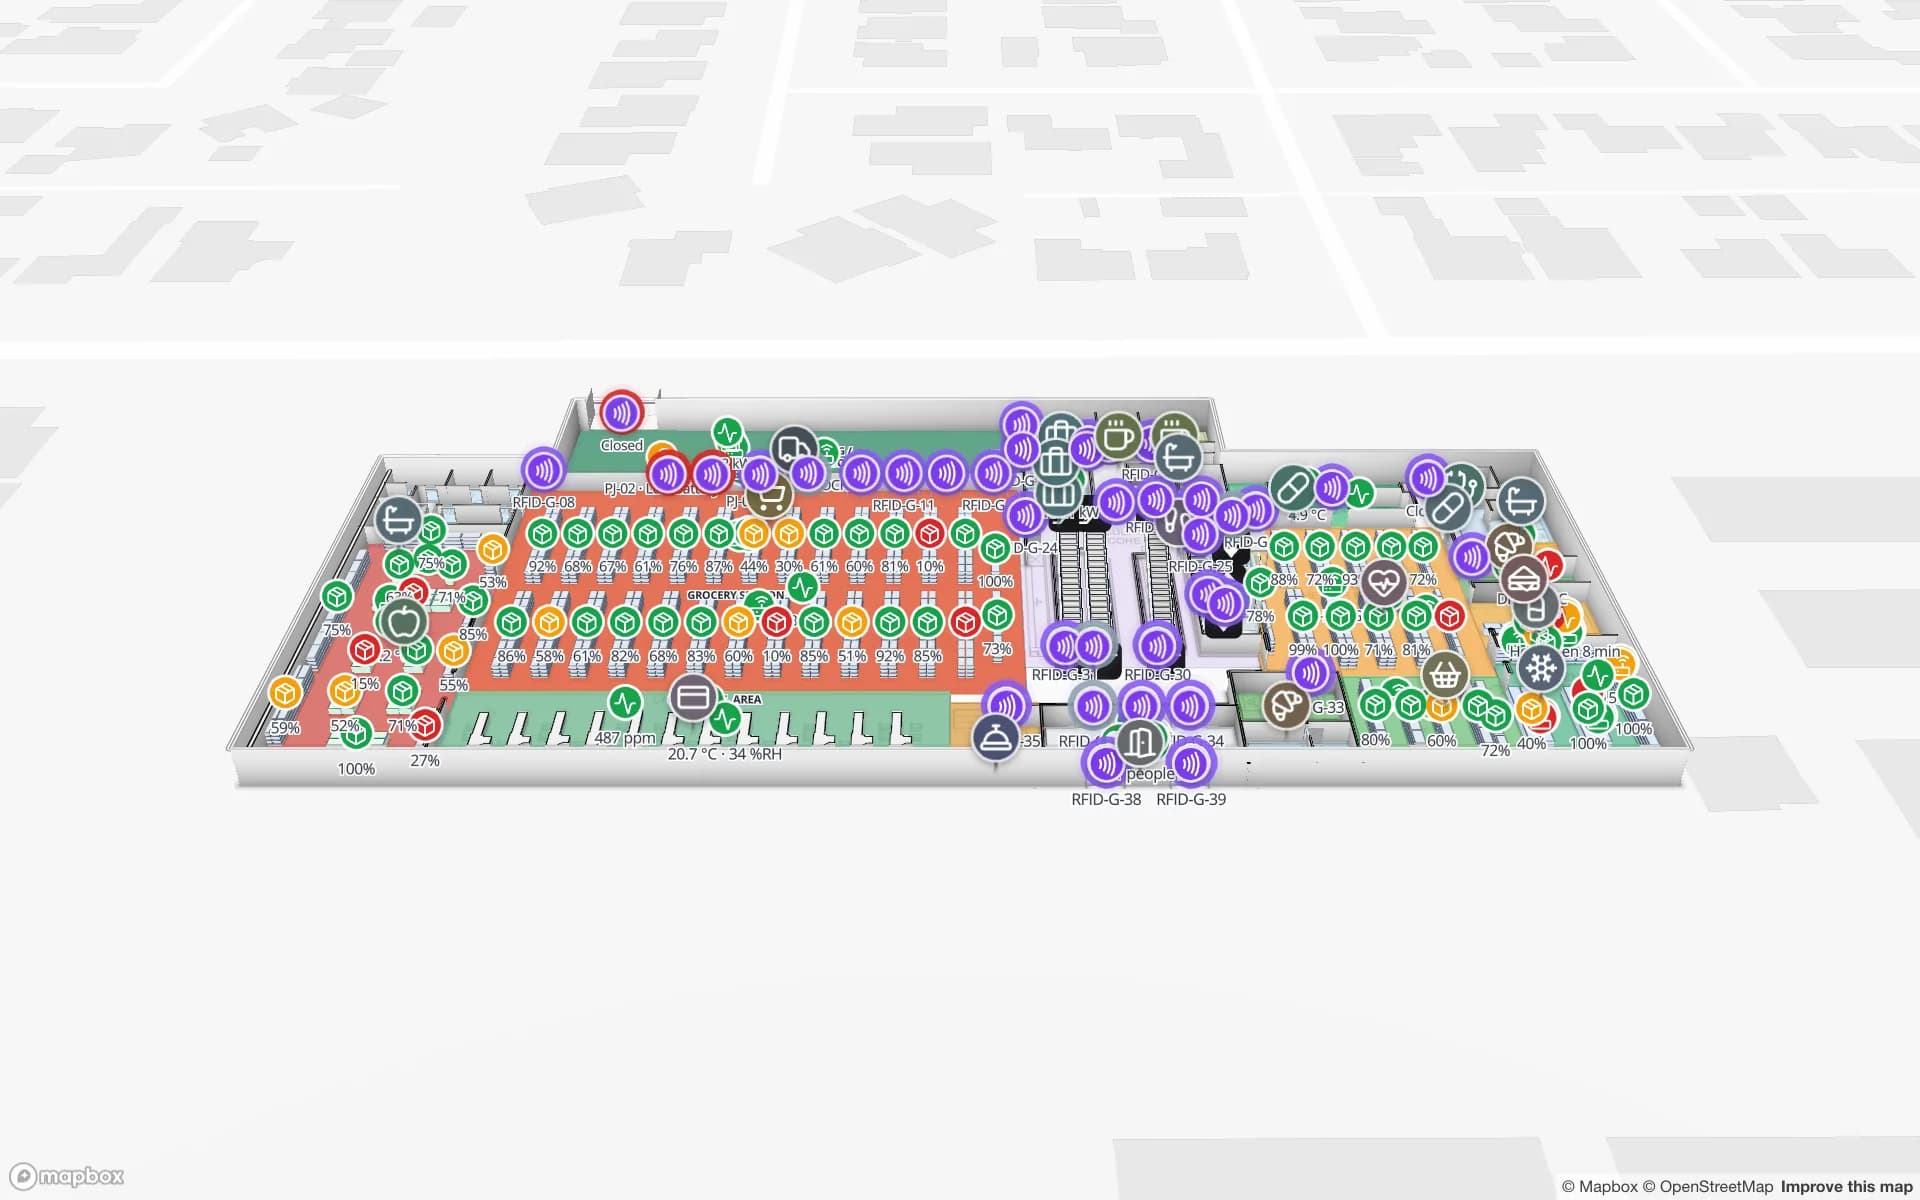
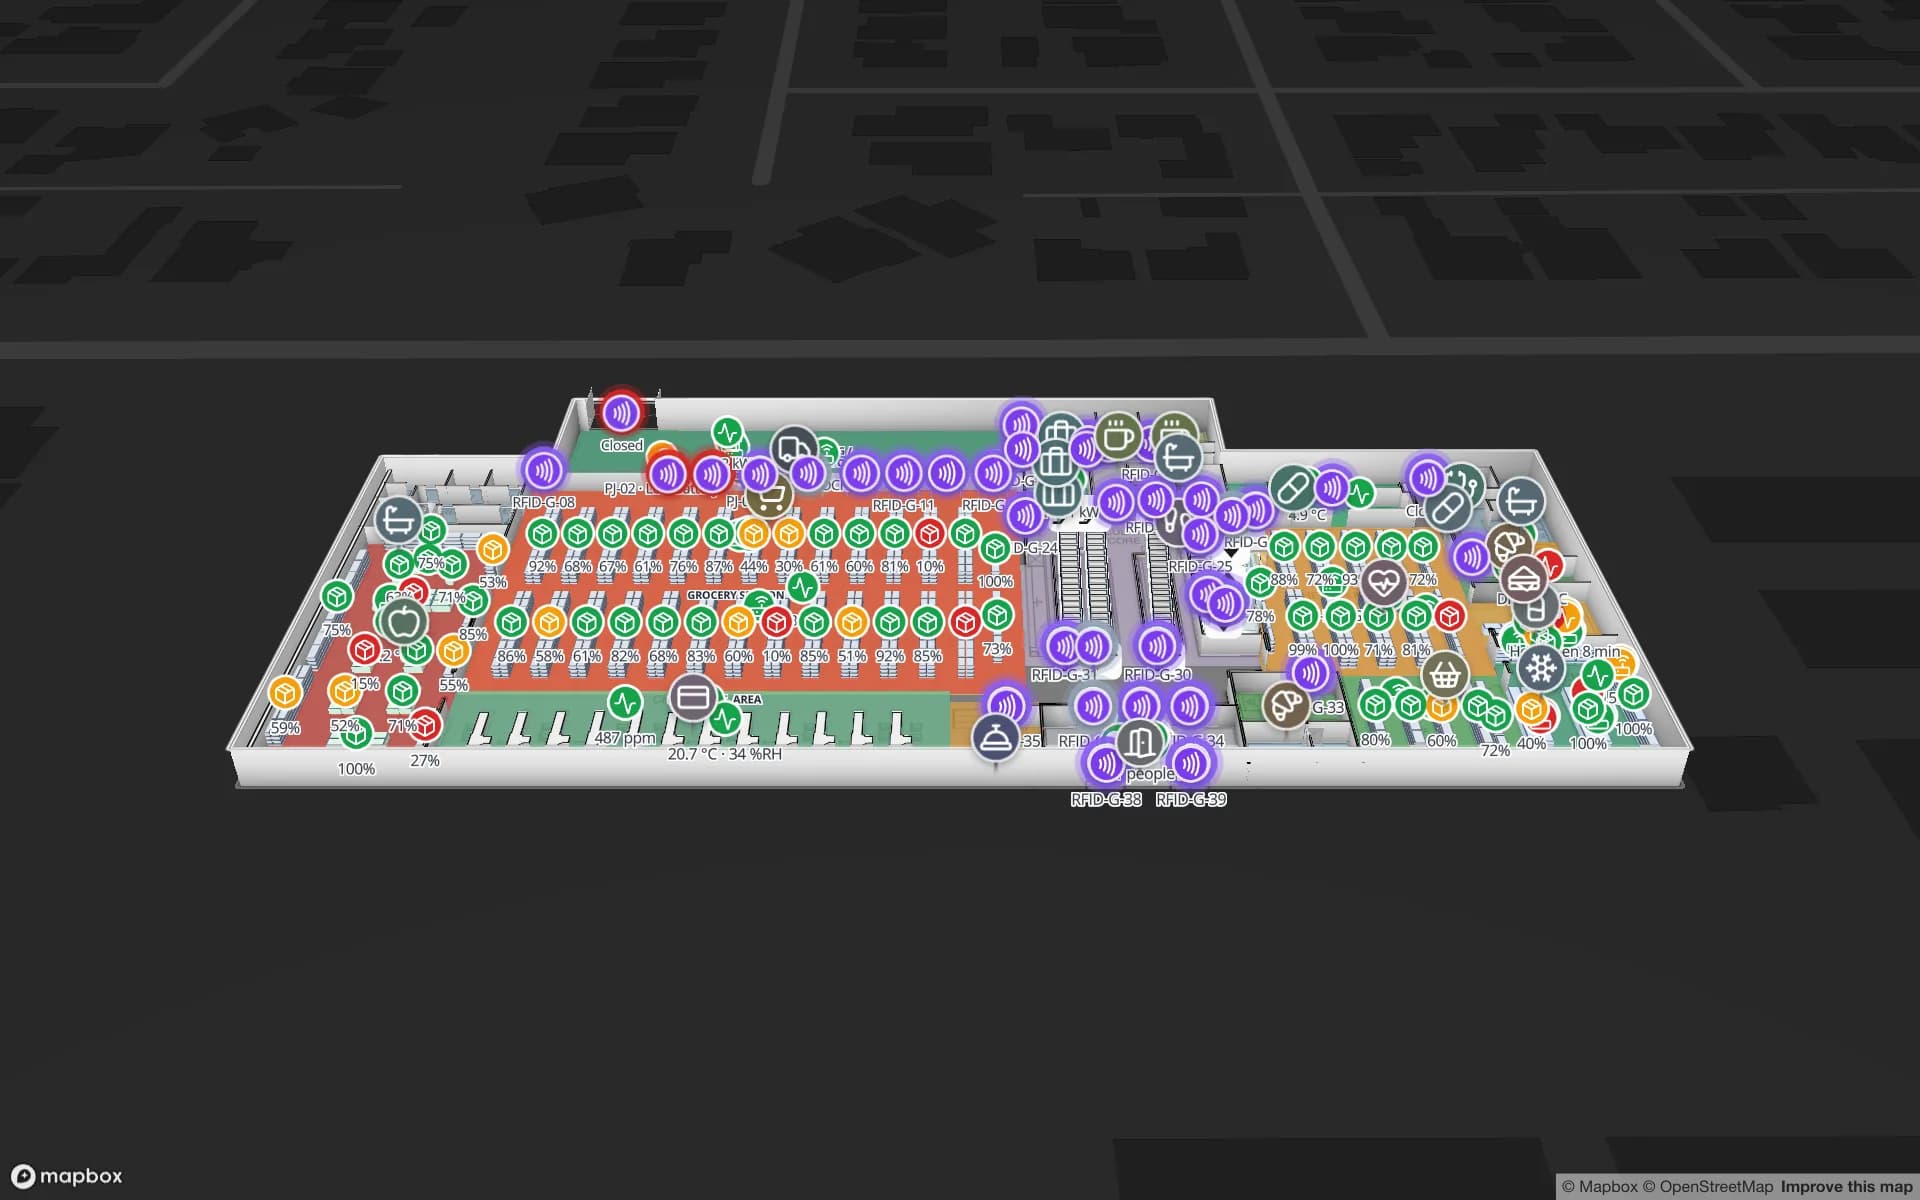
Western Sydney International Airport adds a freight address to the same area. Its cargo precinct is planned around what the airport’s chief executive called 24-hour capacity, reached by the upgraded Northern Road and close to freight and logistics sites in Kemps Creek and across the Aerotropolis. For a retail distribution centre, the practical question is what to tag first: cartons and totes leaving for stores, or the returnable pallets and cages that come back. The Crestline demo shows 2,204 rack locations coloured by stock status, with packing and staging lanes in front of the docks.

Curfew at Mascot, no curfew out west: nights that need a view

Sydney Airport at Mascot operates under a curfew between 11 pm and 6 am under the Sydney Airport Curfew Act 1995. The new airport is planned around round-the-clock freight. Whatever the airline timetable, a lot of Sydney’s freight moves at night: trucks collect and deliver while the day shift is asleep, and the person who answers for the building may be at home.

A live map helps there in three ways. A read-only share link with an expiry date lets an on-call manager open the floor without an account. An alert rule set to “not updated for N minutes” on the reader table raises an in-app alert when a portal goes quiet, and row history lets the morning shift replay what happened overnight. Alerts appear in the app only; Spatial Map sends no email or SMS, so decide who watches the Alerts page.

Services for teams in Sydney

Where Sydney teams usually start depends on the building:

  • Container parks and deconsolidation sheds near Botany start with inventory tracking at the dock doors, because a pallet in the wrong lane costs a truck slot.
  • Western Sydney distribution centres often begin with RFID on returnable pallets and cages, then move to cartons, using asset tracking for the equipment and inventory tracking for stock.
  • Large yards and sites where vehicles and people must be located continuously look at RTLS and UWB; most buildings do not need it first.
  • If you have no readers or tags yet, our team can source RFID readers, antennas and tags on request, quoted per project, with warranty and device support from the manufacturer: see hardware and demo kits on request.
  • Android handheld apps, WMS and ERP integrations and other custom software, such as POS or booking systems, are built as client projects. The product itself runs as cloud or on-premises.

Also served nearby

The same approach covers Botany and Mascot, Moorebank and Chipping Norton, Wetherill Park and Smithfield, Eastern Creek, Kemps Creek and Badgerys Creek, Penrith and the Silverwater industrial area. Nothing needs to be installed at any of them: the map opens in a browser.

How Spatial Map does it

From the dock door to a live Sydney map

  1. 01

    Pick one building

    A container park near Botany, a rail-served shed or a Western Sydney distribution centre — wherever a mis-staged pallet costs most.

  2. 02

    Map doors, lanes and racks

    Upload the plan, let AI Map draft walls, doors and racks for a person to review, and name read points the way your middleware does.

  3. 03

    Connect reads and stock

    RFID middleware and your WMS post rows through the table write API, a polled REST endpoint, or CSV and Excel uploads.

  4. 04

    Add door and silence rules

    In-app alerts for pallets staged too long, loads still unmatched against the notice, and portals that stopped reporting overnight.

What Sydney teams track

Deconsolidation and container parks

Dock doors, yard slots and pallets staged for the right outbound lane.

Rail-delivered freight

Pallets read at the receiving door and matched to the notice, with put-away progress by lane.

Retail and consumer-goods distribution

Rack-level stock, RFID cartons and staging lanes on one plan.

Returnable pallets, cages and equipment

Tagged equipment with its last-seen area and check-out history.

See it on real demo facilities

Fictional names, real floor plans, live sensors, RFID, BLE tags and gateways — open any of them in the browser.

All 13 demo facilities

RFID tracking in Sydney — questions we get

No. It has no link to port community, customs or terminal systems. It shows what happens inside your own building, from your own RFID reads, WMS and sensors, so it sits alongside the port-level systems rather than replacing them.

The map is driven by the rows your systems send. Your middleware can post reads in bulk through the write API (HTTPS, bearer key, bulk upsert, 60 requests per minute per key), so batch the reads from a gate rather than sending one request per tag. How fast the reads arrive is a matter for your readers and middleware.

Yes. Upload the architect’s PDF or DWG (AutoCAD R2004–R2018, placed as a picture), draw racks and docks, and load the planned rack list as a table. When readers go in, the same map receives the reads. Spatial Map does not model construction progress.

Yes, through a read-only share link with an expiry date, a view cap and a choice of floors and layers; tags move live on shared links. Alerts are in-app only, so someone has to be watching the Alerts page or the map; there is no email, SMS or push notification.

No. Spatial Map is sold online and our team works with customers in Australia remotely, by video call and through the contact form. There are no local resellers or partners.

In US dollars, the same worldwide: a 7-day free trial for up to 5 facilities with no card, then Pro at $60 a month or $600 a year for up to 4 facilities. RFID hardware, if you ask us to source it, is quoted per project and is not part of the subscription.

Map one Sydney dock before the next train arrives.

Start the free trial and open the Eastport demo, or send us the plan of a container park, a rail-served shed or a Western Sydney distribution centre and a sample of your reads through the contact form.