Brisbane · Port of Brisbane, Australia TradeCoast, 2032 venues and the river

Asset tracking in Brisbane, from Fisherman Islands to the 2032 venue sites

Spatial Map shows where tagged equipment, tools and other assets are, on a live 3D map of each building and yard, using the reads and positions your RFID and BLE systems already produce. Asset tracking in Brisbane covers three kinds of place: the port and airport estates where a lot of equipment moves between buildings, the compounds and stores around the city’s large construction programs, and the buildings of a river city that remembers its floods. Each place becomes a facility in one workspace.

No credit card. Runs in the browser. Pro is $60/month for up to 4 facilities. Book a demo

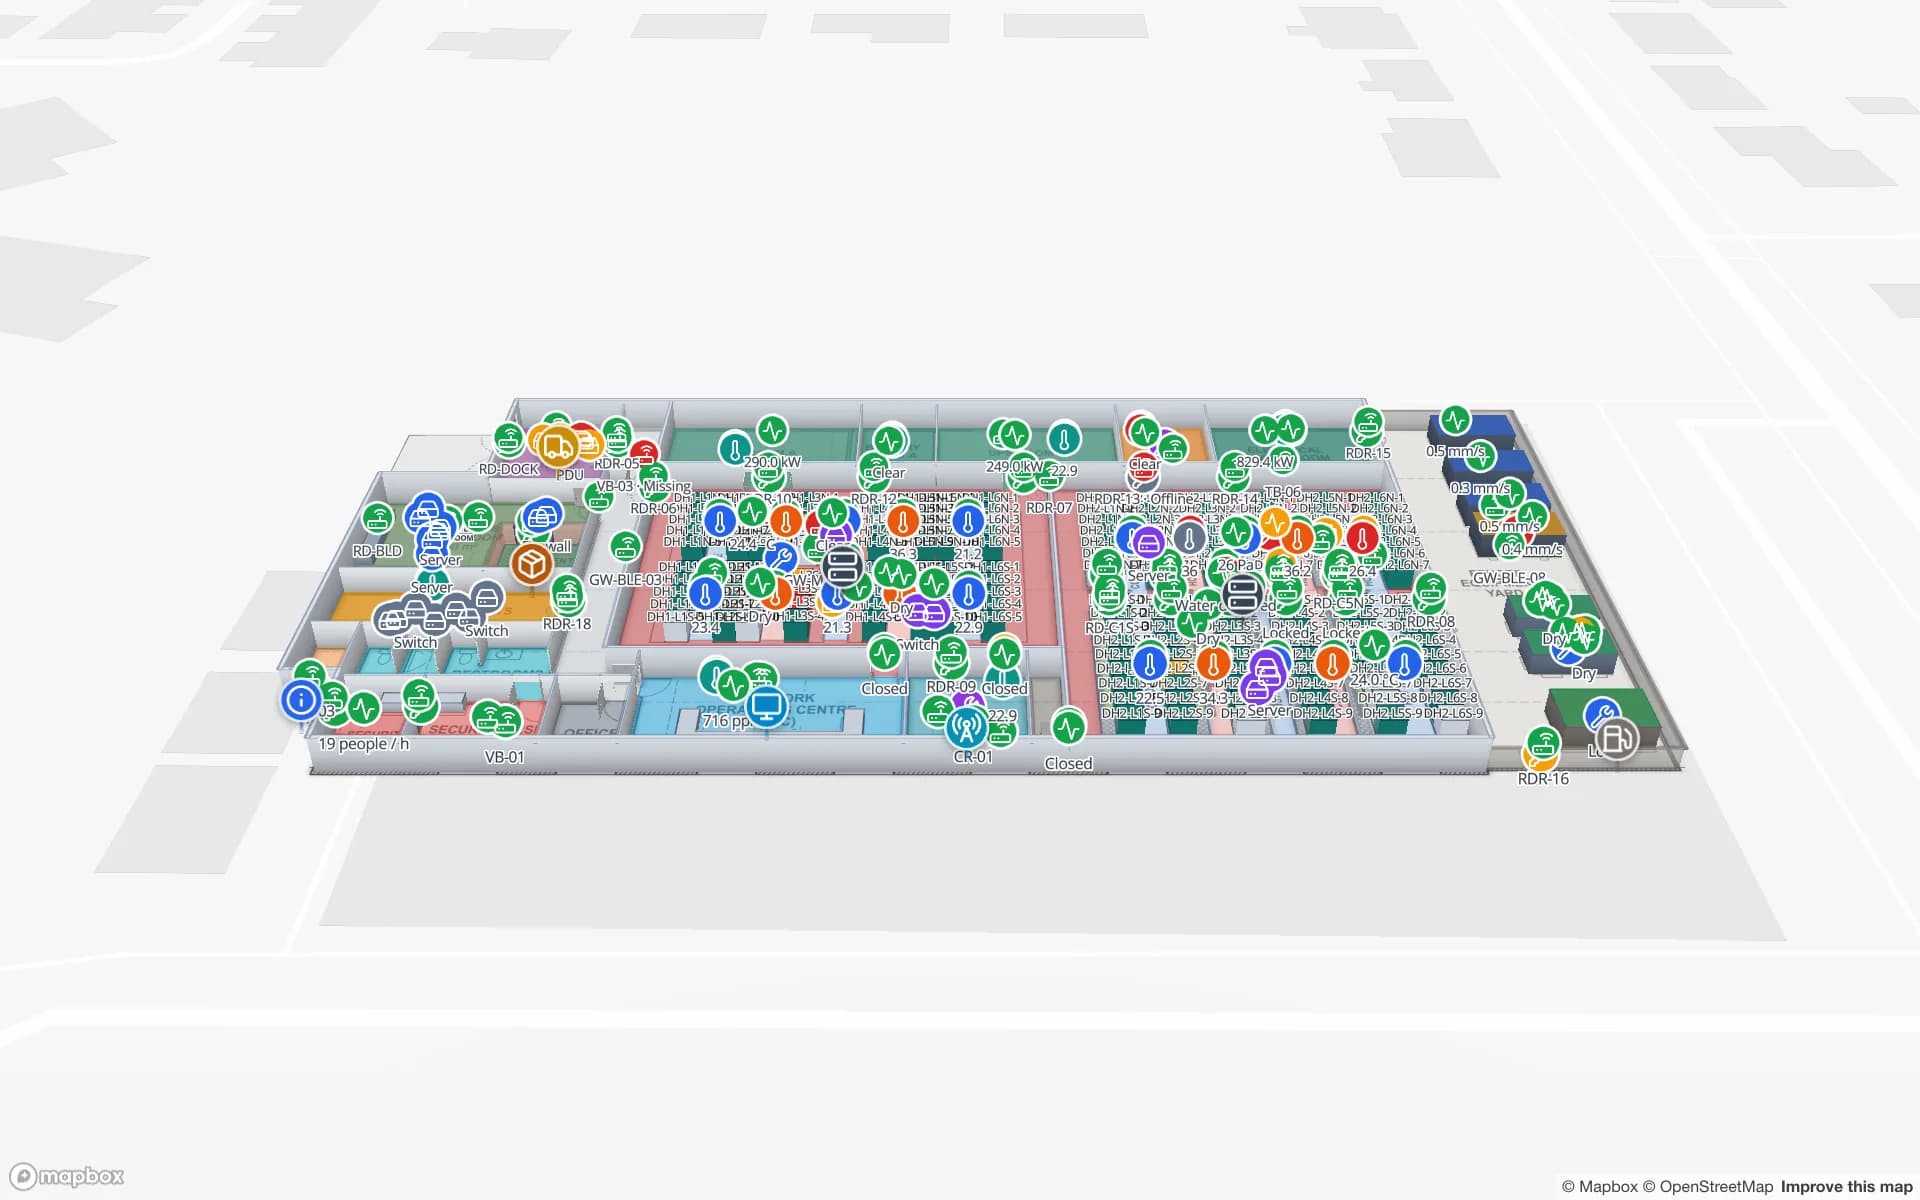
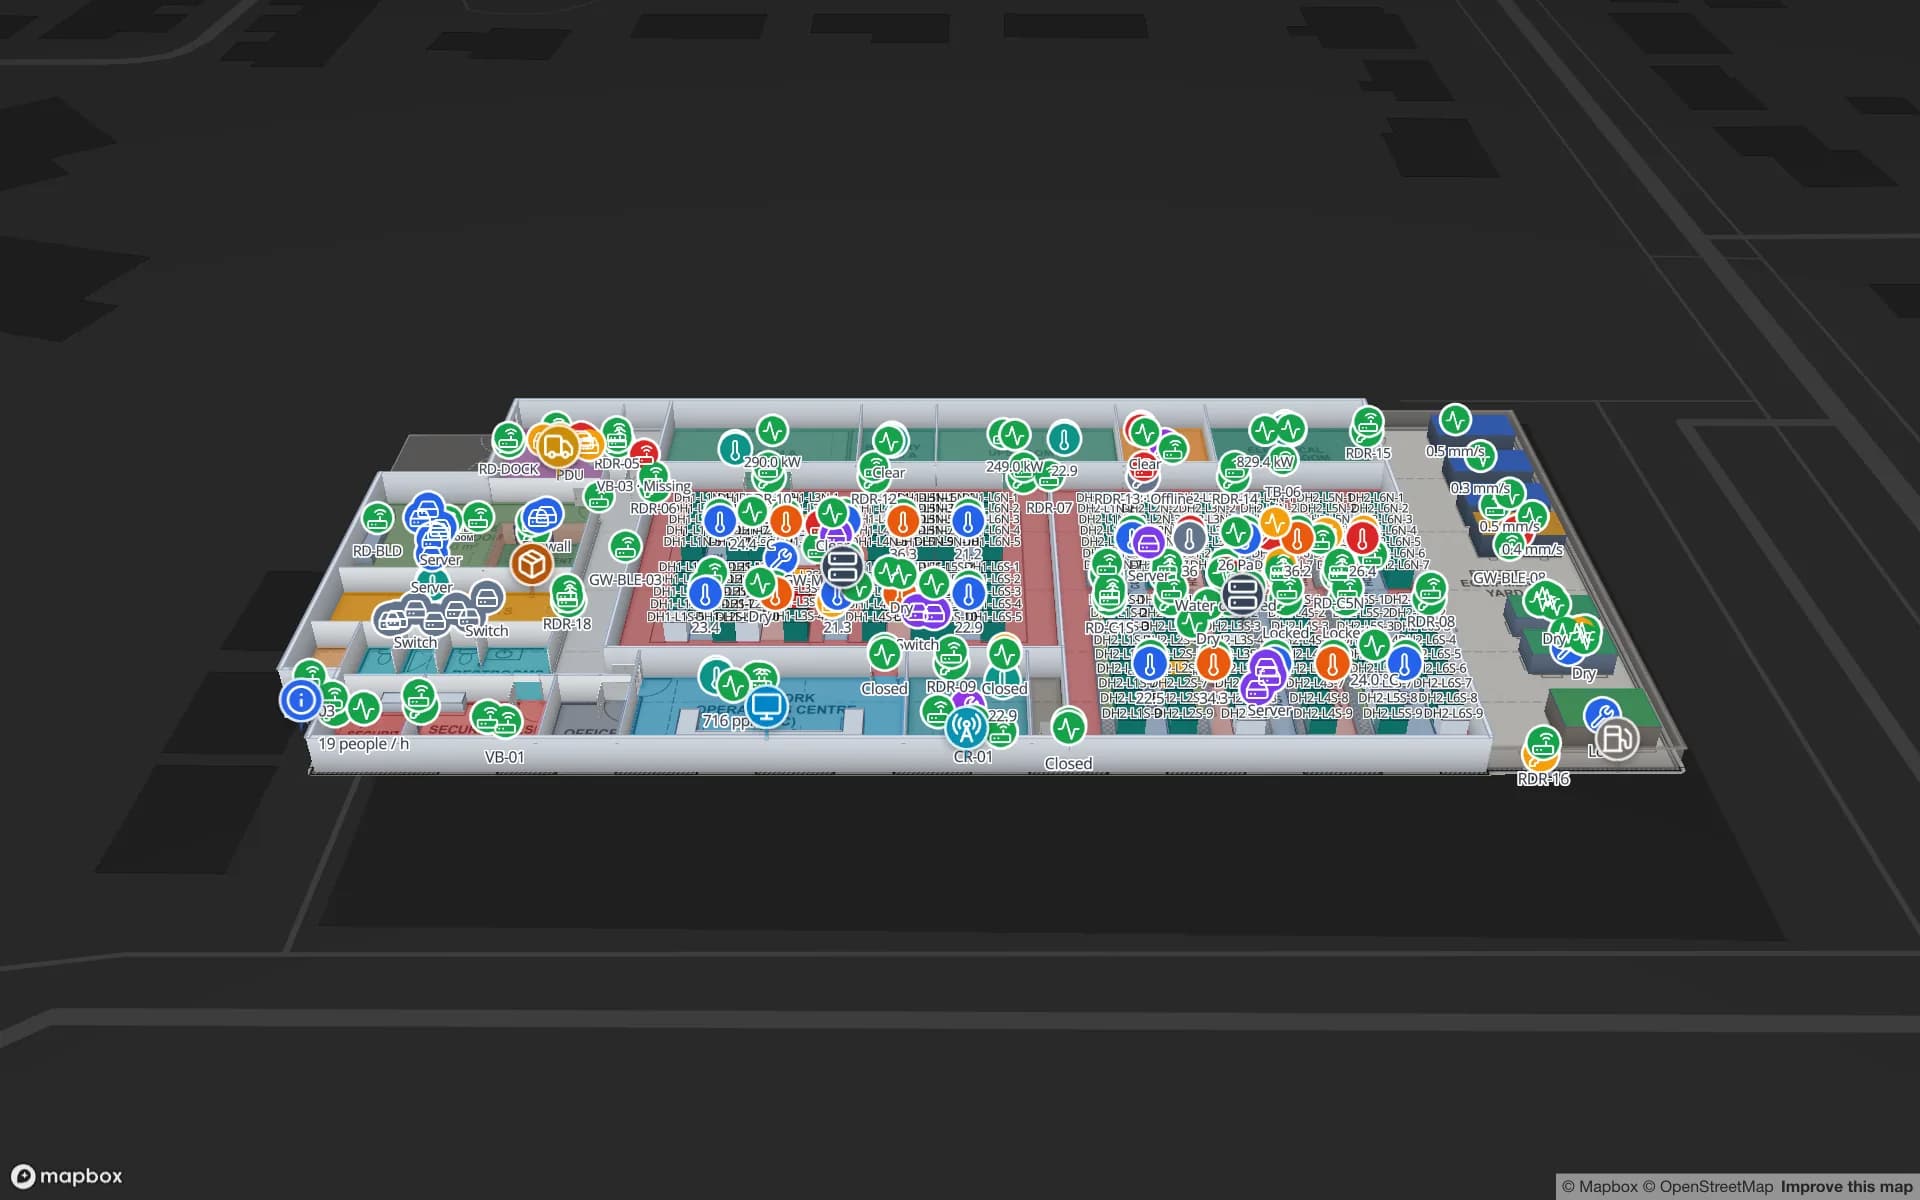
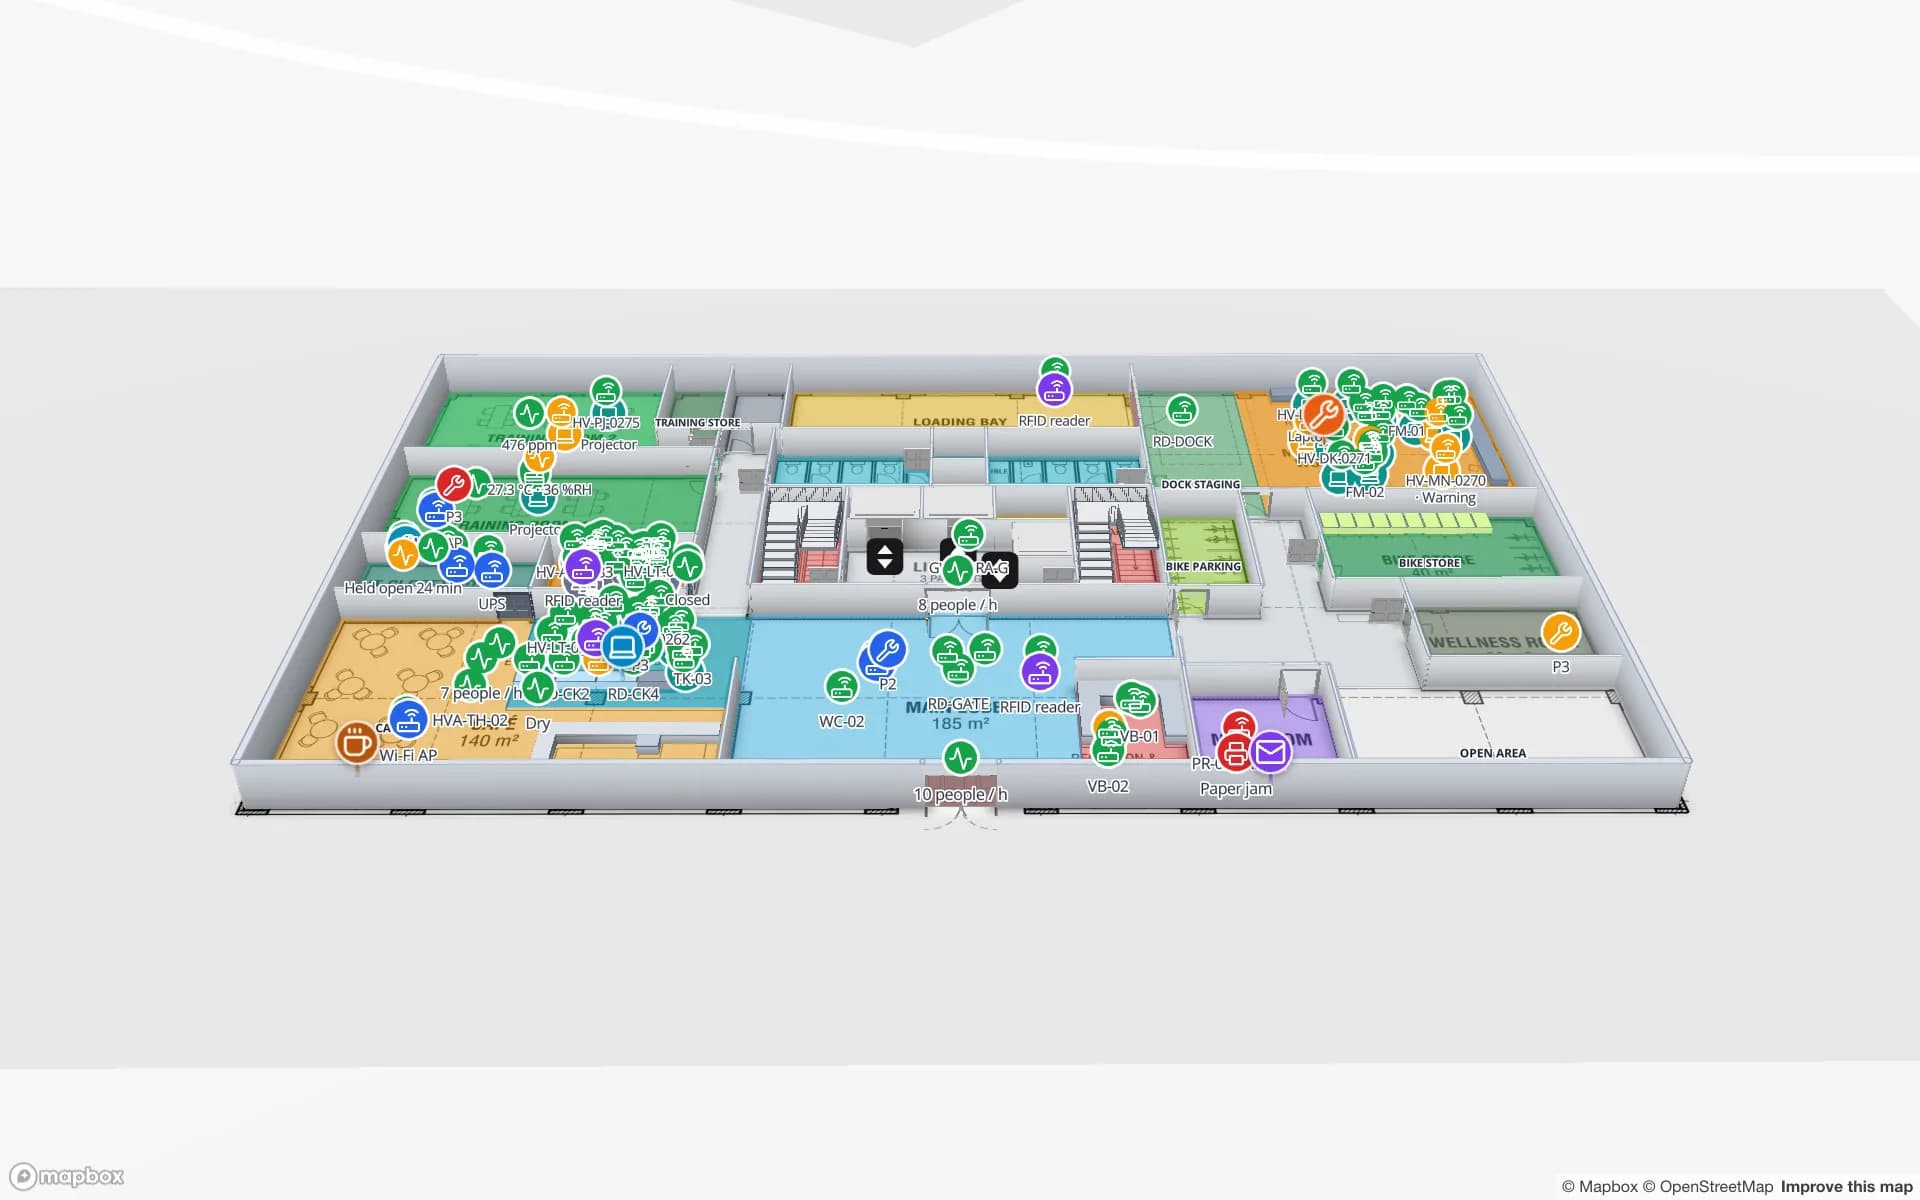
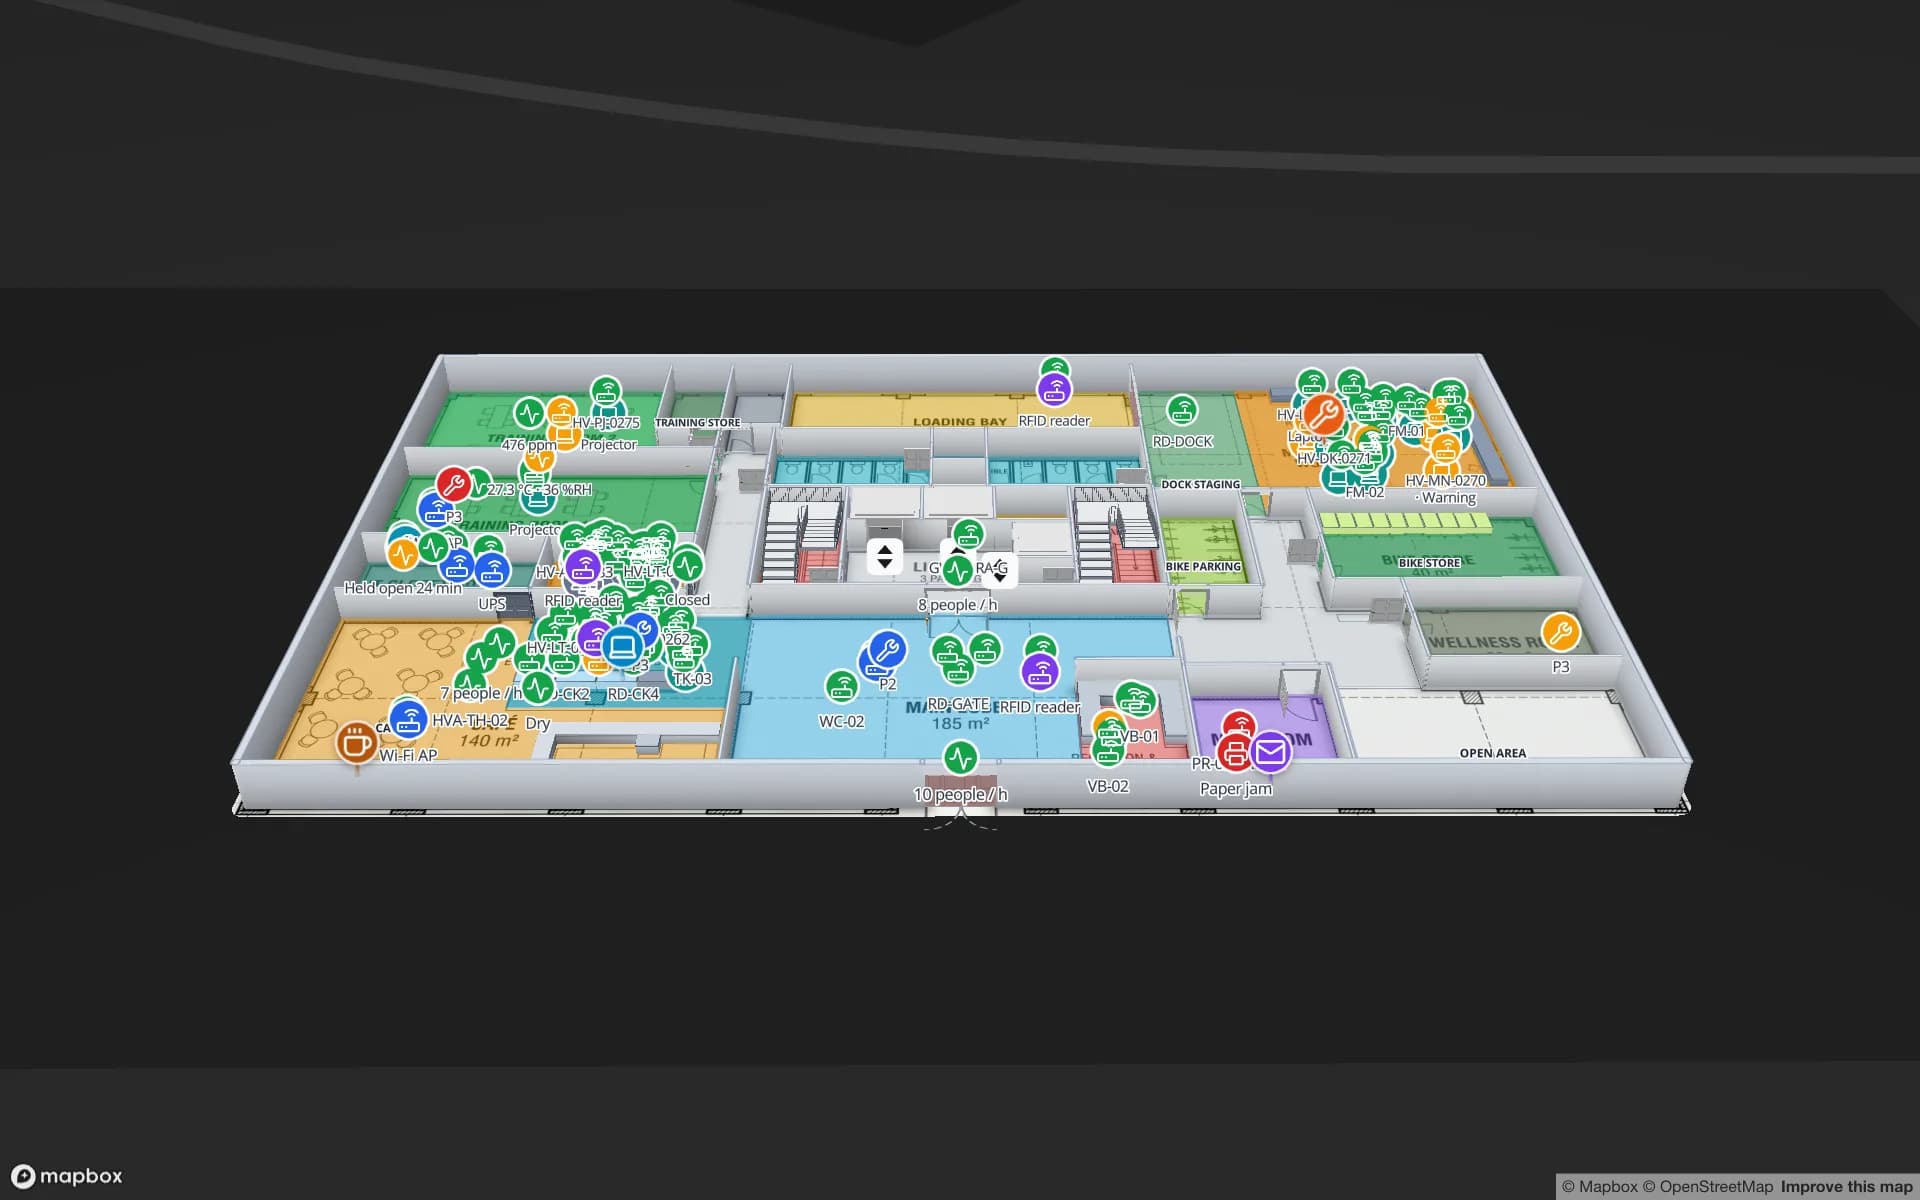
Harborview Corporate Campus — Building A, a corporate office building demo, in the Spatial Map 3D viewer with live device markers
Harborview Corporate Campus — Building A
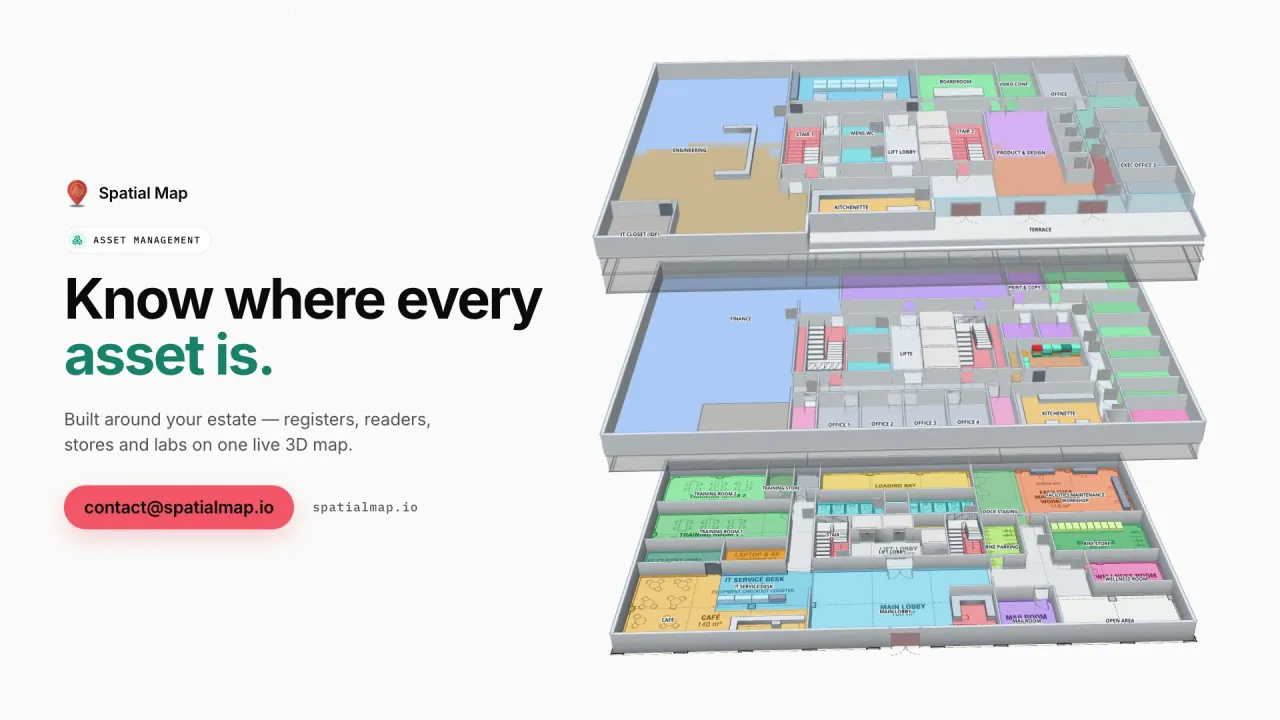
Harborview Corporate Campus, a demo office building: the asset register, equipment check-out, stores and spares, work orders and meeting rooms on three floors.
Floors in the Harborview asset-register demo
3
Built-in reports in the Harborview demo
19
How often alert rules are checked, with alerts shown in the app
15 s
Free trial, up to 5 facilities, no card
7 days

The port estate: a lot of kit between a lot of buildings

The Port of Brisbane reports about 1,620,000 TEU in 2024/25, a 90 km shipping channel that it maintains, and more than 70 businesses across five precincts. Its container berths at Fisherman Islands are leased and operated by three stevedores using automated container handling equipment. For an operator or a service company on a site like that, the assets that matter are not the cranes. They are the things that move between buildings and get lost: reefer leads and power cables, spreaders and lifting gear, spare parts, forklift attachments, tool kits and test equipment.

Those items live in stores, workshops and on vehicles. Tag them with RFID or BLE, let your reader software report the last location, and Spatial Map shows each item on the store or workshop plan, with its check-out history in the detail drawer. A table of items keeps its owner, its home store and a calibration or inspection date, and a style rule colours the overdue ones. The Harborview demo shows the same pattern with equipment check-out, stores and spares on three floors, and RFID tool tracking covers the crib door.
Australia TradeCoast: estates side by side

Australia TradeCoast began as a partnership of the Queensland Government, Brisbane City Council, Brisbane Airport and the Port of Brisbane, as a 1999 ministerial statement to the Queensland Parliament described it. It is a collection of neighbouring industrial and business precincts around the port and the airport, which means one company can have a warehouse, a workshop and an office within a few kilometres of each other.

That is where one workspace helps: each building is its own facility, and facilities can be grouped into a named solution such as “TradeCoast sites”. The asset register is one table with a location column, so a laptop, a pallet jack or a calibrated gauge shows up on whichever plan it was last seen on. For equipment that needs continuous location, such as vehicles in a yard, look at RTLS and UWB; for everything that sits still most of the day, RFID at the door and handheld audits are cheaper.

Olympic-era construction: compounds, stores and a lot of borrowed kit

Brisbane will host the 2032 Games, and the Queensland Government’s venue program is large. A 63,000-seat Brisbane Stadium at Victoria Park is part of the $7.1 billion Games Venues Infrastructure Program funded jointly by the Australian and Queensland governments; the delivery authority took possession of Victoria Park on 1 June 2026 for preparatory earthworks, and a precinct master plan is meant to connect the stadium, the National Aquatic Centre and the Athletes Village. Spatial Map has no involvement in any of this, and the Games are context here, not a claim.

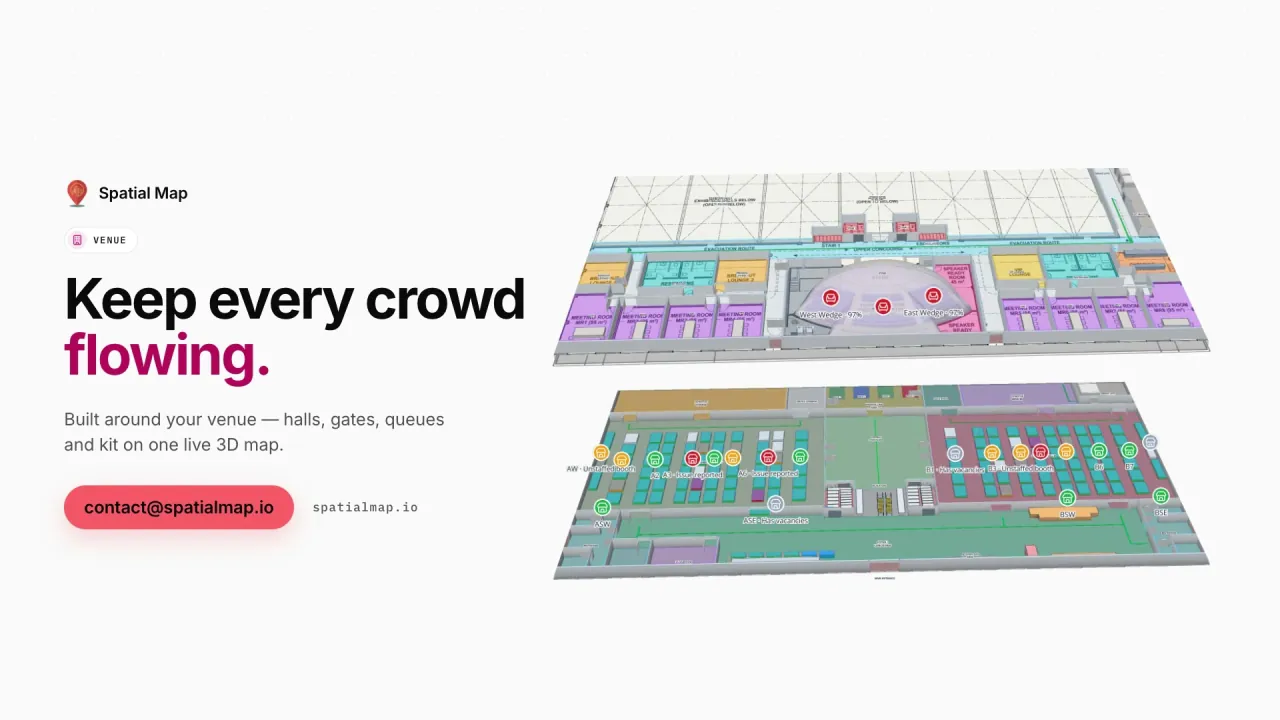
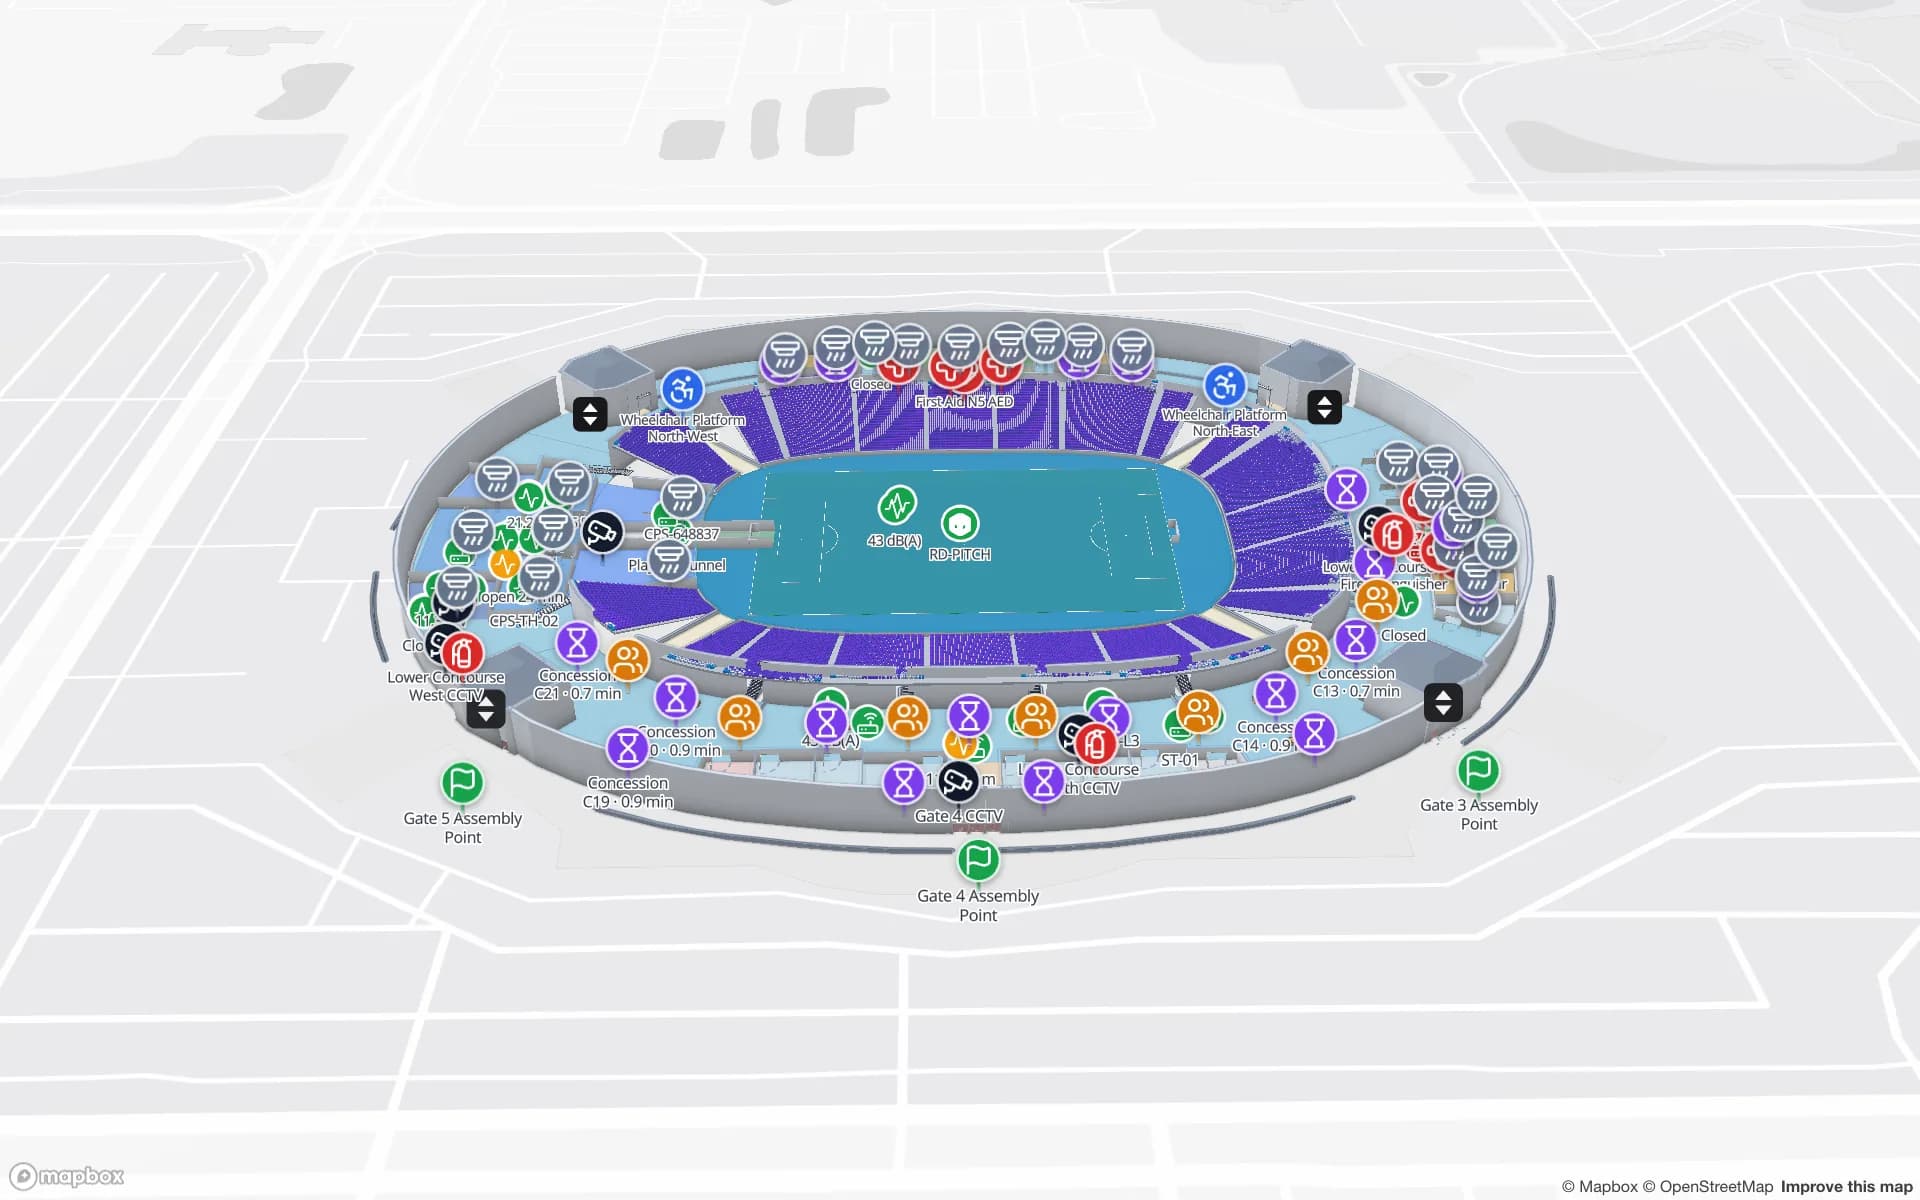
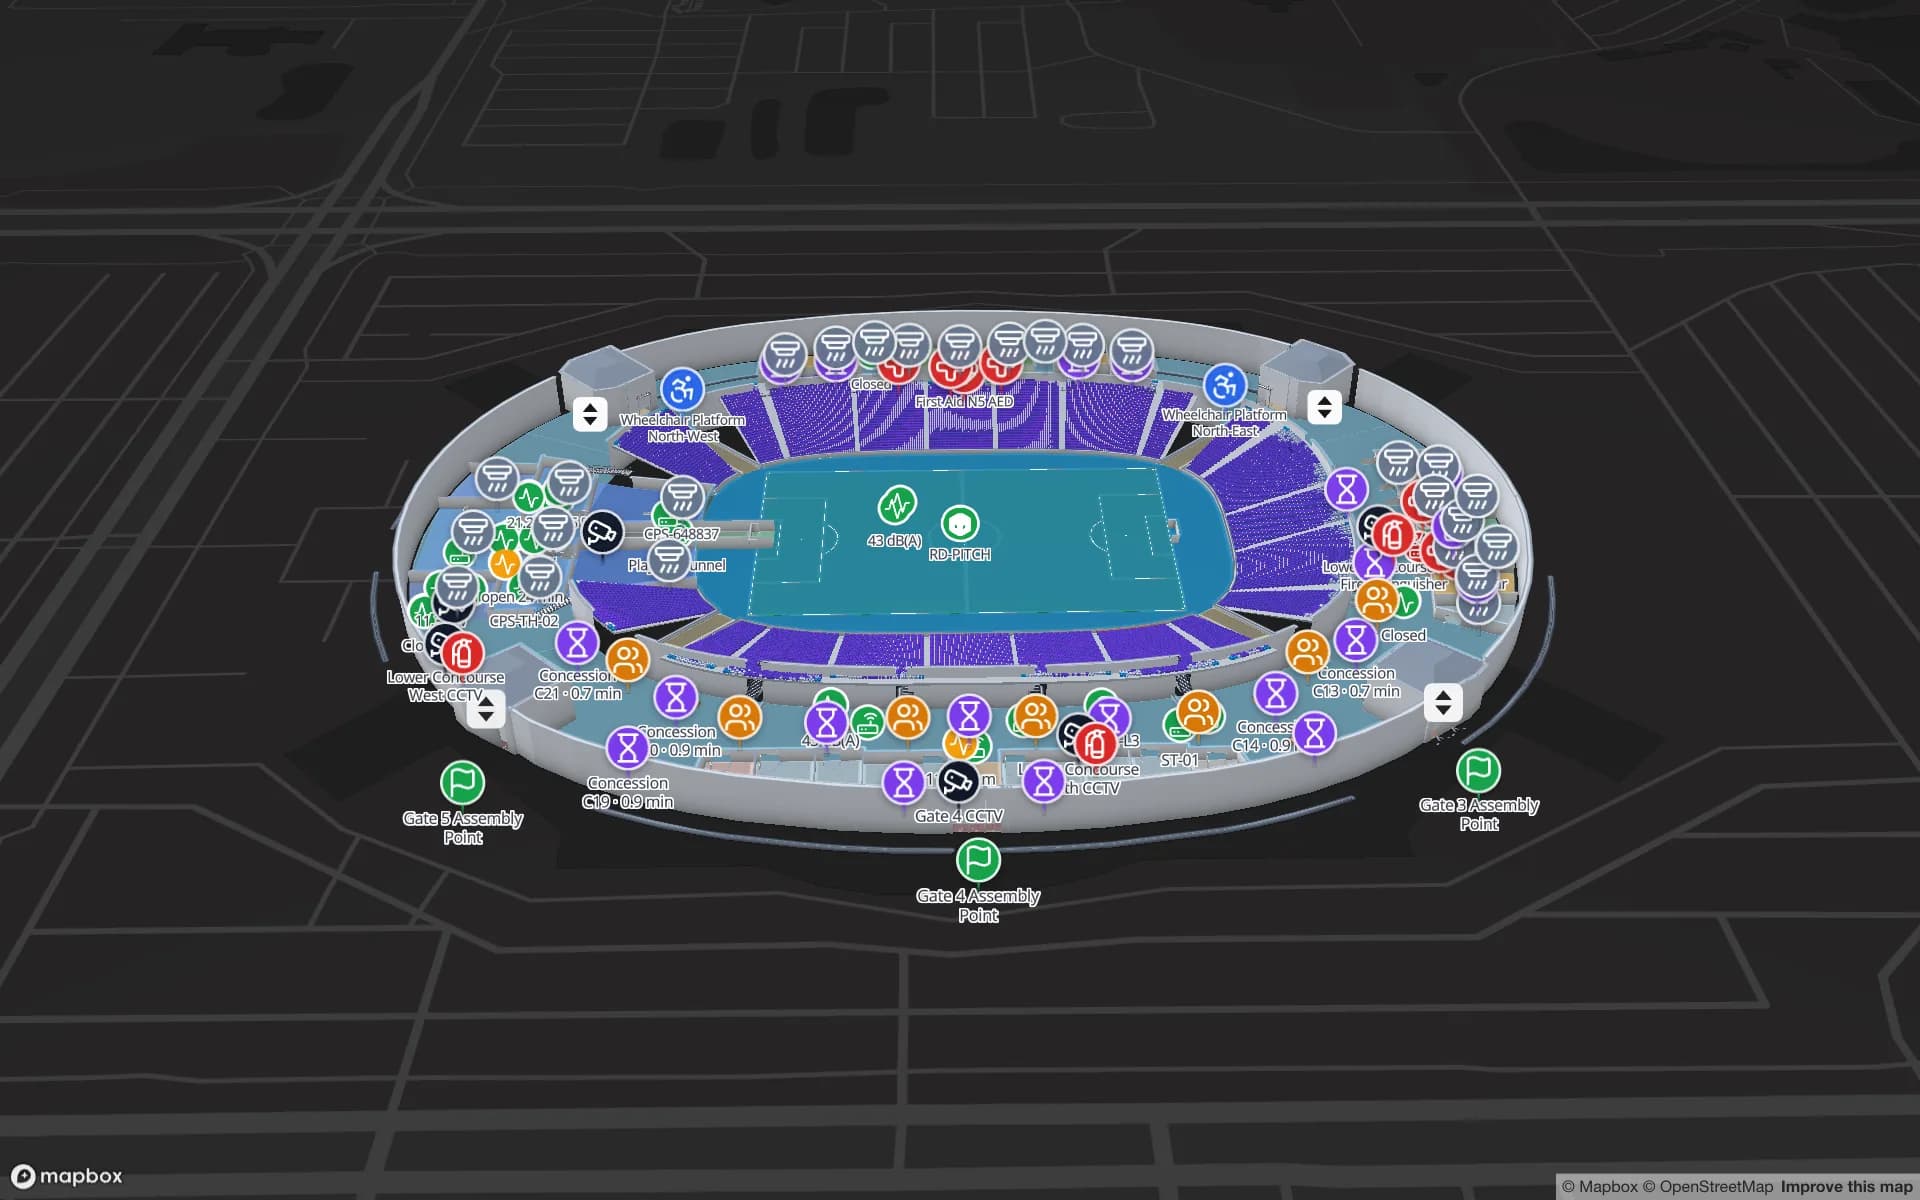
What the program means for any company working on a big site is the same everywhere: a compound, a tool store, shared plant and many sub-contractors. The problem is borrowed kit, which is hired, tagged with someone else’s label, moved between zones and returned late. Spatial Map is not a construction-management or BIM tool; it maps the buildings and yards you give it, tracks the tagged items inside them, and keeps the check-out history. When a venue is finished, the same map can carry on as its asset register. The Crown Park demo shows a stadium with concourse equipment and event-day markers.

A river city: what sits on the ground floor

The Brisbane River at Brisbane City peaked at 3.85 m on 28 February 2022, against 4.46 m in 2011. Whichever year a company remembers, the practical question afterwards is the same: which equipment and stock was in the basement, on the ground floor or in the low yard, and what could be moved up. Spatial Map draws every floor of every building, and an asset table with a floor field can be filtered to show only what is on the lowest level.

Spatial Map does not model flood levels or forecast anything, and it makes no flood-preparedness claim. What it does is answer “what is down there?” in seconds instead of by walking the building, and keep a row history so a team can replay where items were before they were moved. Combine it with a handheld RFID walk-through of a store before the wet season to refresh the register.

Services for teams in Brisbane

Brisbane teams usually start with one of these:

  • Port and TradeCoast operators begin with asset tracking for tools, spares and shared equipment, then add inventory tracking for stock.
  • Contractors and facility managers on large sites start with indoor maps of the compound and stores, so check-out has somewhere to point.
  • Where people and vehicles in a yard must be located continuously, RTLS and UWB is the next step; a BlueIOT server connects directly.
  • If you have no tags or readers yet, our team can source RFID and BLE tags, readers and gateways on request, quoted per project, with warranty and device support from the manufacturer: see hardware and demo kits on request.
  • A purpose-built asset management system, handheld apps and other custom software are built as client projects. The product runs as cloud or on-premises.

Also served nearby

The same approach covers Pinkenba, Eagle Farm and Hemmant, Acacia Ridge and Rocklea, Wacol and Darra, Narangba and Ipswich, and out towards the Gold Coast and the Sunshine Coast. Nothing is installed at any of them: the map opens in a browser.

How Spatial Map does it

Building a Brisbane asset map

  1. 01

    Load the asset register

    Upload a CSV or Excel list of assets with tag IDs, owners, home stores and inspection dates as a table.

  2. 02

    Draw the places

    Stores, workshops, compounds and yards as areas; upload each plan and let AI Map draft the building for a person to review.

  3. 03

    Connect the reads

    RFID or BLE reads arrive through the table write API or a polled REST endpoint, so each asset has a last-seen area.

  4. 04

    Add overdue and silence rules

    In-app alerts for kit not returned, items not seen for N minutes and readers that stopped reporting.

What Brisbane teams track

Port and TradeCoast tool stores

Tagged tools, spares and test equipment with check-out history and due dates.

Construction compounds and hired kit

Shared plant and borrowed items by zone, with an overdue-return colour rule.

Venue operations after completion

The equipment, crates and staff markers that run a stadium on event days.

Server rooms and IT stores

IT assets by cabinet and shelf, with spares and change records.

See it on real demo facilities

Fictional names, real floor plans, live sensors, RFID, BLE tags and gateways — open any of them in the browser.

All 13 demo facilities

Asset tracking in Brisbane — questions we get

RFID is cheaper per tag and suits items that pass a door, such as a tool-crib or store exit. BLE tags with gateways suit items that must be located room by room without passing a portal. Many sites use both. The RFID vs BLE comparison sets out the trade-offs.

Yes, as rows in a table: tag ID, owner, hire company, due date and last-seen area. Whether you may tag it is a matter for the hire agreement. Spatial Map only shows the data you send.

No. It does not model floods, issue warnings or support evacuation. It shows where your tagged assets last were, floor by floor, which helps when you need to know what is on the lowest level. Alerts are in-app only.

Yes. Every building is a facility in the same workspace, opened in a browser, and read-only share links with expiry dates let clients or contractors see one site without an account.

No. Spatial Map is sold online and our team works with customers in Australia remotely, by video call and through the contact form. There are no local resellers or partners.

In US dollars, the same worldwide: a 7-day free trial for up to 5 facilities with no card, then Pro at $60 a month or $600 a year for up to 4 facilities. Tags and readers, if you ask us to source them, are quoted per project and are not part of the subscription.

Put your Brisbane tool store on a map.

Start the free trial and open the Harborview demo, or send us a store plan and an asset list through the contact form and we will show you your own building live.