Australia · RFID across long supply chains

RFID tracking software for Australian retail, pallets and export cold chains

Australian supply chains are long. Meat, dairy and seafood travel from processing plants to the port, groceries cross state lines between distribution centres, and the spare parts for a remote mine site can be a flight away from the person who ordered them. RFID records what passed each door along the way. Spatial Map shows those reads on a live 3D plan of the store, DC, cold store or remote warehouse — in a browser that looks the same in Perth, Townsville or head office.

No credit card. Runs in the browser. Pro is $60/month for up to 4 facilities. Book a demo

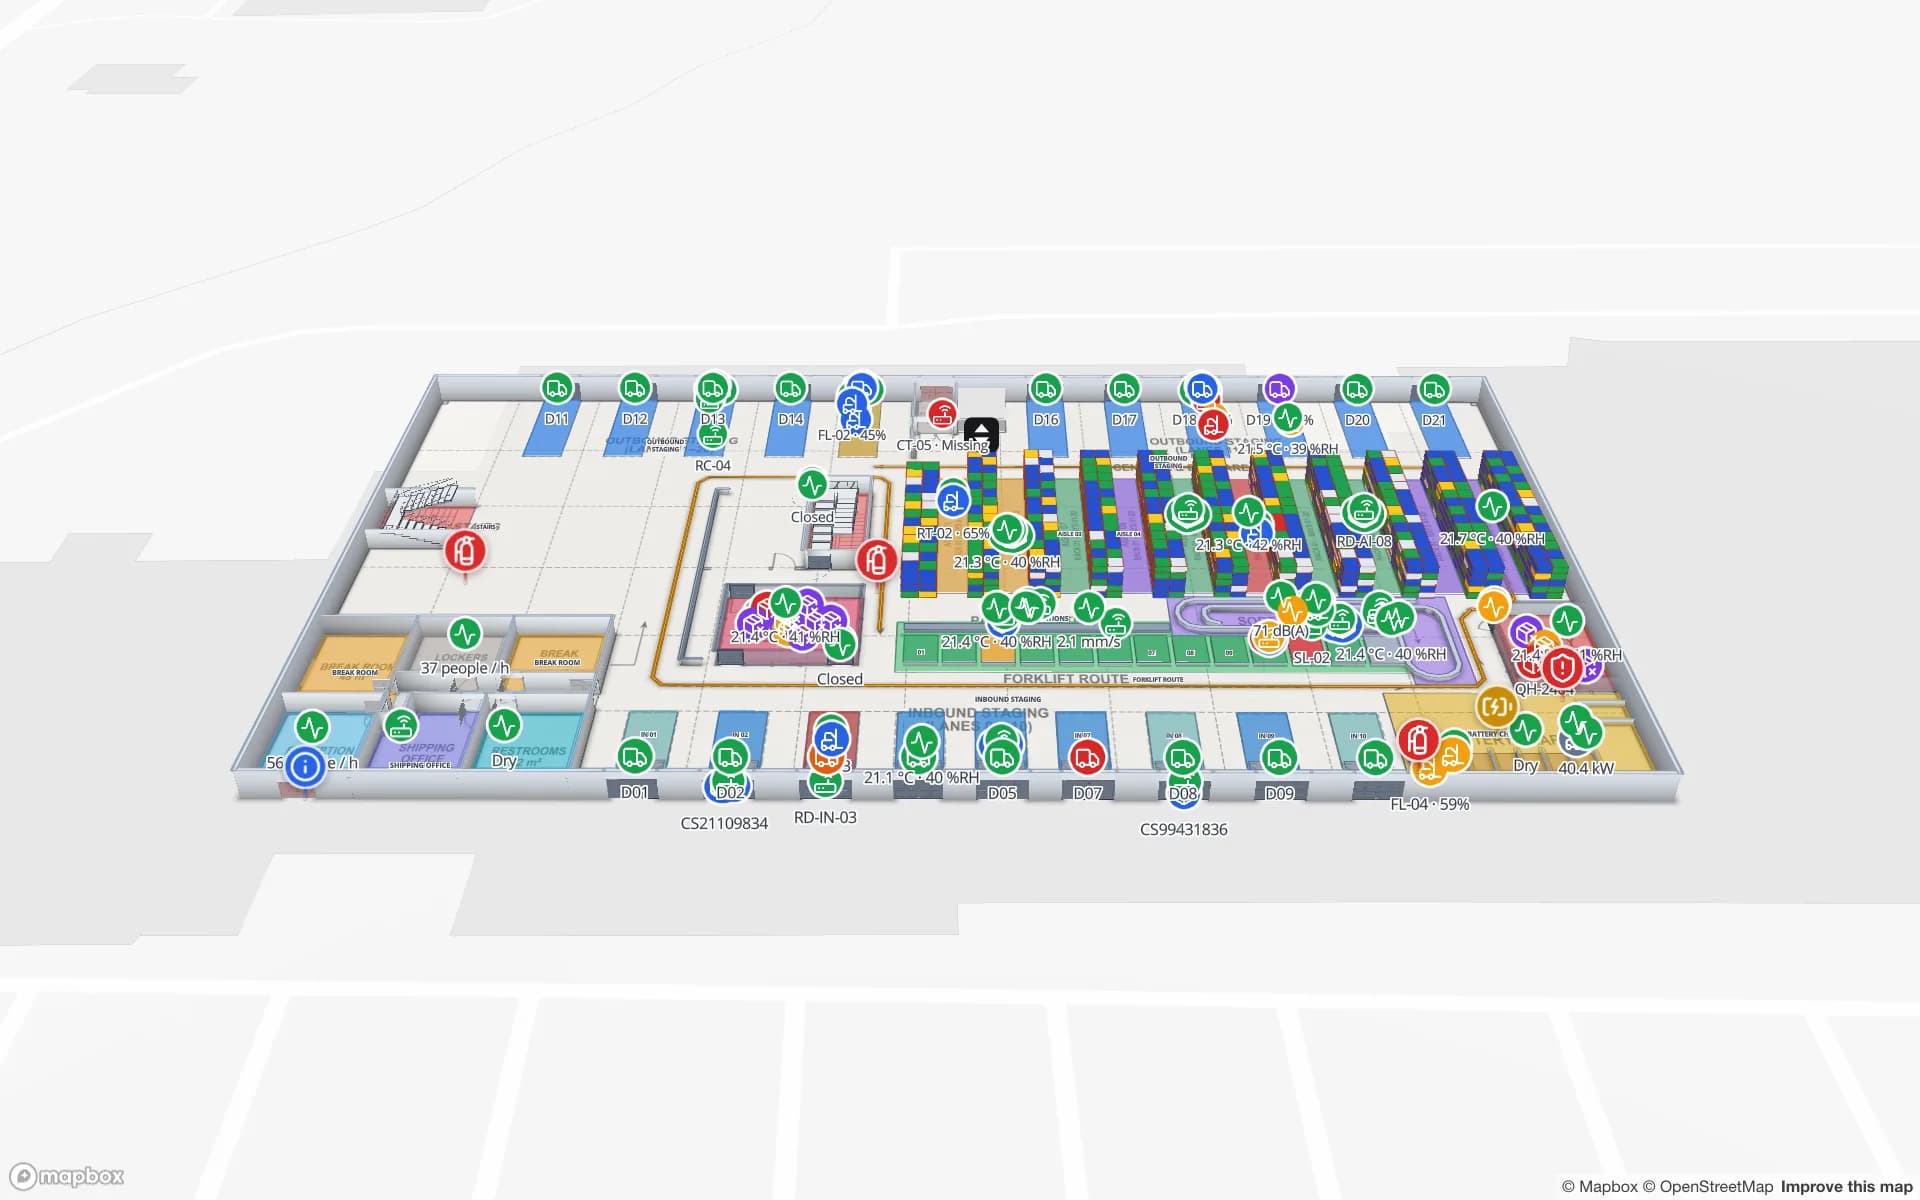
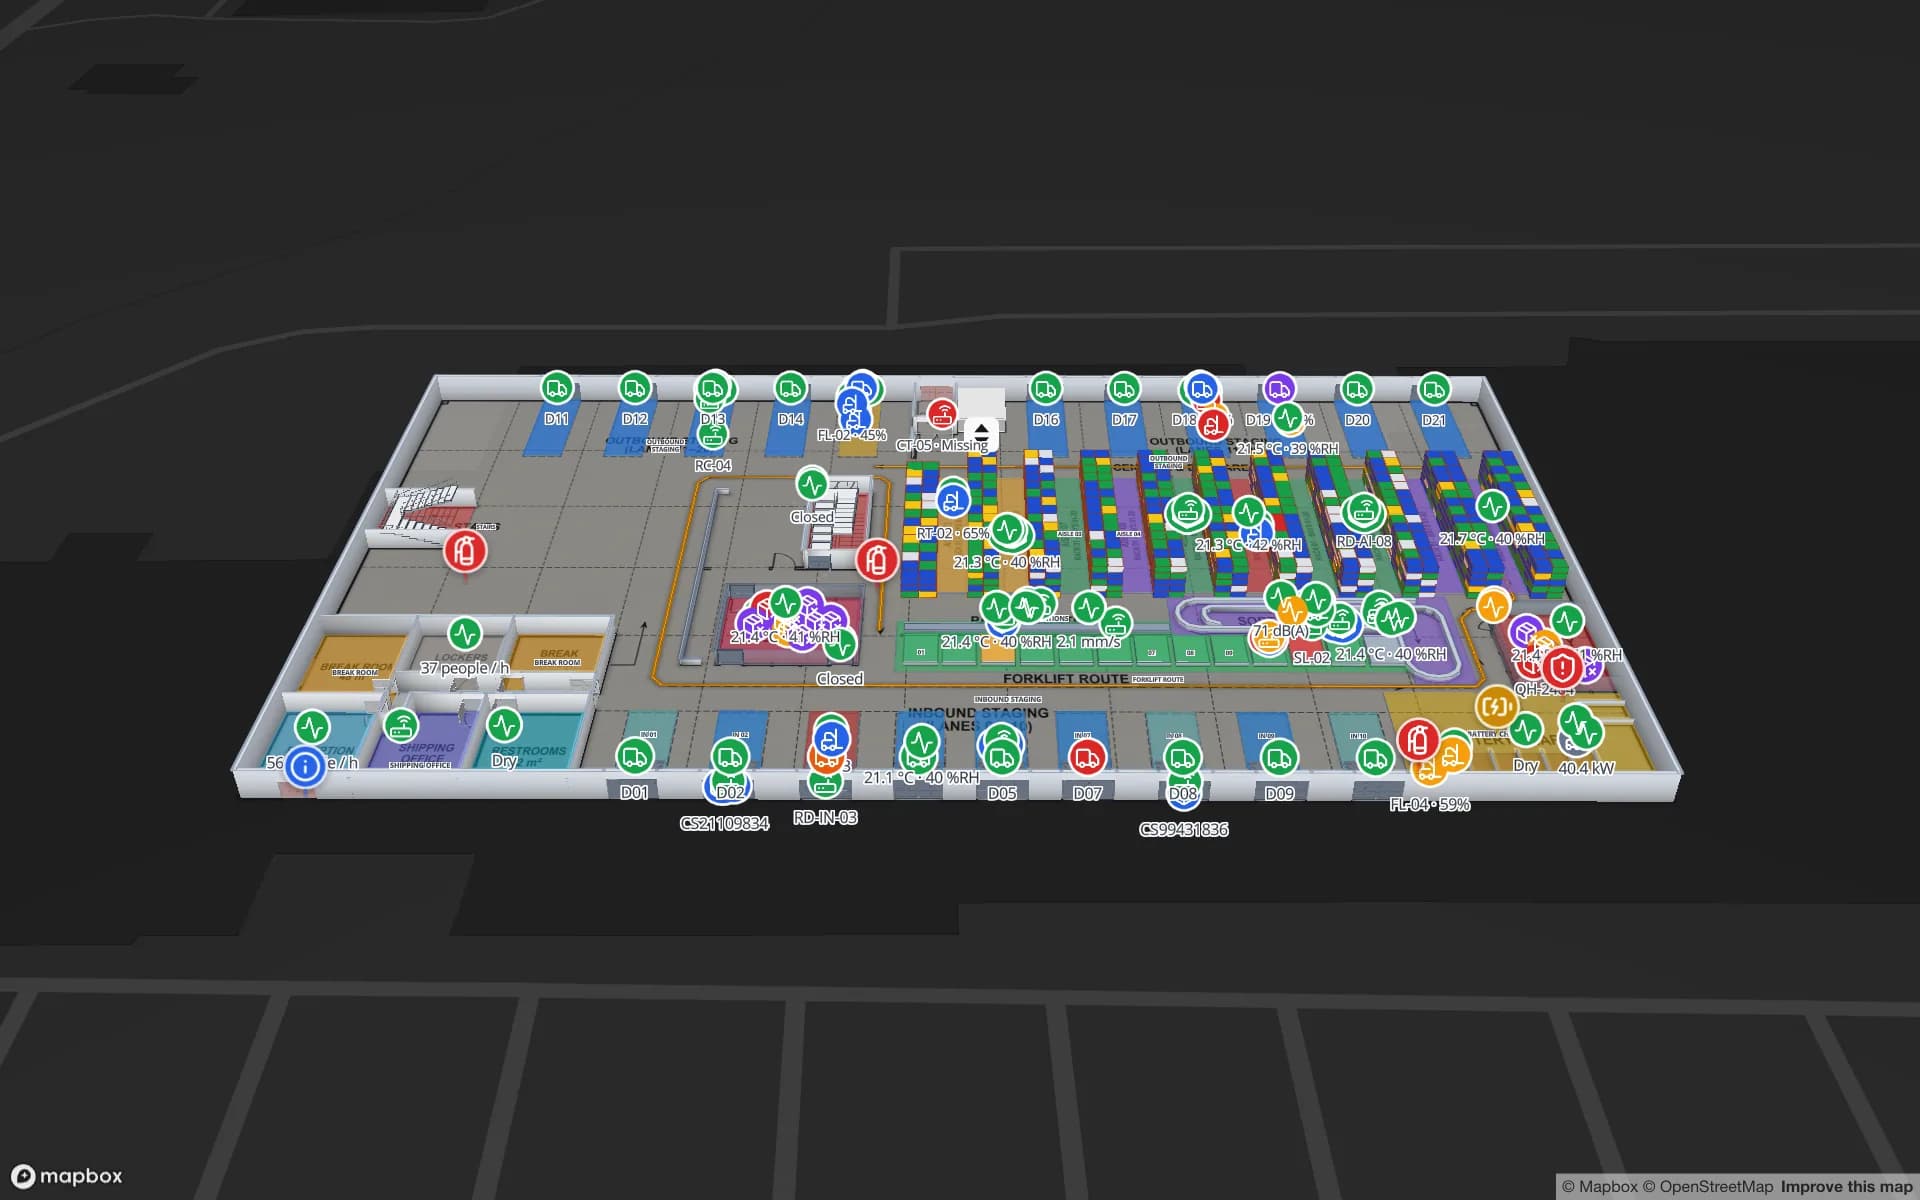
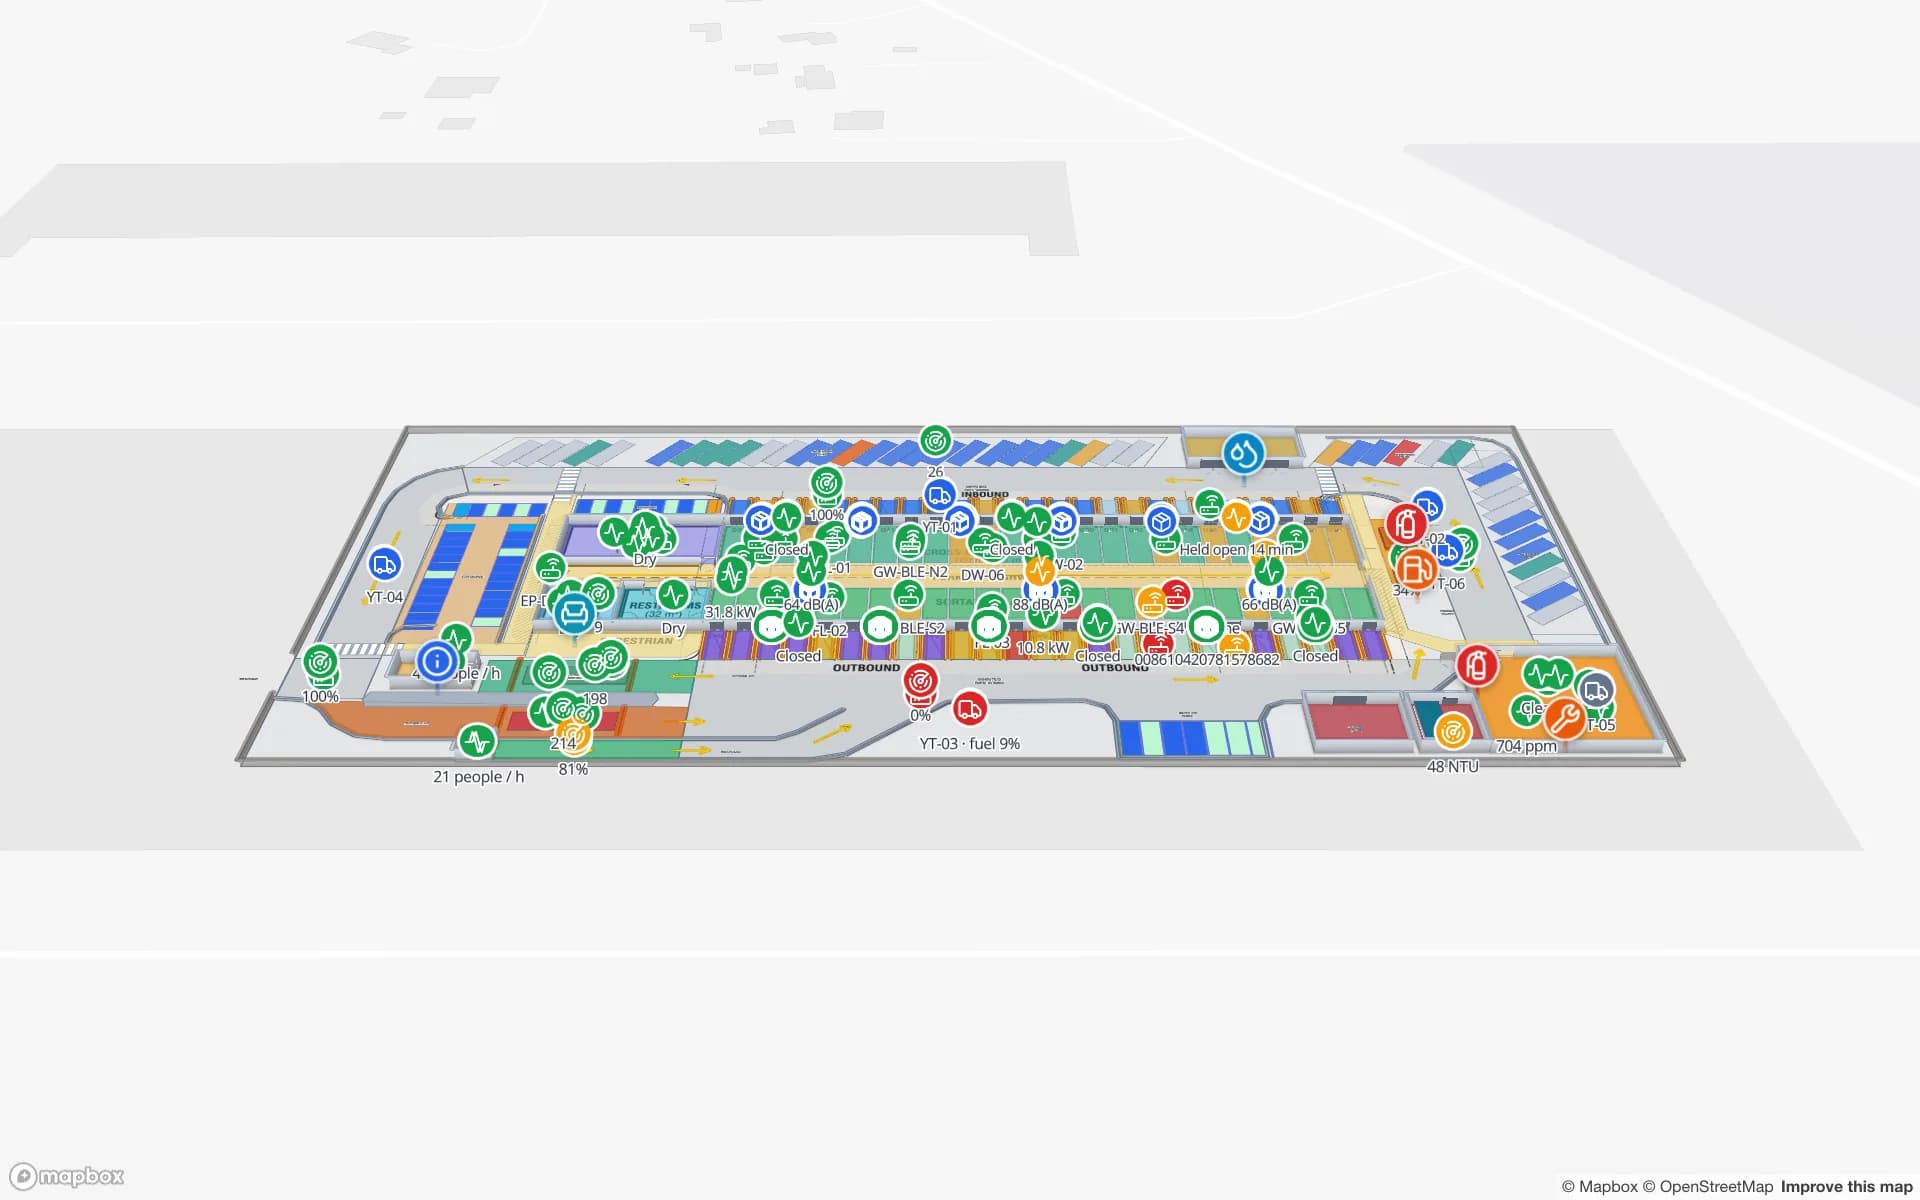
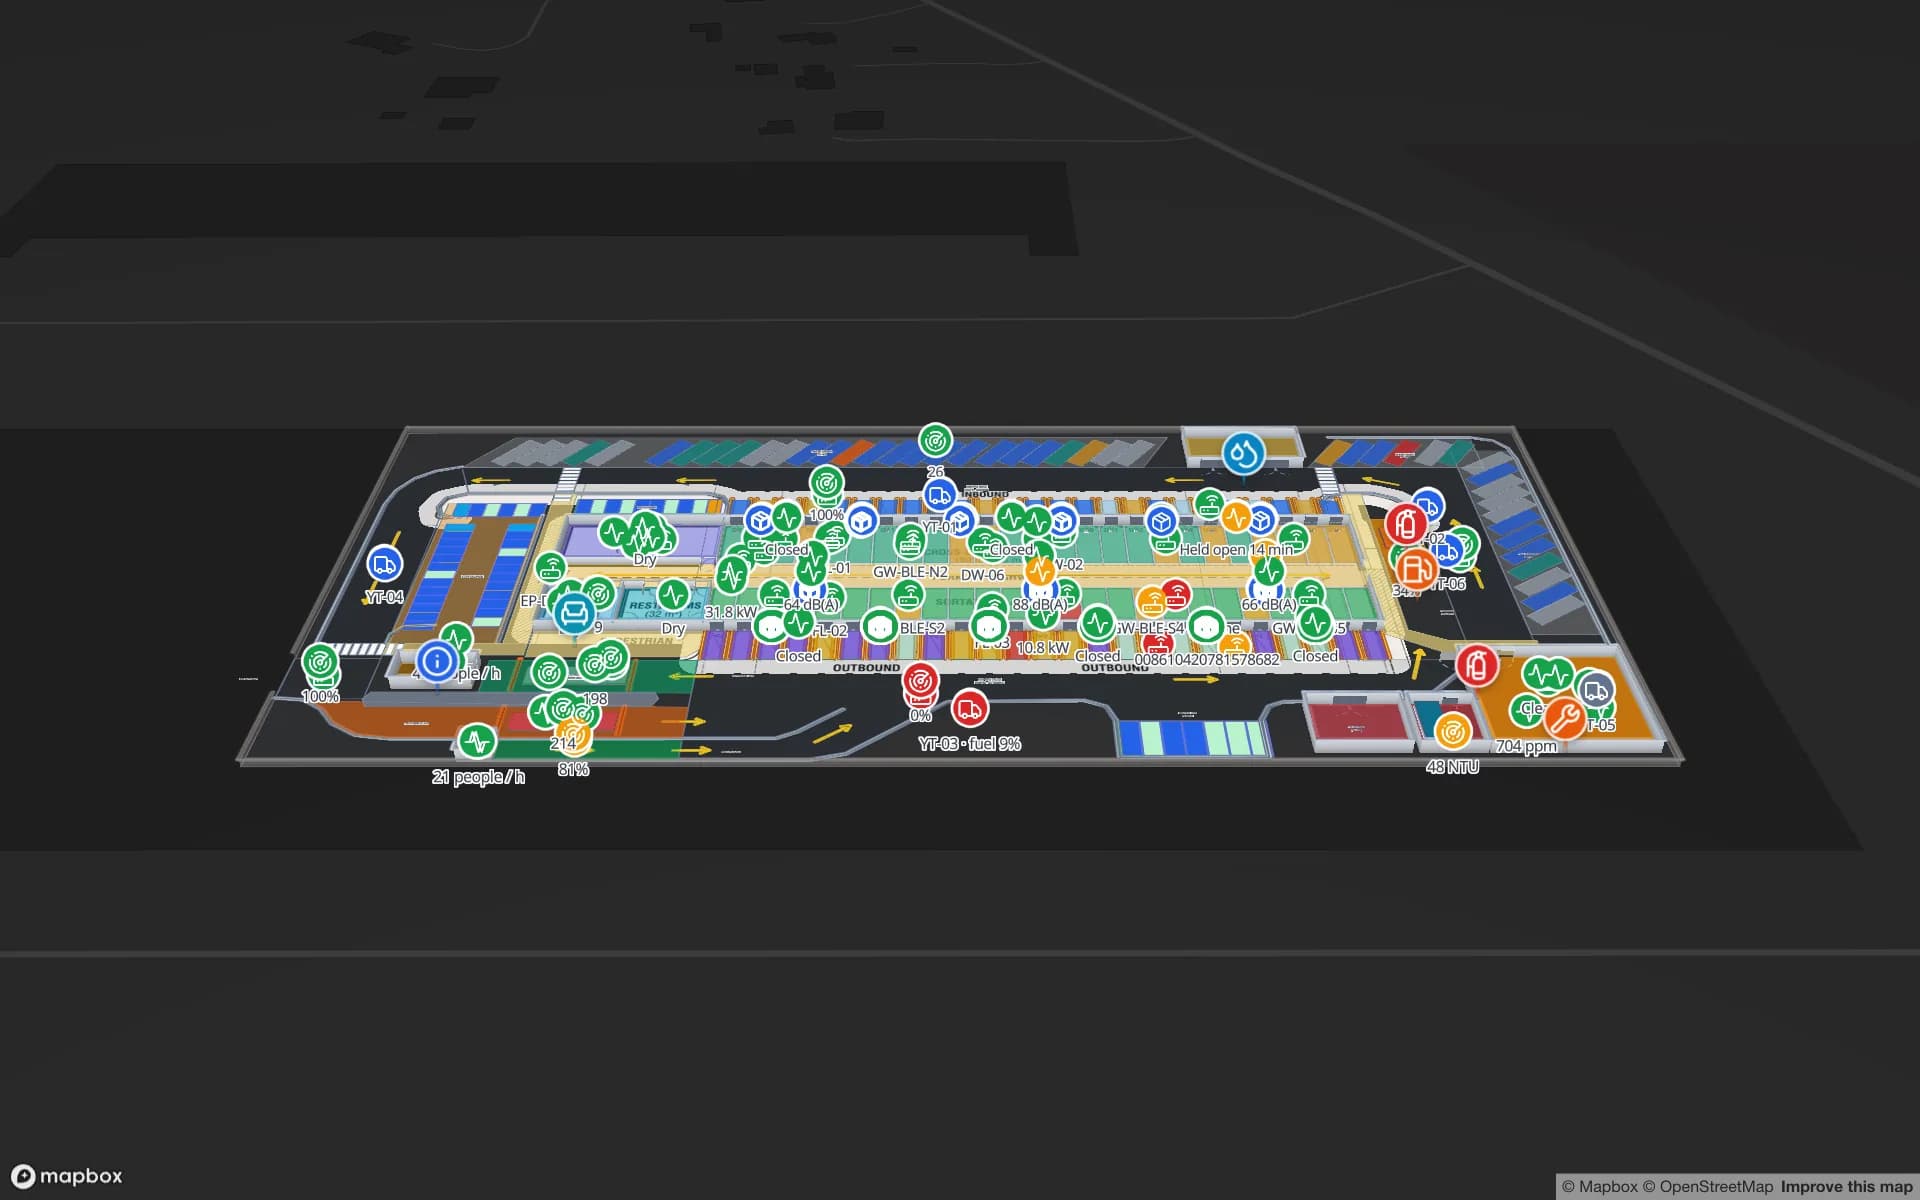
Eastport Cross-Dock Freight Hub, a cross-dock & trailer yard demo, in the Spatial Map 3D viewer with live device markers
Eastport Cross-Dock Freight Hub
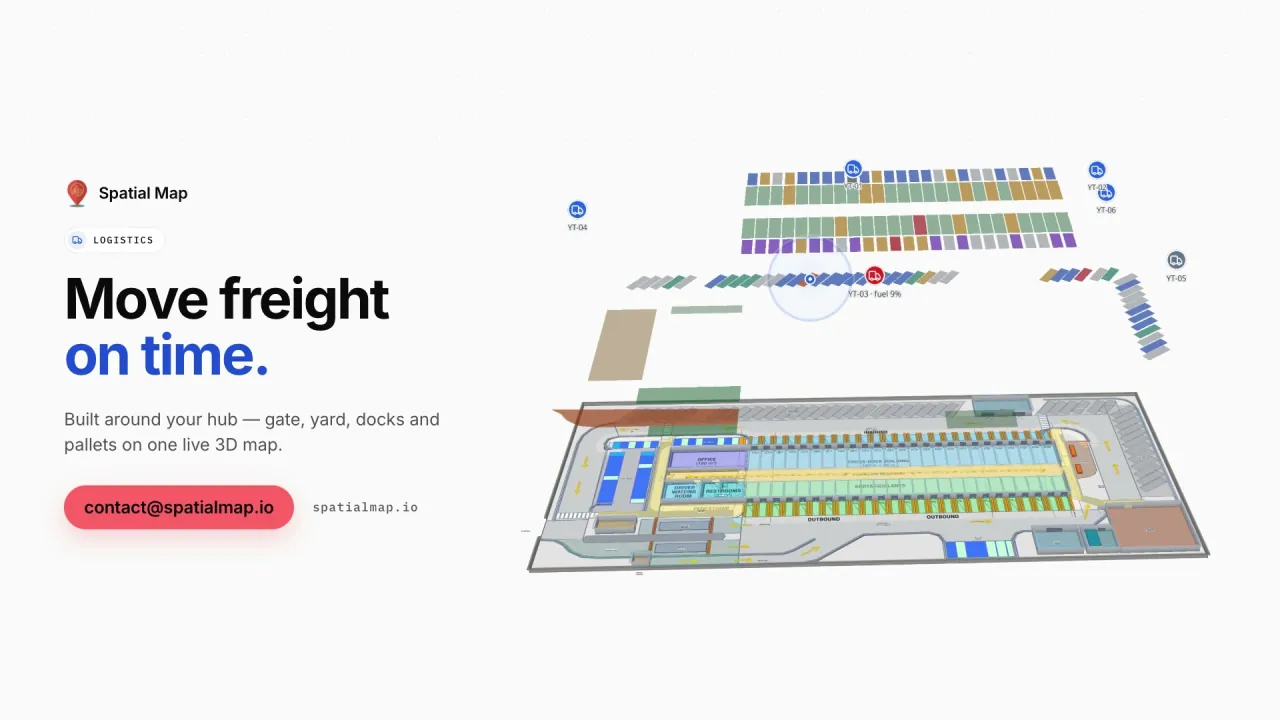
Eastport, a demo cross-dock freight hub: 1,180 RFID pallets moving through 50 dock doors, 44 yard slots and the gate and weighbridge.
RFID pallets in the Eastport cross-dock demo
1,180
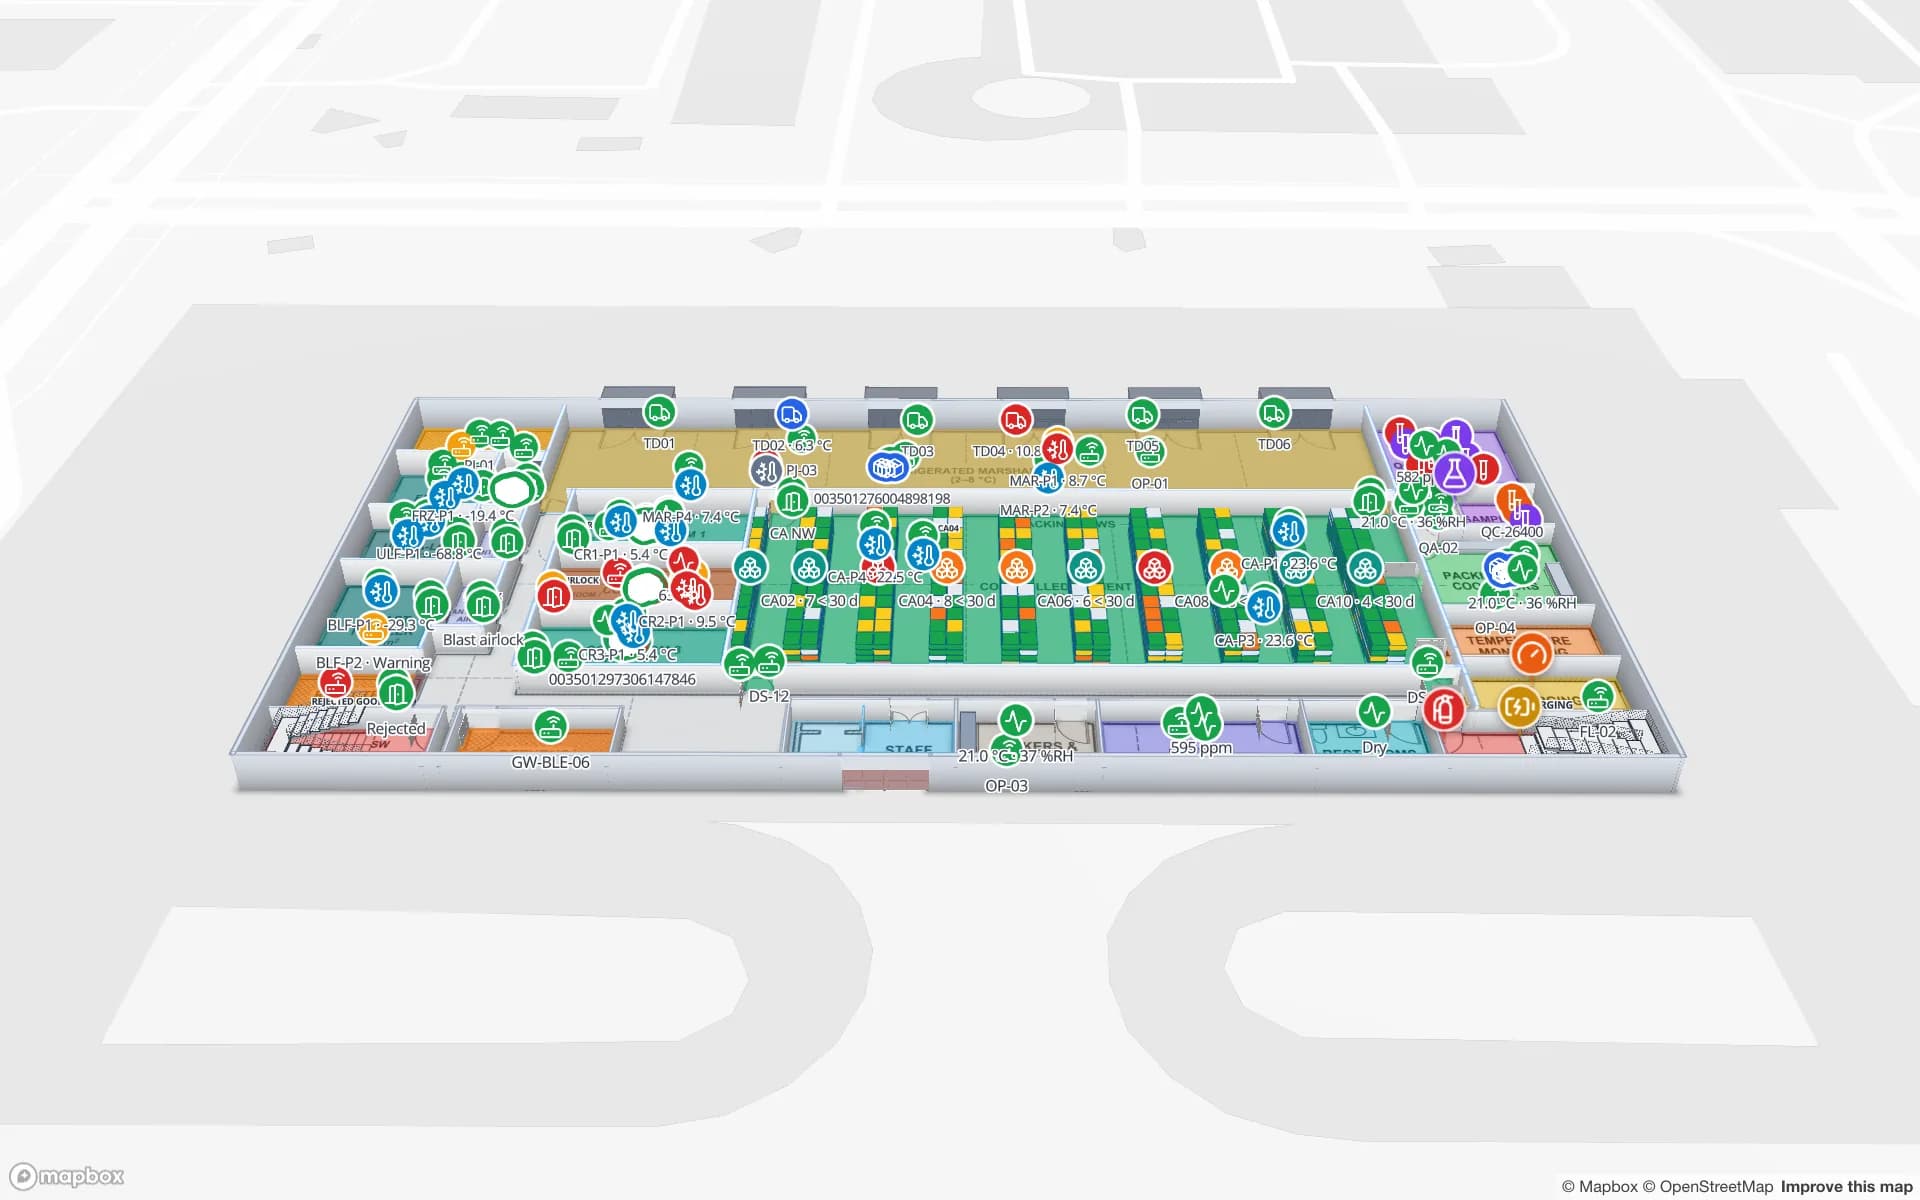
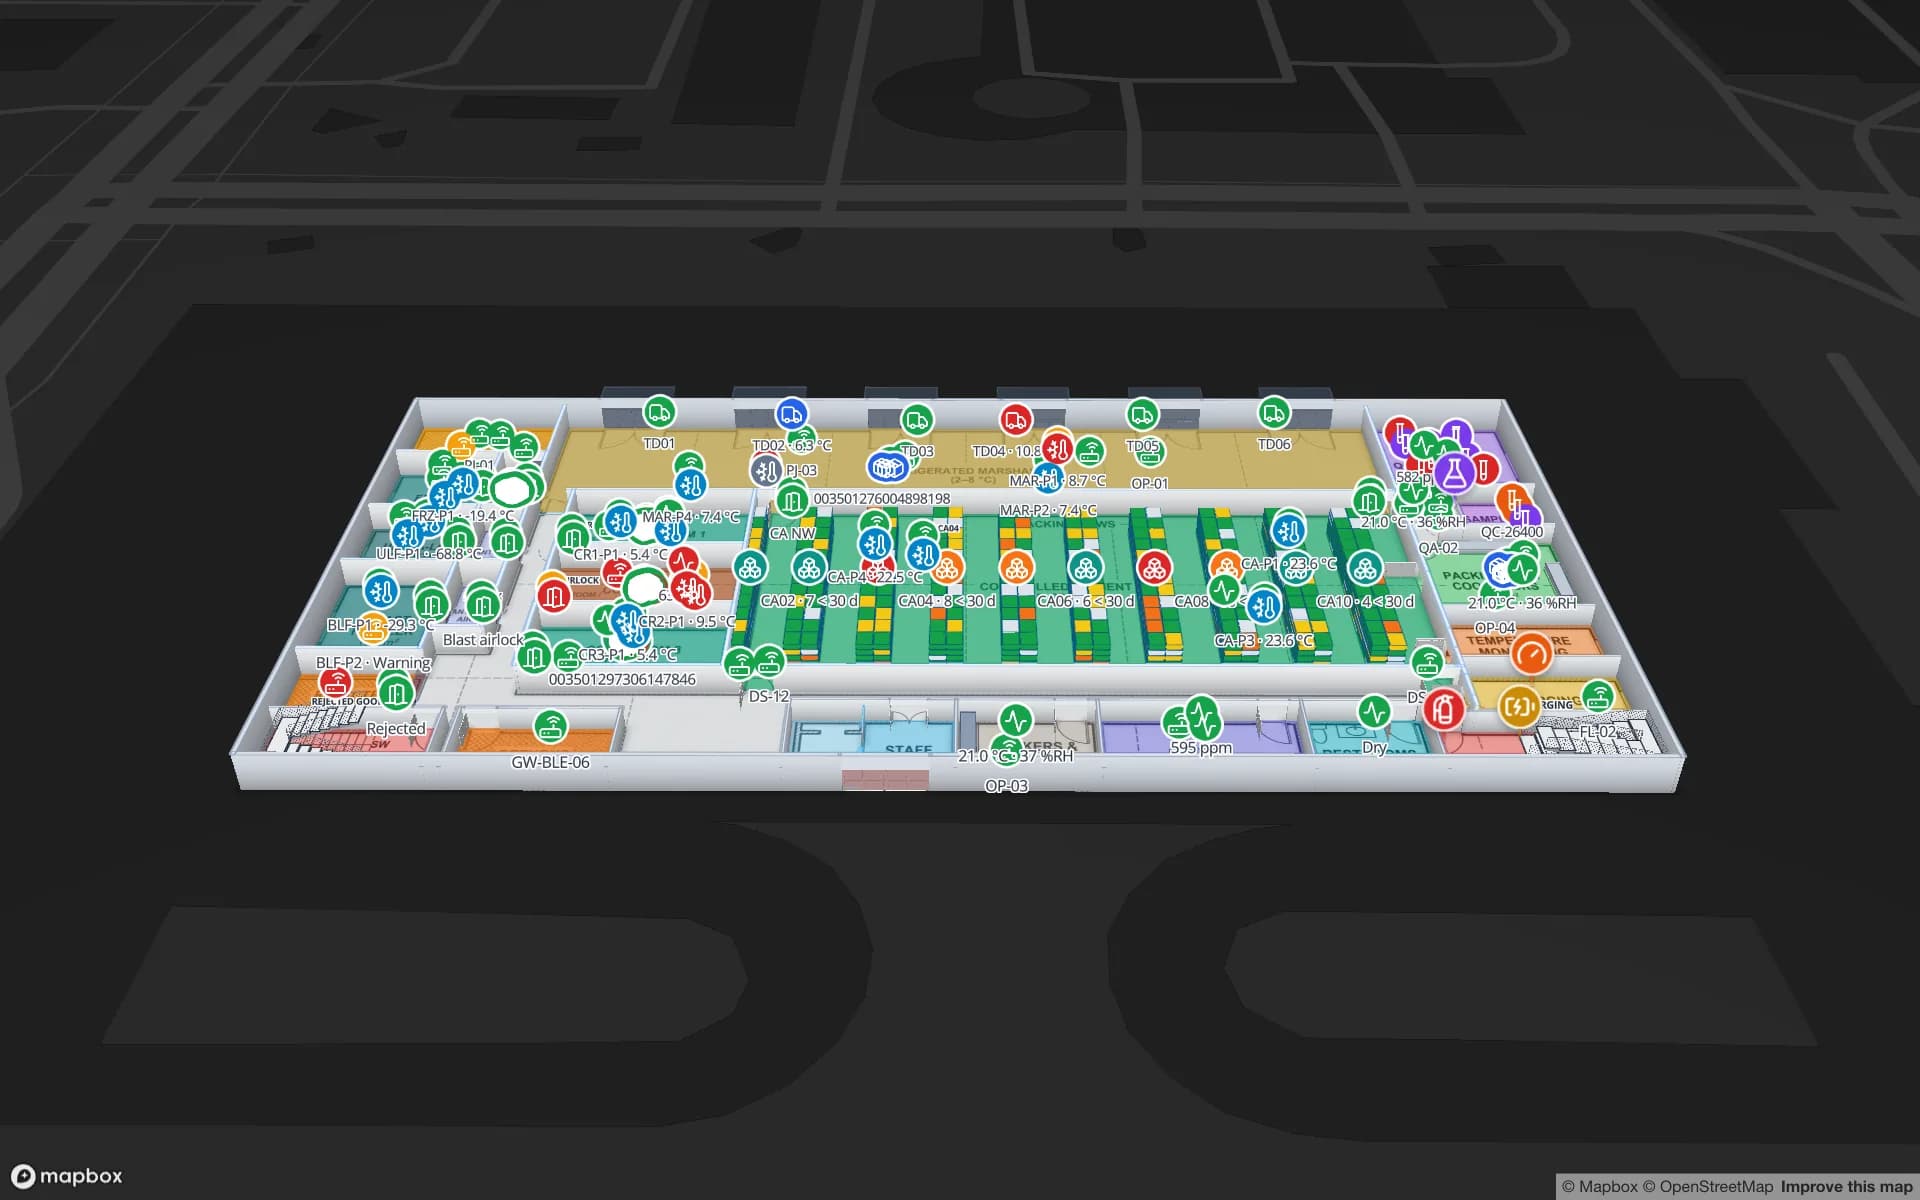
Rack locations in the Polar Pharma cold-store demo
1,140
Software to install at remote sites
0
Free trial, no credit card
7 days

Grocery and general merchandise

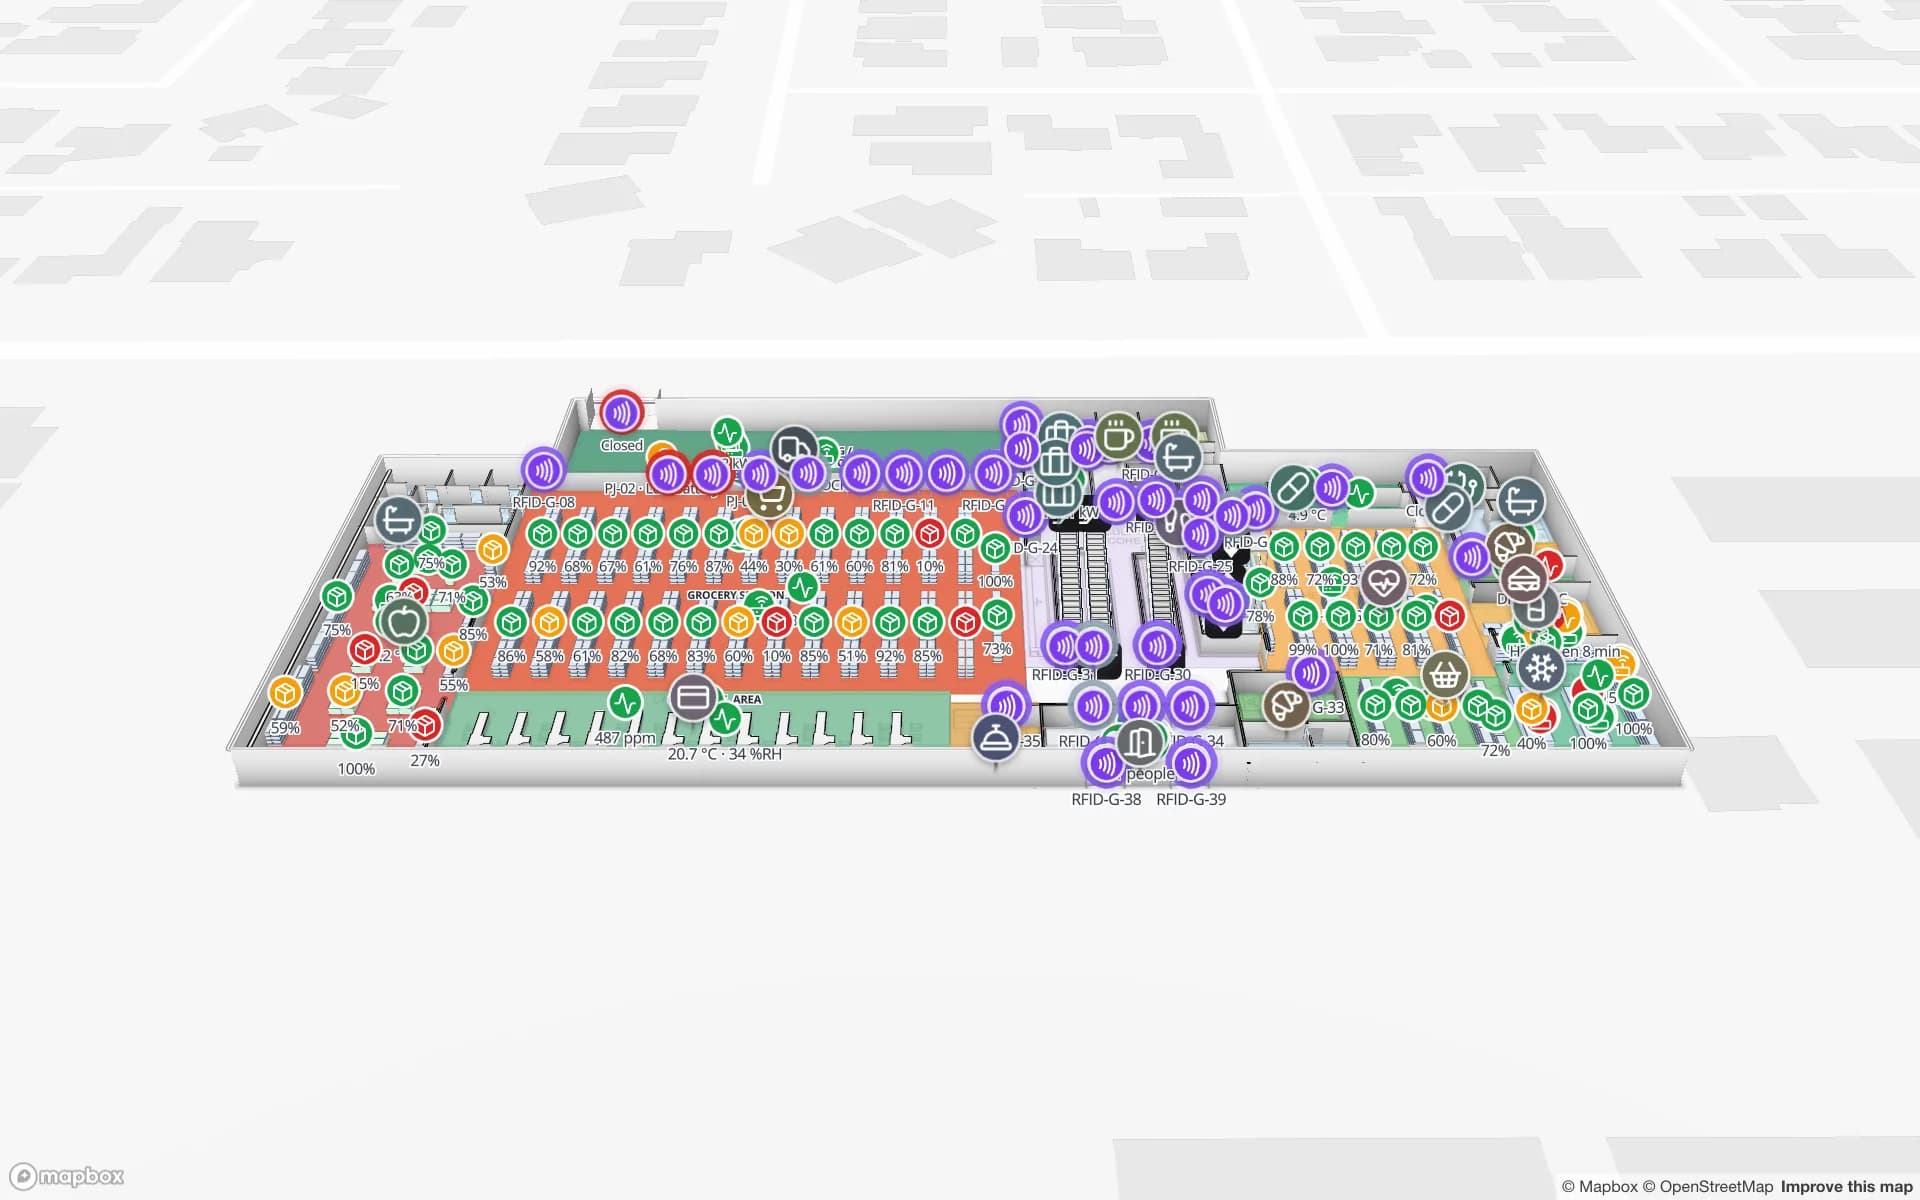
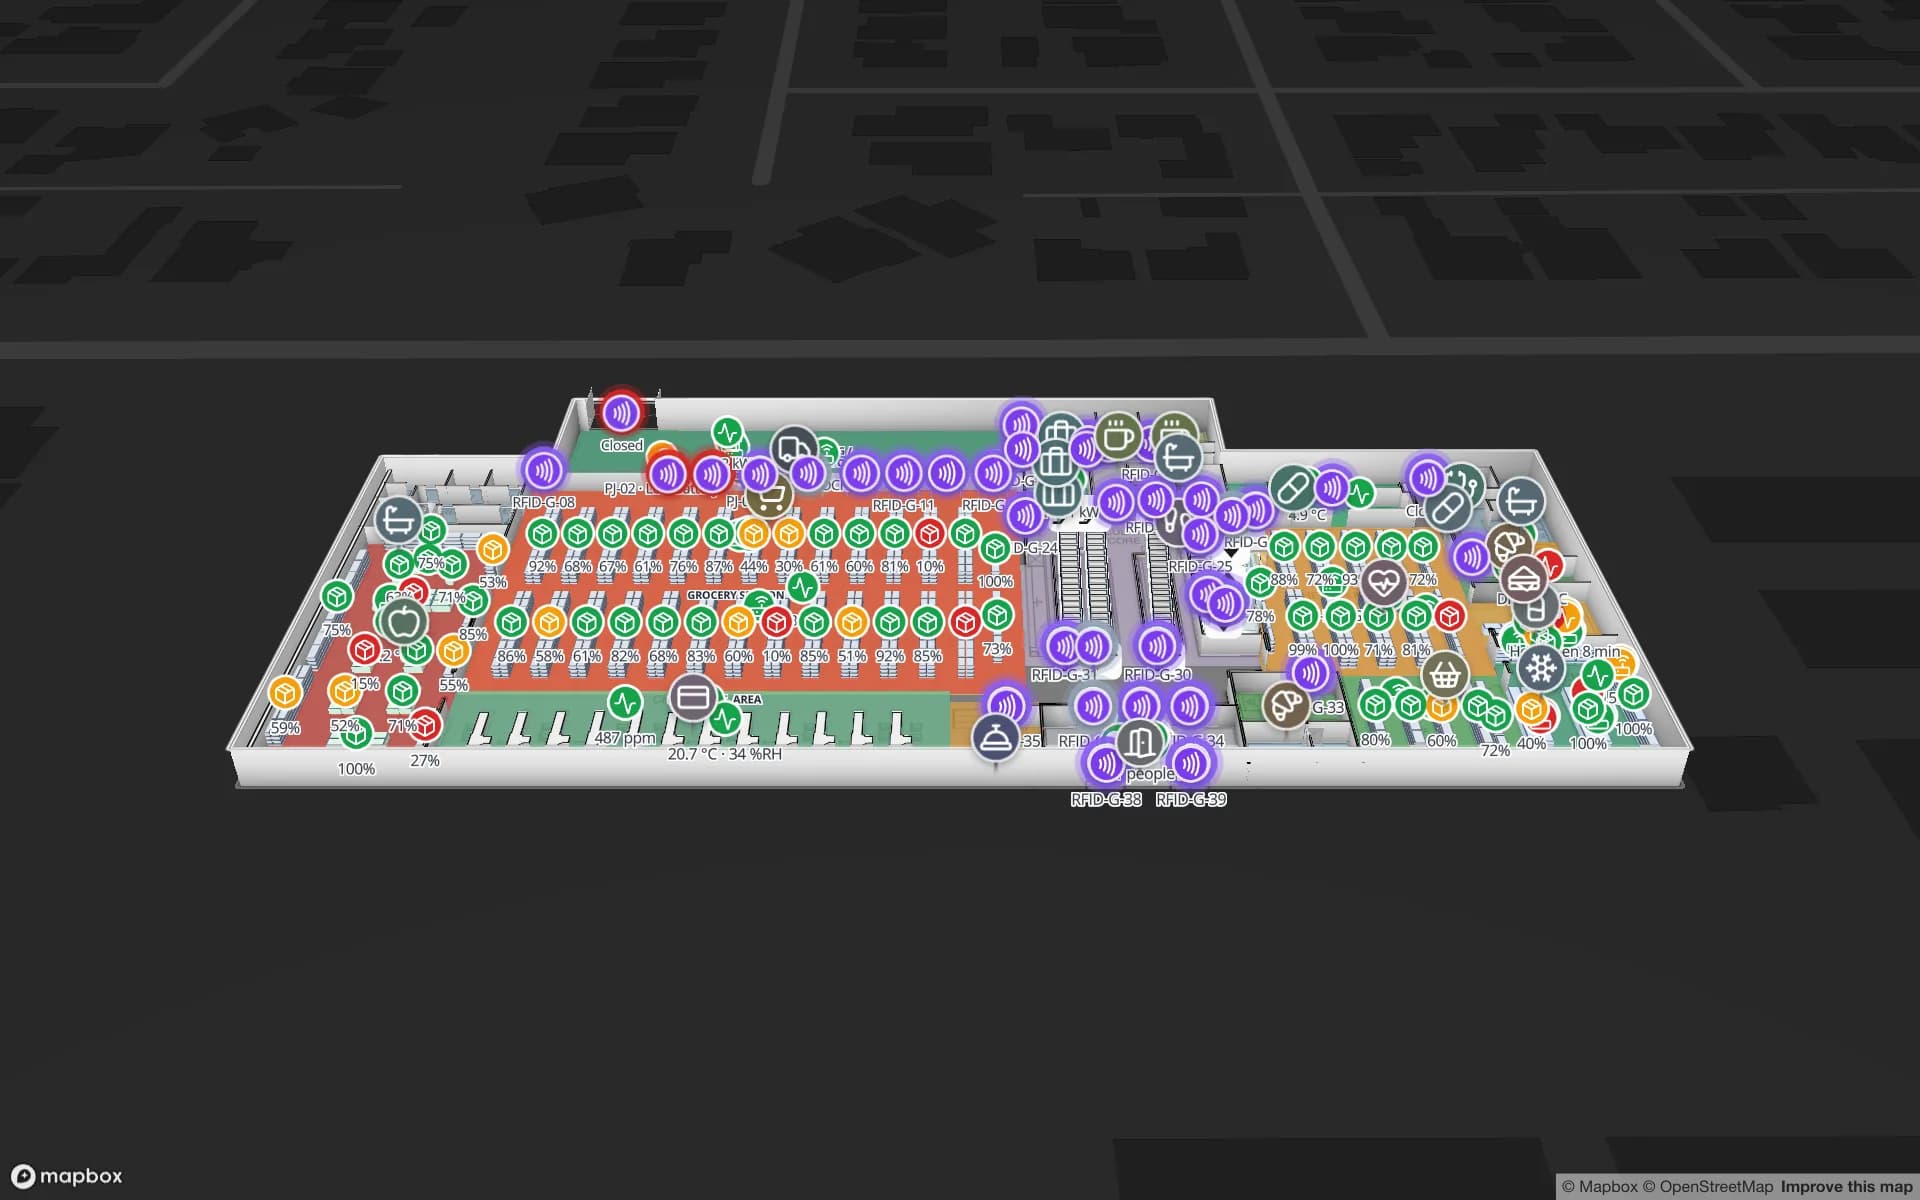
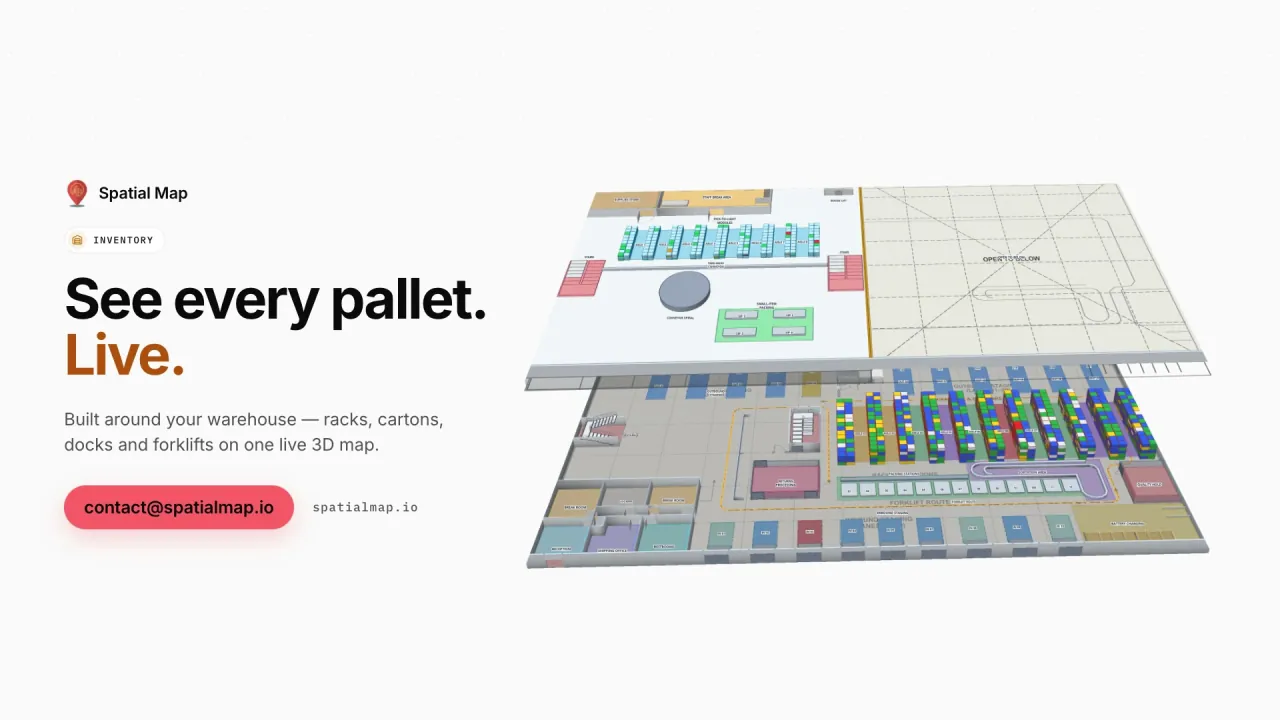
In Australian grocery and general-merchandise retail, RFID tends to arrive first on the things that move between buildings — pallets, crates and cartons — and on higher-value categories in store, such as apparel, homewares and electronics. Reads at the DC dock door, the store’s receiving dock and the back-of-house door into the sales floor show where stock is in that chain. Spatial Map places each reader at its door and each tagged item or pallet at the reader that last saw it, and the Retail Mart demo shows refrigerator and freezer temperatures on the same floors as the RFID readers.

For how tags, readers and middleware fit together, see our general RFID tracking software page. This page covers the Australian settings: pooled equipment, export cold chains, mining supply and 3PLs.
Pooled pallets and returnable crates

Pooled pallets and reusable produce crates are widely used in Australian food and grocery supply chains, and pooled equipment is usually hired — so a pallet sitting forgotten in a corner of the yard keeps costing money until it is sent back or transferred. Tagging the equipment and reading it at dock doors turns those movements into data: how many came in on a delivery, how many went out on a return run, which lane or bay is holding a stack.

Spatial Map shows those counts on the dock doors, lanes and yard bays where they happen, as in the Eastport demo. Reconciliation with the pool operator — transfers, de-hires, account balances — stays in your own system; if it calculates a balance per site, that figure can sit on the site in a report.

Export cold chains: meat, dairy and seafood

Australia is one of the world’s major exporters of beef, and dairy and seafood exports are significant too. The product leaves a processing plant’s chillers and freezers, waits in a cold store, and is loaded into reefer containers for the port. Carton and pallet tags read at blast-freezer exits, cold-store doors and the load-out dock show where each consignment is; temperature readings from your sensors, posted to another table, colour the cold rooms on the same map.

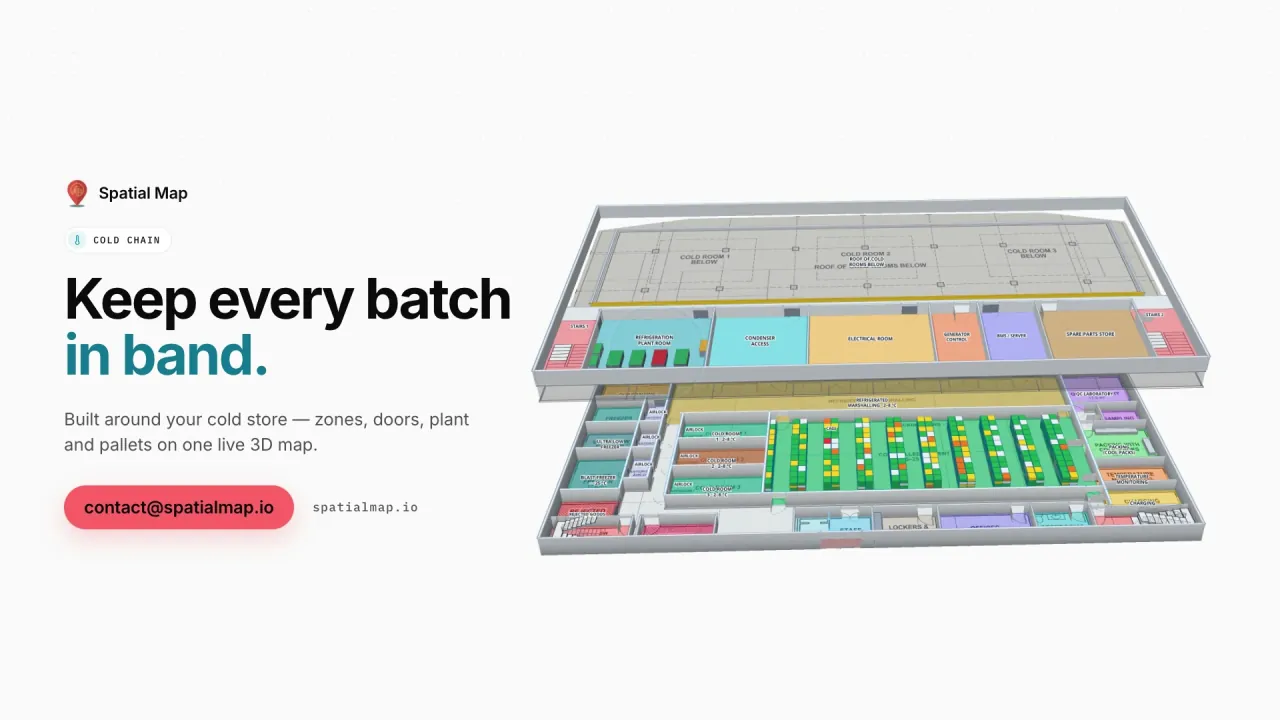
The Polar Pharma demo shows the pattern in a cold store: temperature zones tinted from their probes, cold-room doors, reefer docks and pallets on hold across 1,140 rack locations. Export documentation and the records your QA team keeps for government export requirements stay in your own systems — Spatial Map makes the physical picture visible next to them.

Mining supply warehouses and tool cribs

Mining in regions such as the Pilbara and the Bowen Basin depends on central supply warehouses in the cities and stores and tool cribs on remote sites, often staffed on fly-in fly-out rosters. Critical spares, specialist tools and gas detectors are expensive and slow to replace, and the buyer at head office rarely sees the store they are buying for. Tags read at the crib door or a pass-through reader show what was issued and returned; rack locations coloured from your inventory system show what is on the shelf.

Because Spatial Map runs in the browser, the remote store’s map is the same one head office opens — no software at the site. A local relay can collect reads and post them in batches with the table write API (bulk upsert, 60 requests a minute per key) whenever the site’s link is up. If tool issues are recorded against named workers, that is personal information under the Privacy Act 1988, and some states also have workplace-surveillance laws; your legal advisers decide what applies.

3PLs around Sydney and Melbourne

Much of Australia’s warehousing sits in Sydney’s west and Melbourne’s west and north, feeding the container ports at Port Botany and the Port of Melbourne and the interstate linehaul between them. A 3PL running sheds in both cities, and perhaps Brisbane, can keep every shed in one workspace and group a client’s sites into a solution, so the client’s view spans states. Pallets read at the dock doors are coloured by client or status on the racks, and short or mis-staged loads show on the lane before the linehaul departs.

How Spatial Map does it

From dock-door reads to a national picture

  1. 01

    Map each site

    Import the DC, cold store or remote warehouse plan from PDF or DWG and draw docks, racks, cold rooms and cribs.

  2. 02

    Place the readers

    Add a marker or zone for each dock door, cold-store door and crib reader, named like its reader ID.

  3. 03

    Batch the reads

    A relay or your middleware posts reads to a table, or Spatial Map polls its REST endpoint on a schedule.

  4. 04

    See every state at once

    Group sites into solutions, build reports and give head office or clients read-only links.

RFID use cases for Australian operators

Grocery stores and DCs

Receiving, back-of-house and sales-floor reads next to fridge and freezer temperatures.

Pooled pallets and crates

Equipment counted in and out by dock door, lane and yard bay.

Export cold stores

Cartons and pallets by cold room and reefer dock, with temperature zones on the same map.

Mining supply and tool cribs

Spares and tools issued and returned at the crib door, visible from head office.

Interstate 3PL sheds

Pallets by client on racks and staging lanes before the linehaul leaves.

See it on real demo facilities

Fictional names, real floor plans, live sensors, RFID, BLE tags and gateways — open any of them in the browser.

All 13 demo facilities

RFID in Australia — frequently asked questions

No. Spatial Map is sold online and our team works with Australian customers remotely, by video call and through the contact form. Everything runs in the browser, so nothing needs to be installed at your sites.

Yes. Equipment read at dock doors appears at those doors, lanes and yard bays on the map. Reconciliation with the pool operator — transfers, de-hires and balances — stays in your own system, and its figures can be shown in reports.

Yes. The map runs in the browser, so head office opens the same map as the site. Reads reach it when a relay or your middleware posts them to a table, which can happen in batches whenever the site’s connection is available.

Any fixed readers, portals or handhelds your supplier specifies for Australia’s radio-frequency rules. Spatial Map has no reader drivers: your middleware posts reads to a table with the write API, or exposes a REST endpoint Spatial Map polls.

The same worldwide, in US dollars: a 7-day free trial for up to 5 facilities with no credit card, then Pro at $60 a month or $600 a year for up to 4 facilities. Networks of sites are quoted as custom services.

See your pallets, cold stores and cribs on one map.

Start a free trial and open the Eastport and Polar Pharma demos, or send us a floor plan and a sample of your reads through the contact form.