San Diego · Biotech labs, Otay Mesa, plants on both sides of the border

Asset tracking in San Diego, from the lab bench to the border crossing

Spatial Map shows where tagged equipment, instruments and returnable containers are on a live 3D map of each building, using the reads and positions your RFID and BLE systems already produce. Asset tracking in San Diego has two problems that most cities do not: expensive, shared equipment spread across many lab floors, and assets that cross an international border and come back. Each building is its own facility, and facilities on both sides of the border can sit in one workspace.

No credit card. Runs in the browser. Pro is $60/month for up to 4 facilities. Book a demo

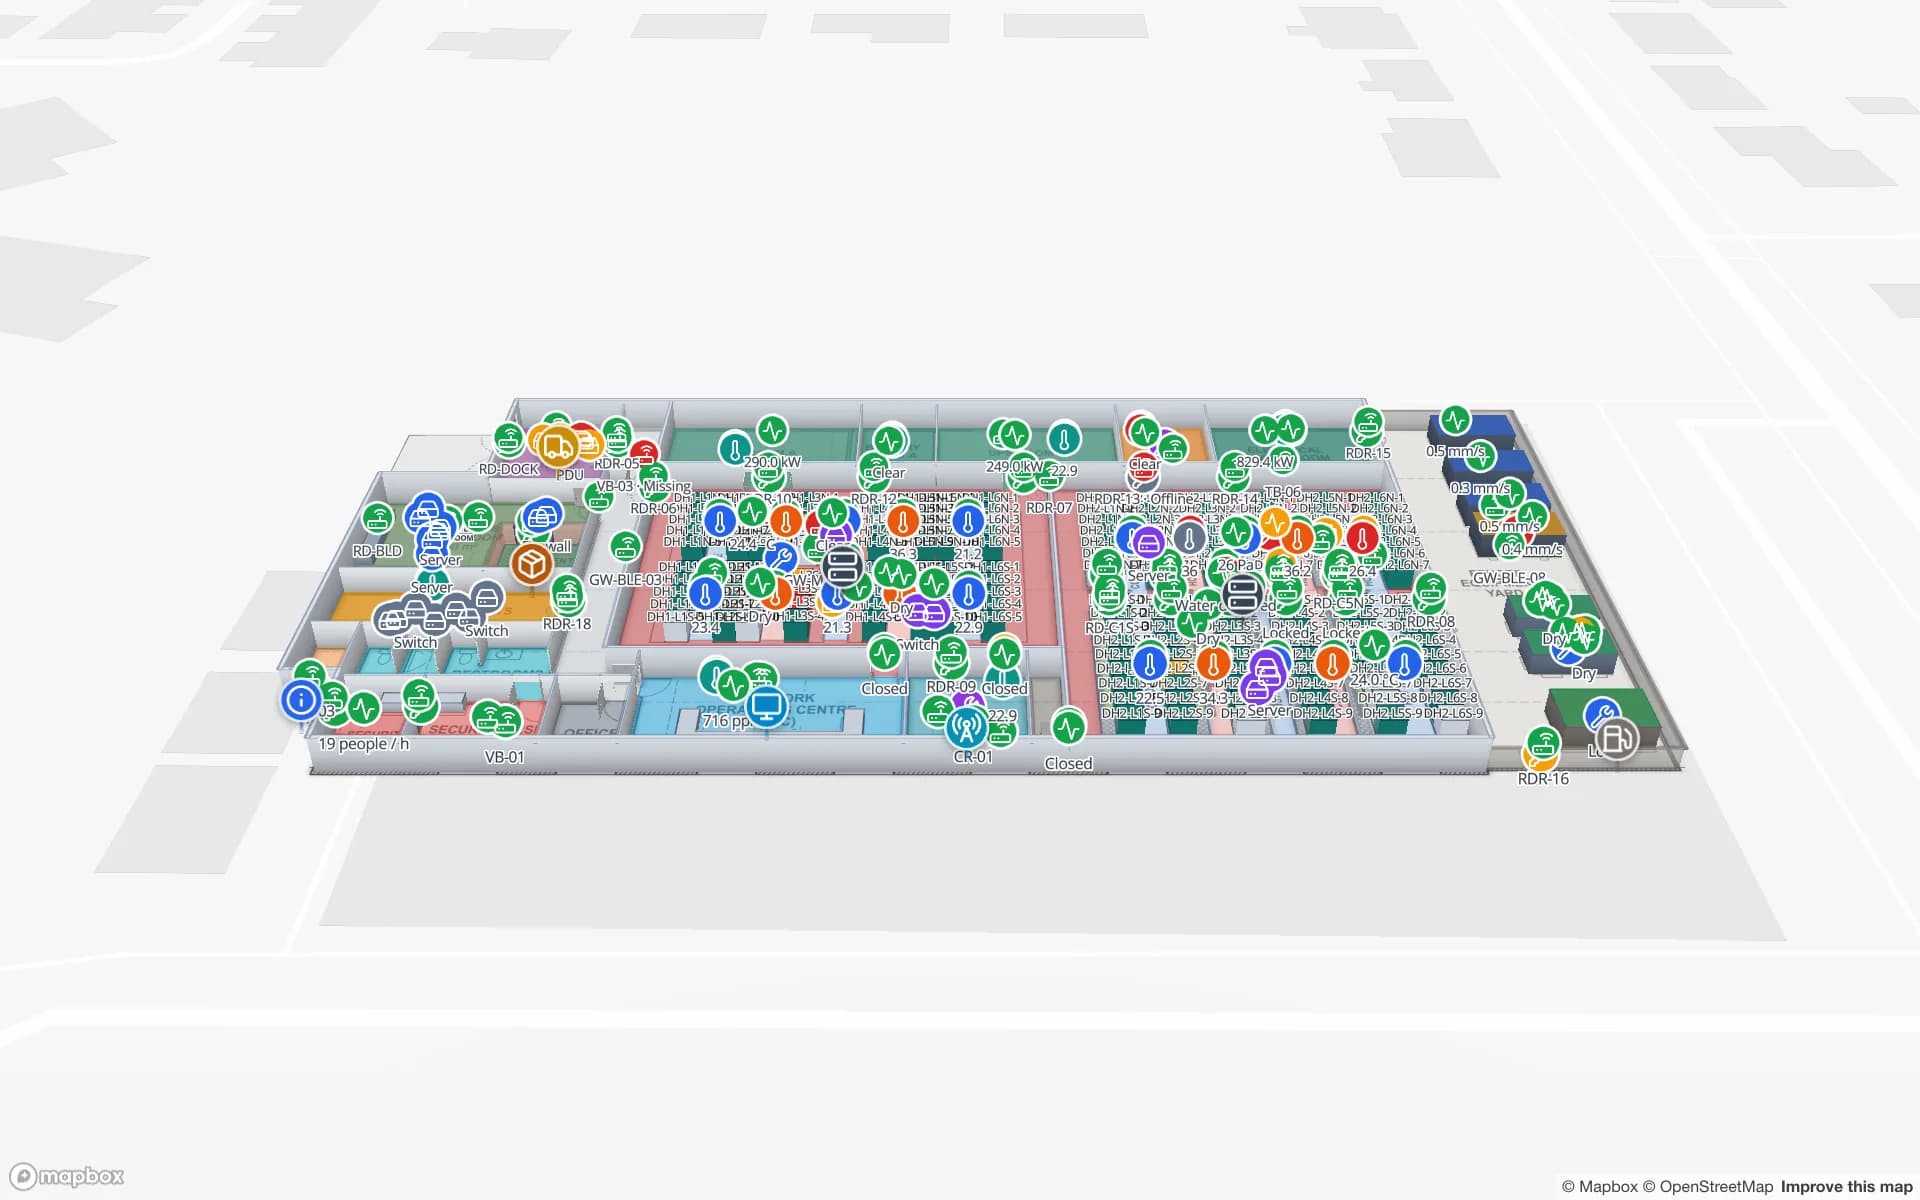
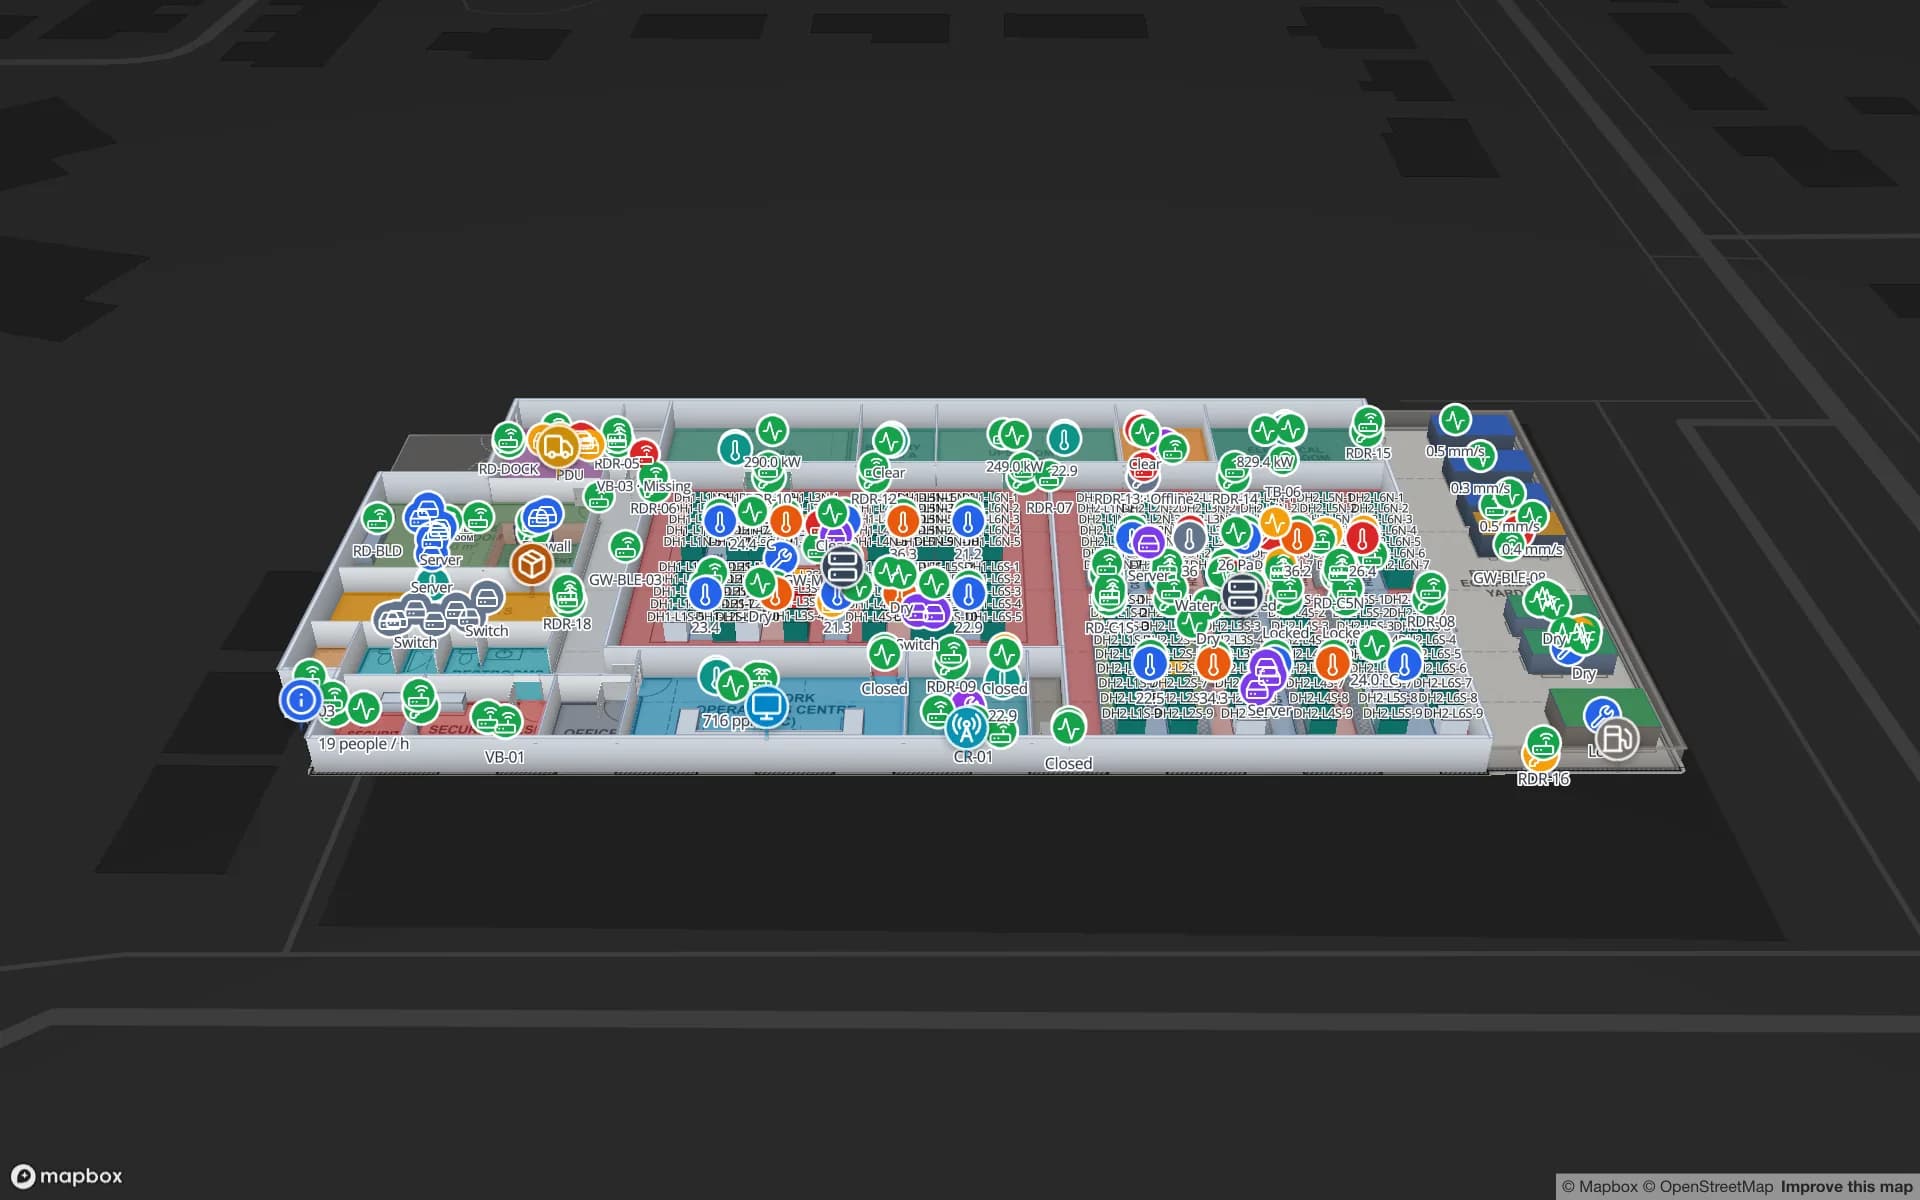
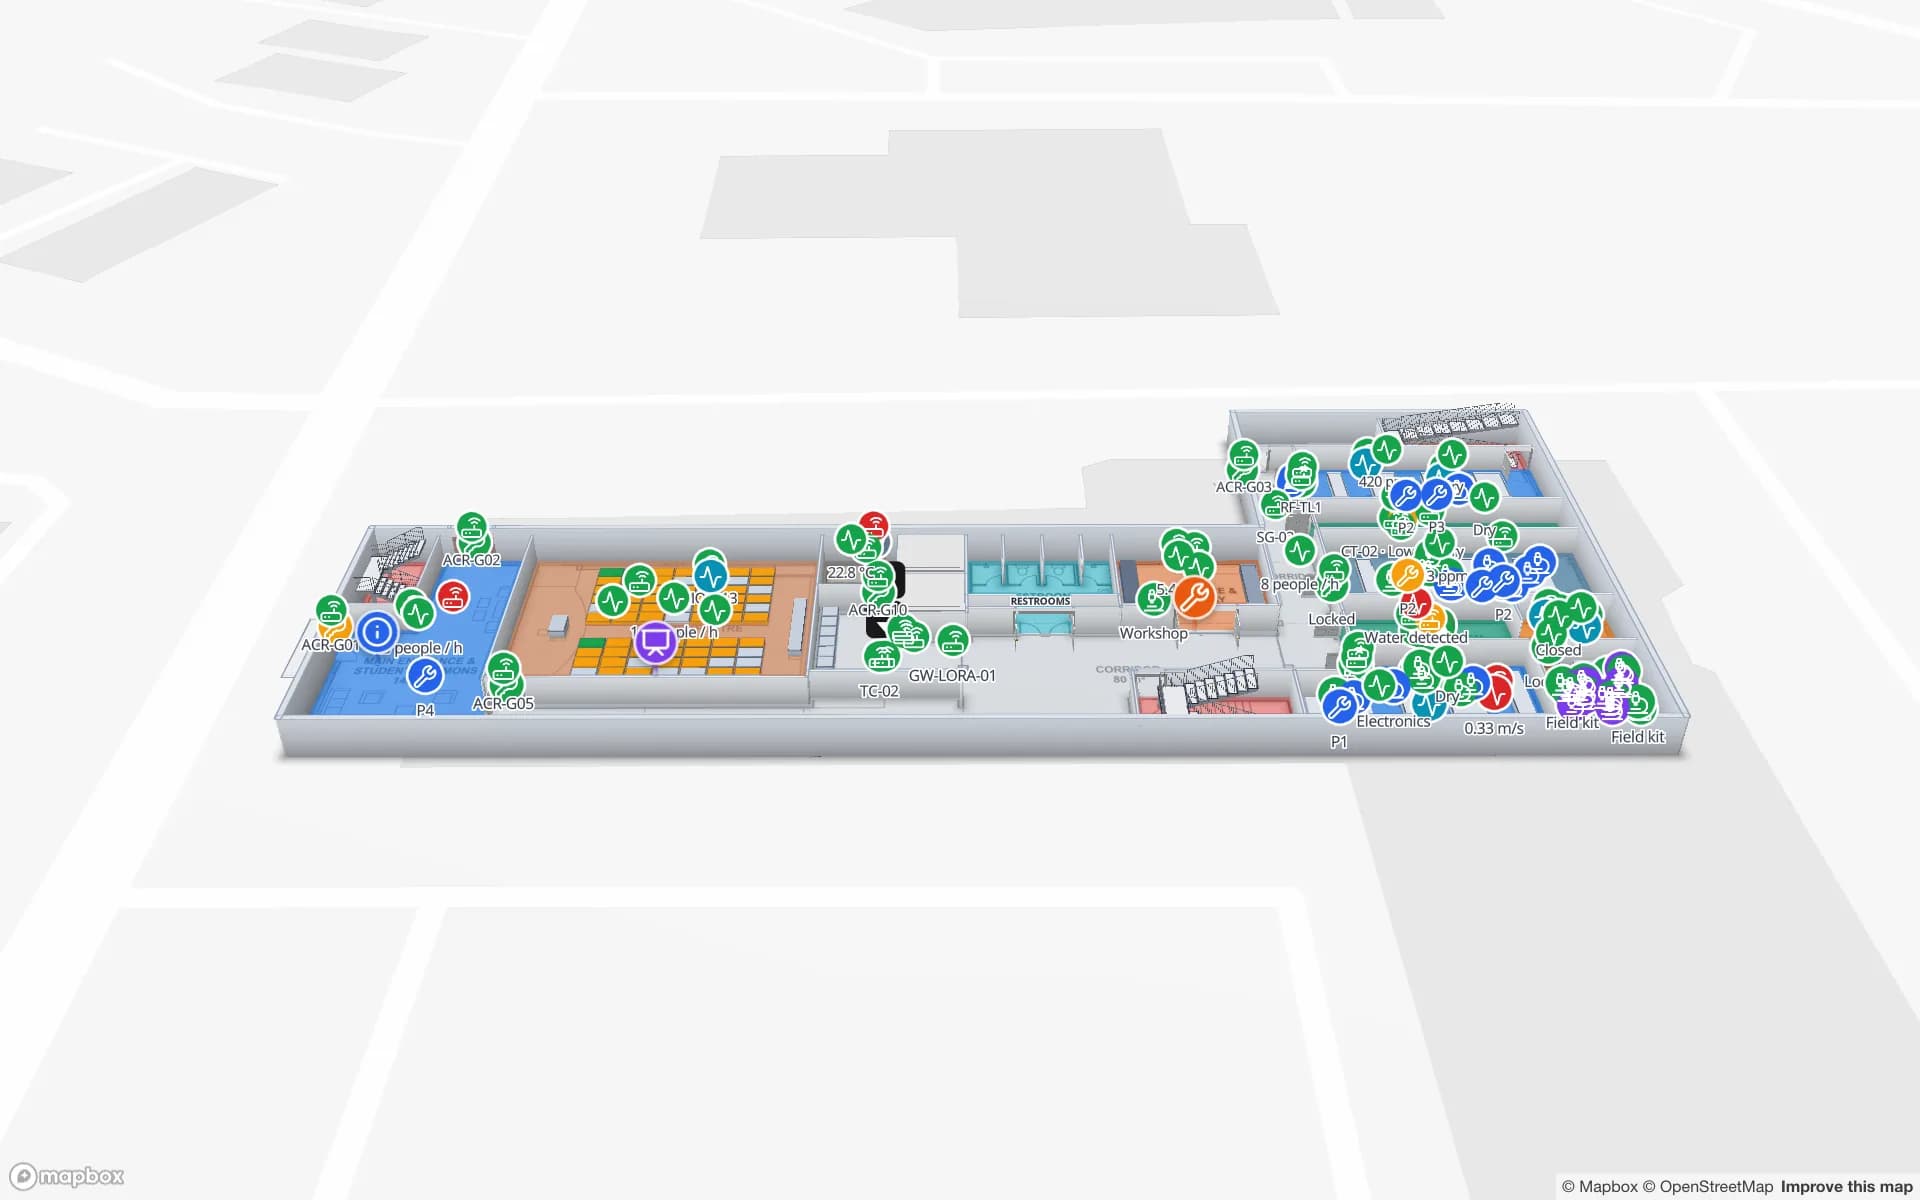
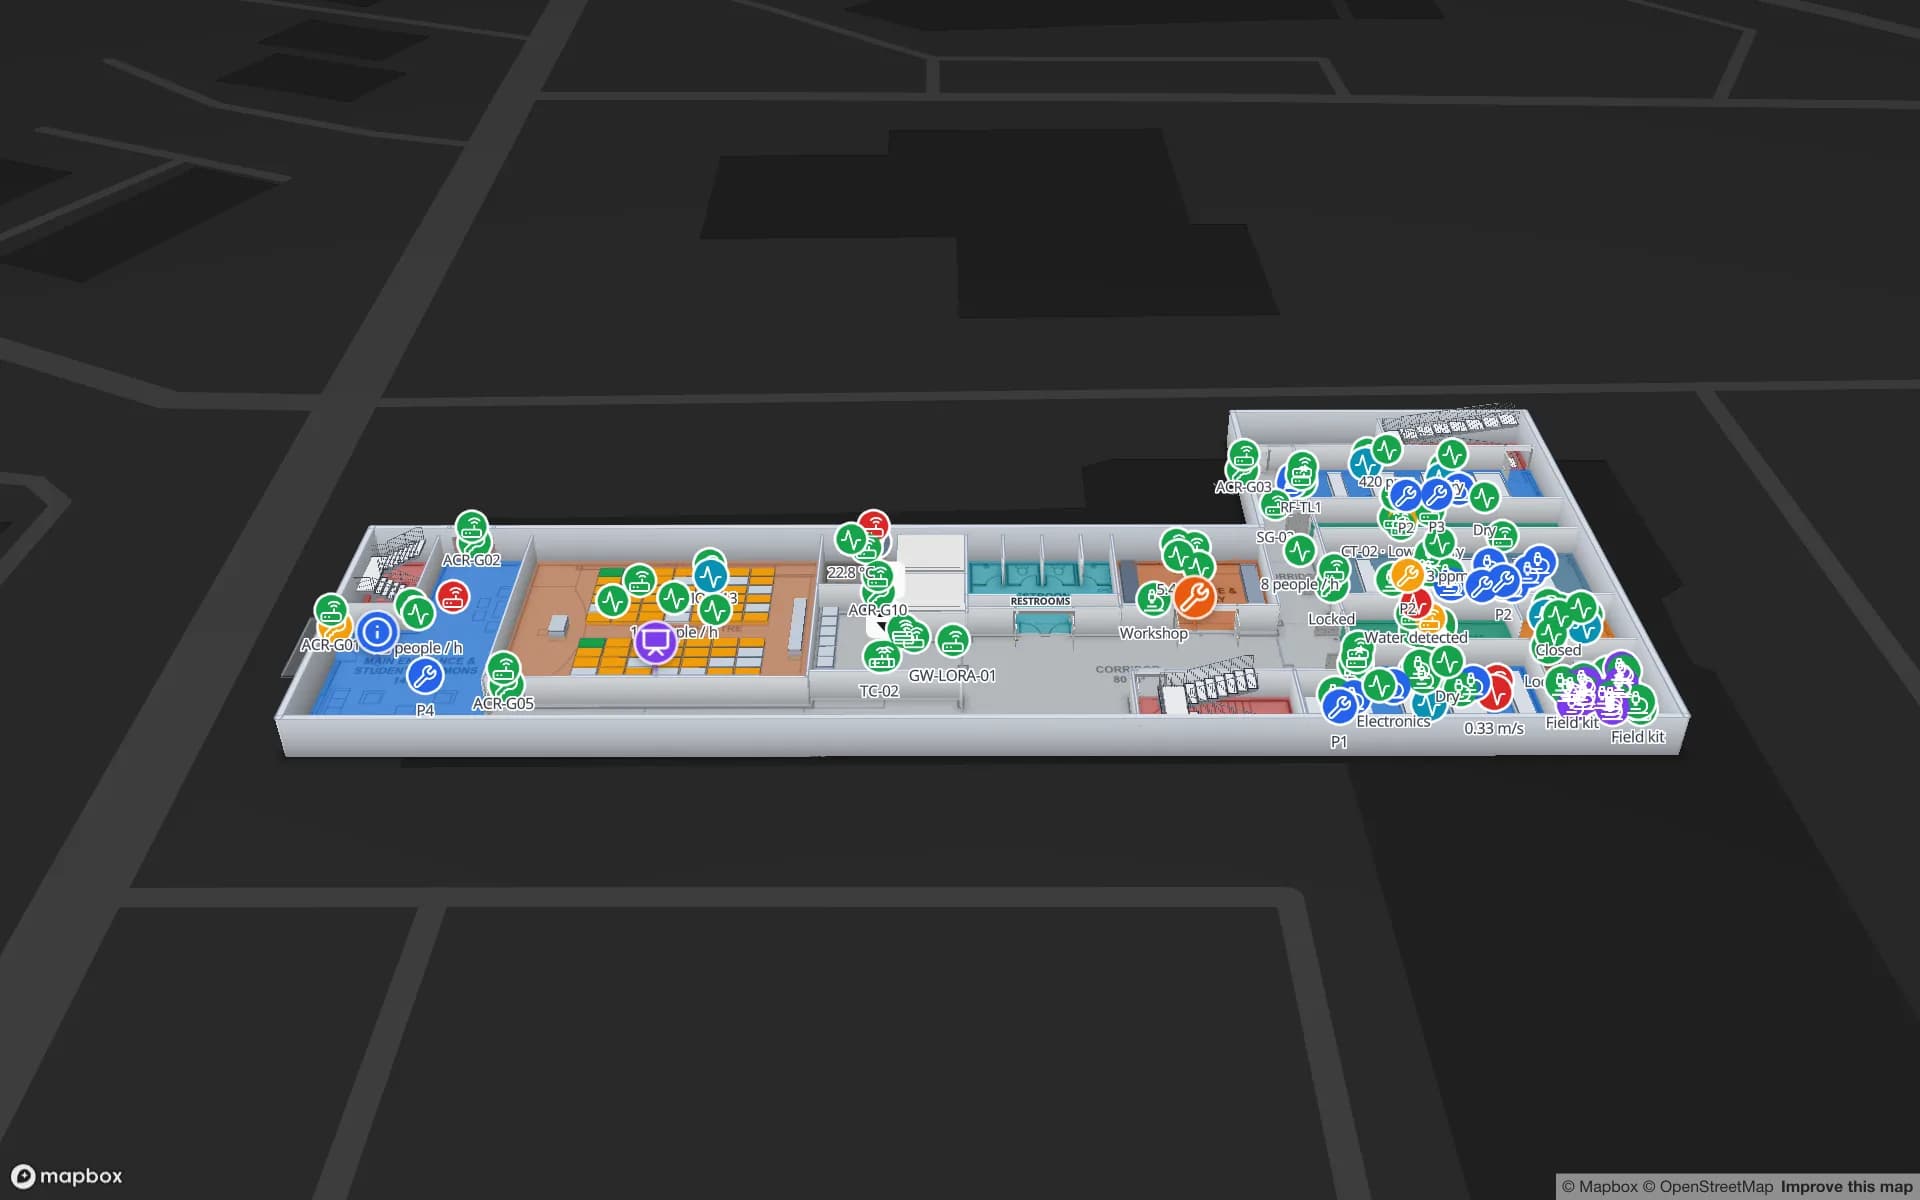
Westbrook University — Science Building, a university science building demo, in the Spatial Map 3D viewer with live device markers
Westbrook University — Science Building
Westbrook University science building, a demo campus: lab equipment bookings, lab environment readings and teaching spaces on two floors.
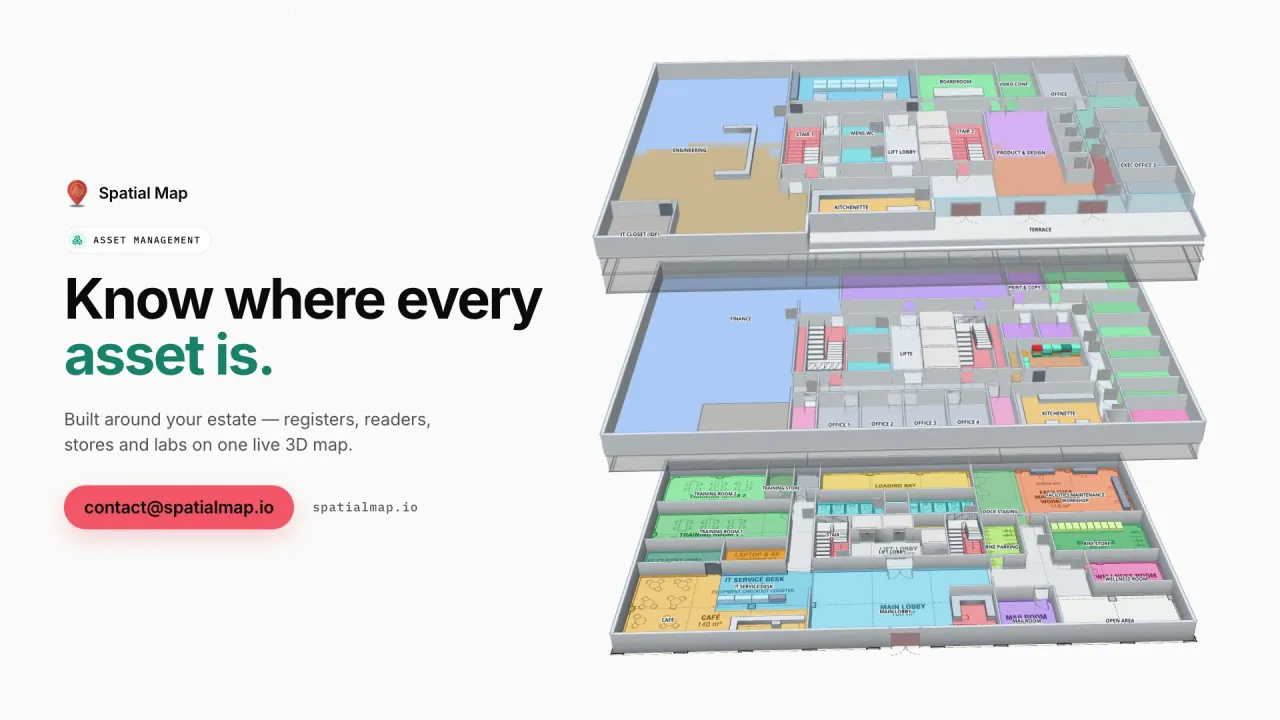
Floors in the Westbrook science-building demo
2
Tables of data behind the Westbrook demo
20
How often alert rules are checked, with alerts shown in the app
15 s
Free trial, up to 5 facilities, no card
7 days

Labs: the instrument is the asset

San Diego’s life-science industry is spread across research buildings, many of them multi-tenant, and industry profiles place the densest activity along the Torrey Pines and Sorrento Valley corridors. The counts of companies differ widely from one source and year to the next, so we do not quote one. What does not change is what a lab owns: instruments that cost more than the benches they sit on, shared between groups, moved for calibration, and booked by people who need to know where they are right now.

Spatial Map keeps the register as a table (tag ID, owner, home room, status) and draws each floor with its rooms as areas. A BLE tag with a gateway named after the room, or an RFID tag read at the equipment-store door, tells your system where each item is, and the map shows its last-seen room. A style rule colors anything overdue for return, and the History player replays where it has been. The Westbrook demo shows lab equipment bookings and lab environment readings on two floors, and real-time indoor asset tracking explains the pattern.


Cold storage and freezers: asset and environment on one map

Freezers and cold rooms are assets that also have a temperature. Draw each unit on the plan, link its sensor table, and the map colors it by its reading, with an in-app alert when a reading matches a rule for N minutes or a probe has not updated. The post on cold-storage temperature monitoring and heatmaps shows the idea.

Be clear about the limits. Spatial Map shows readings your sensors report and keeps a history you can replay and export; it is not a validated quality system and makes no claim about any regulatory requirement. Your quality team’s records stay the record.

Otay Mesa: assets that cross the border and come back

The General Services Administration describes the Otay Mesa land port as the busiest commercial port in California, nine miles east of San Ysidro, which is a non-commercial port, and says it processes nearly 1 million commercial trucks a year. A modernization finished in December 2023 raised the commercial inspection booths from 9 to 16. A new crossing, the SR 11/Otay Mesa East Port of Entry, is under way: SANDAG and Caltrans broke ground in August 2022, and it is planned with a four-lane toll road, a commercial vehicle enforcement facility and a matching crossing on the Mexican side.

For an asset-tracking team the border matters because assets travel with the goods. The San Diego Regional Economic Development Corporation notes that Baja California has five ports of entry and 960 manufacturing facilities, per the Tijuana economic development agency’s figures, that sites are about 30 minutes south of San Diego, and that the IMMEX program lets companies temporarily import goods that are transformed or repaired and then export them. Tooling, test fixtures, returnable containers and spare parts all move the same way. Tag them, read them at the shipping door on each side, and the map shows the last place each one was seen, in which building. Spatial Map does not make customs or IMMEX records: those stay in your systems.

Two buildings, one workspace, two languages on the floor

A San Diego plant and its Tijuana twin can be two facilities in one workspace, each with its own plan, with the same status colors and the same alert rules. Reports export to PDF, Excel, CSV or JSON, and a read-only share link lets a customer or an auditor see one floor without an account. The app has a Spanish interface alongside English, so a floor team on either side can use the map in its own language; data you type yourself can be in any language.

To start, upload the floor plan of one lab or one store as a PDF, DWG (AutoCAD R2004–R2018, placed as a picture) or image, align it at real scale, and let AI Map draft walls, doors and rooms for a person to review. AI Map is on paid plans and the trial, with a monthly limit. Then load the asset register as a CSV or Excel table, or post it through the write API.

Services for teams in San Diego

San Diego teams usually start in one of two places:

  • Labs and campuses start with asset tracking and the indoor maps, often before any tags are bought: an asset register by room is already useful.
  • Plants and warehouses near the border add inventory tracking for parts and finished goods, with RFID gates at the shipping door.
  • RTLS and UWB matters mainly where people and vehicles must be located continuously; a BlueIOT server connects directly and other engines through the write API.
  • Tags, gateways and readers can be sourced on request, quoted per project, with warranty from the manufacturer: see hardware and demo kits on request.
  • Asset back offices, handheld apps and ERP integrations are built as client projects, for example an asset management system. The product runs as cloud or on-premises.

Also served nearby

The same approach covers Chula Vista and Otay Mesa itself, Carlsbad and the North County business parks, and Escondido. Nothing needs to be installed on site: the map opens in a browser.

How Spatial Map does it

Building a San Diego asset map

  1. 01

    Load the asset register

    Upload a CSV or Excel list of instruments, tools and containers with tag IDs, owners and home rooms as a table.

  2. 02

    Draw the rooms

    Upload the plan of one lab or store, let AI Map draft it, and name rooms the way your readers and gateways name them.

  3. 03

    Tag and read

    BLE tags with room gateways, or RFID at the equipment-store and shipping doors, post last-seen rows.

  4. 04

    Add return and silence rules

    In-app alerts for items overdue for return, freezers outside a range and gateways that stopped reporting.

What San Diego teams track

Lab instruments and shared equipment

Last-seen room, booking and status on each floor.

Freezers and cold rooms

Units colored by live temperature, with a history to replay.

Tooling and returnable containers across the border

Items read at the shipping door on each side, with the last site they were seen.

Server rooms and IT equipment

Cabinets drawn row by row, with assets tied to the cabinet they sit in.

See it on real demo facilities

Fictional names, real floor plans, live sensors, RFID, BLE tags and gateways — open any of them in the browser.

All 13 demo facilities

Asset tracking in San Diego — questions we get

No. It has no link to port, customs or government systems and creates no customs or IMMEX records. It shows where your own tagged assets were last read, in which building, so it complements those systems rather than replacing them.

Yes. Each site is a facility with its own map, and facilities, reports and data can be grouped into named solutions inside one workspace. The app interface is available in English and Spanish; data you type can be in any language.

No. A booking calendar says who should have the instrument; the map says where it was last seen. Load the bookings as a table and the two show side by side.

Spatial Map keeps the readings your sensors report and lets you replay and export them, but it makes no compliance or validation claim. Your quality system remains the record.

No. Spatial Map is sold online and our team works with customers in the United States remotely, by video call and through the contact form. There are no local resellers or partners.

In US dollars, the same worldwide: a 7-day free trial for up to 5 facilities with no card, then Pro at $60 a month or $600 a year for up to 4 facilities. Tags and gateways, if you ask us to source them, are quoted per project and are not part of the subscription.

Map one San Diego lab floor this week.

Start the free trial and open the Westbrook demo, or send us the plan of a lab or plant and an export of your asset list through the contact form.