Miami · Airport perishables, PortMiami and the Doral warehouse district

Cold chain monitoring in Miami, from the airport cargo ramp to the Doral cold room

Spatial Map shows cold rooms, freezers, dock doors and pallets on a live 3D map, coloured by the temperature readings and door events your own sensors report. Cold chain monitoring in Miami is about speed and hand-offs: flowers, produce and pharmaceuticals arrive by air and sea from Latin America and the Caribbean, change hands several times in a few hours and must not sit in the warm. Every building becomes a map where a warm room or an open door stands out.

No credit card. Runs in the browser. Pro is $60/month for up to 4 facilities. Book a demo

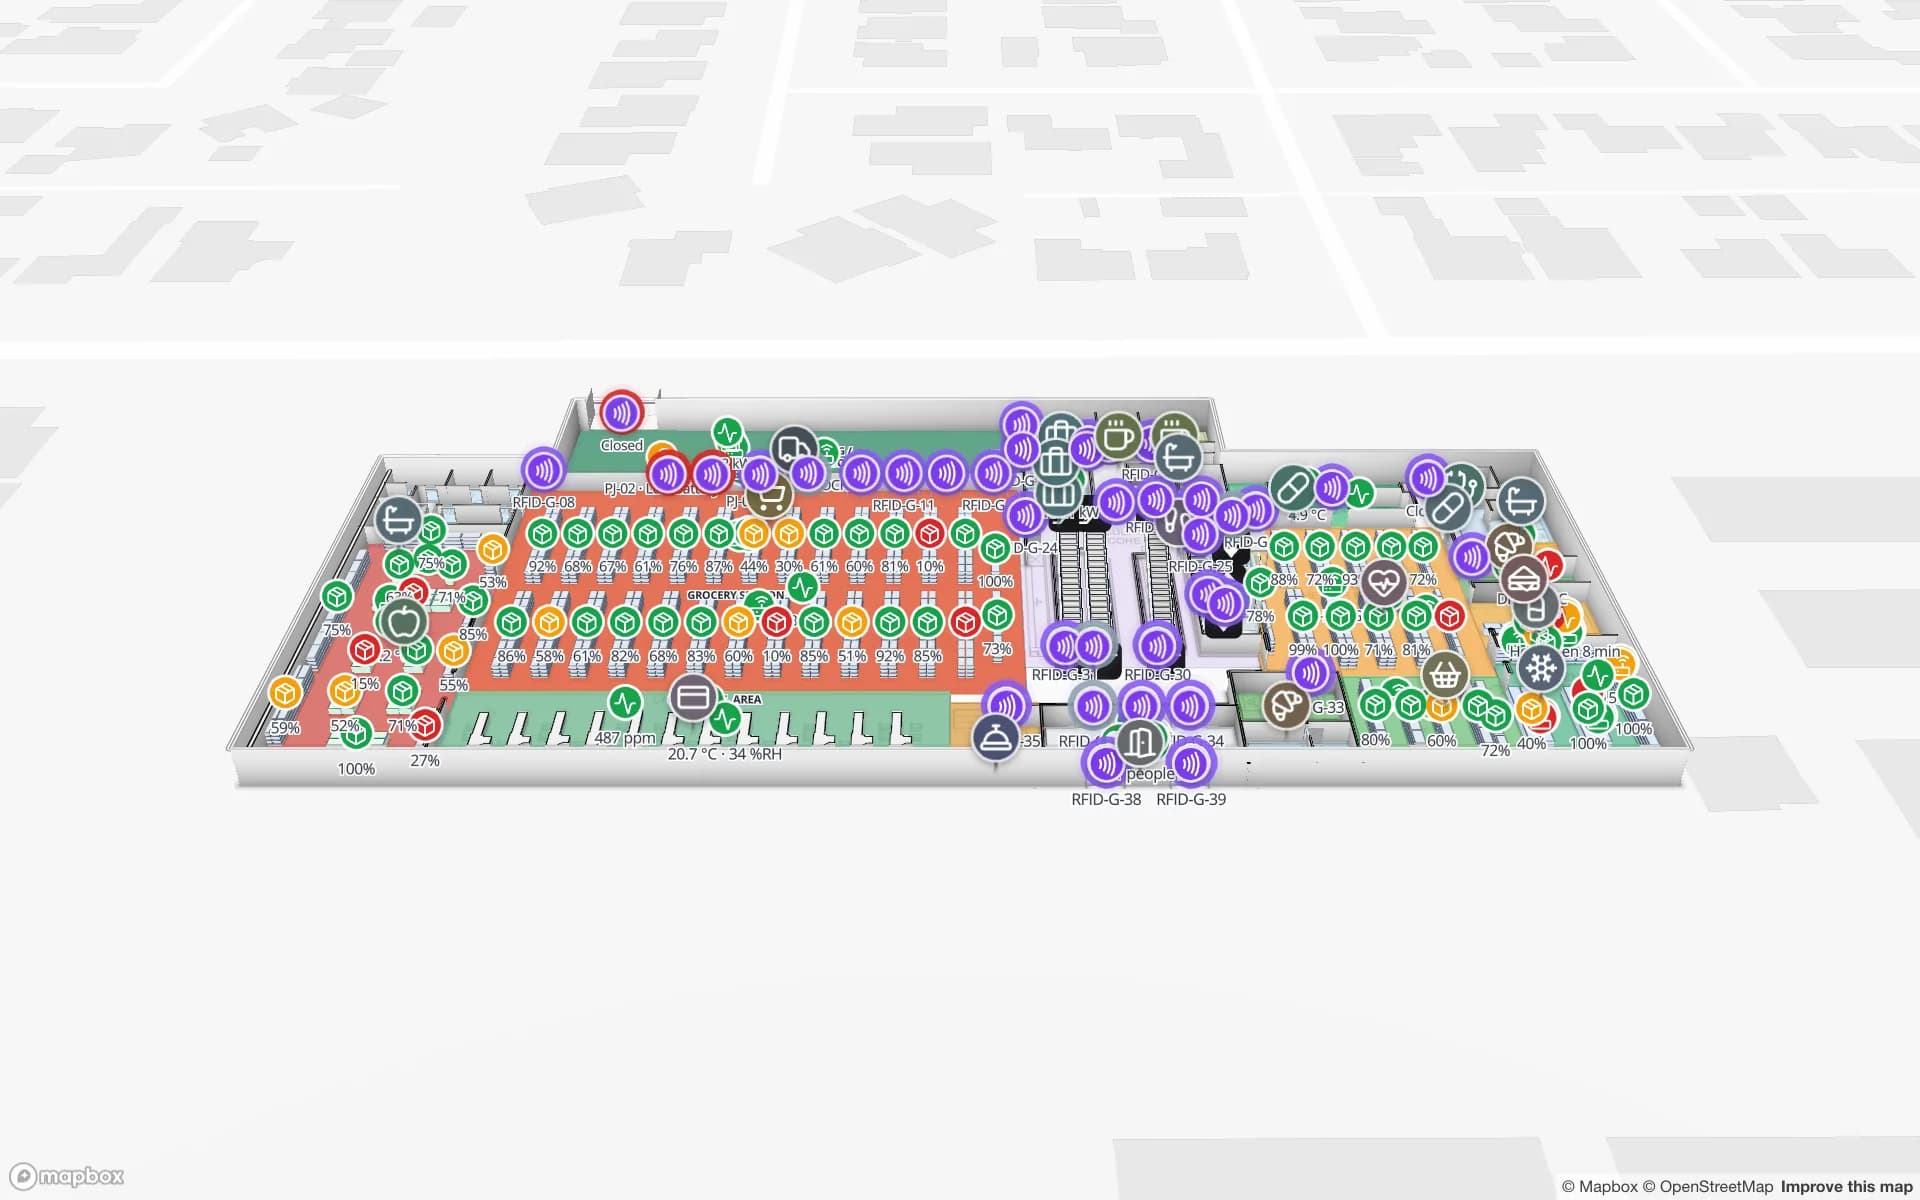
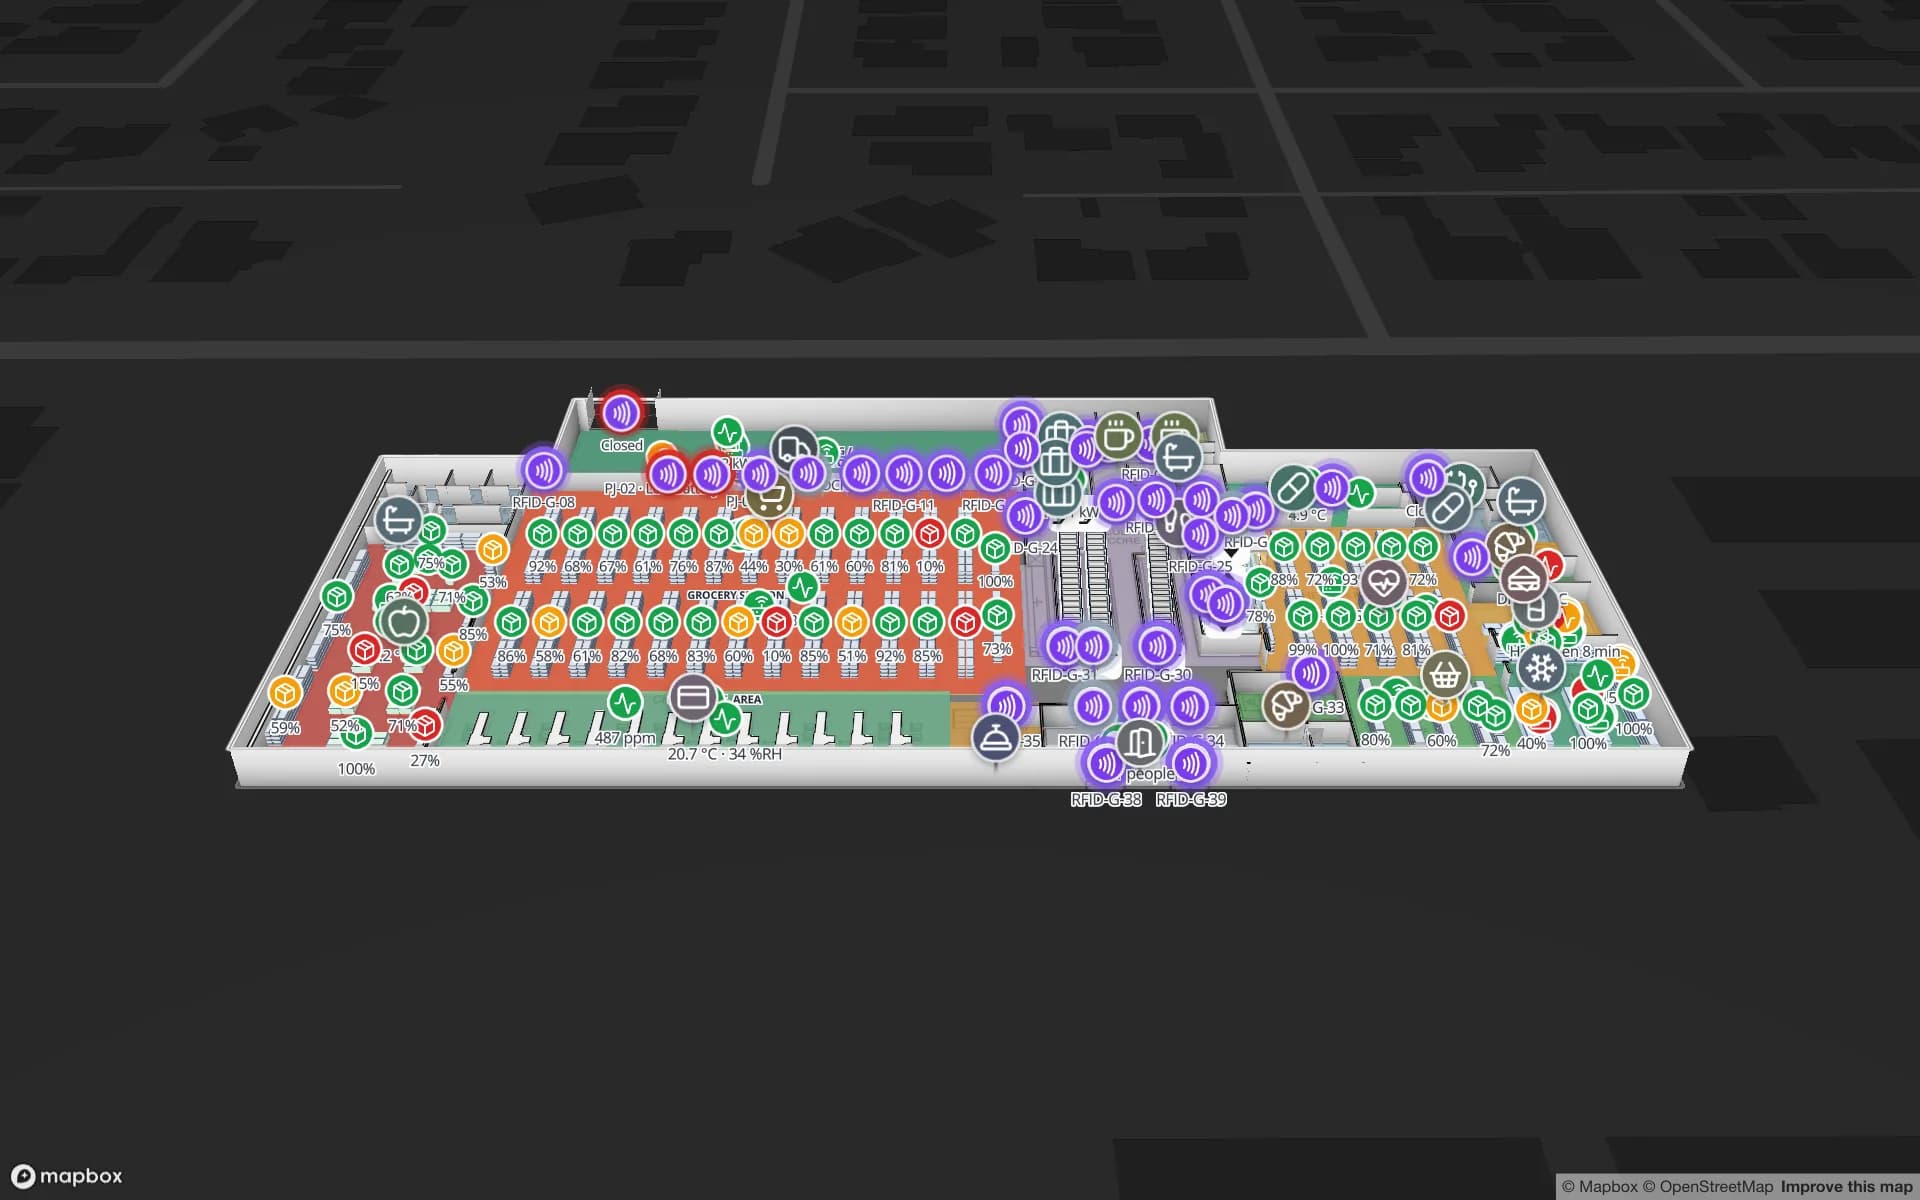
Polar Pharma — Cold Storage & QC Facility, a pharmaceutical cold store & qc lab demo, in the Spatial Map 3D viewer with live device markers
Polar Pharma — Cold Storage & QC Facility
Polar Pharma, a demo cold store: temperature zones and probes, cold-room doors, reefer docks, quarantine and a QC lab, with 1,140 rack locations.
Rack locations in the Polar Pharma cold-store demo
1,140
Floors in the Polar Pharma demo
2
How often alert rules are checked, with alerts shown in the app
15 s
Free trial, up to 5 facilities, no card
7 days

The airport that handles most of the nation’s cut flowers

In February 2026 U.S. Customs and Border Protection described Miami International Airport as the primary port of entry for commercial cut flowers, handling about 88 % of cut-flower imports (its releases give slightly different shares from year to year). The airport calls itself “America’s busiest airport for international freight” and said in 2017 that its cargo operations “continue to handle more perishable imports than all other U.S. airports combined”. A perishables facility with more than 25,000 pallet positions for chilled and frozen storage is estimated at $141 million and expected to open in 2028.

Everything downstream of that ramp is a race: pallets are broken down, inspected, re-built and trucked to cold rooms in the warehouses nearby. A map that colours each cold room by its latest temperature and each door by open or closed shows the whole picture at a glance; an alert rule such as “temperature above the limit for 10 minutes” raises an in-app alert. The Polar Pharma demo shows cold rooms, freezers and reefer docks on one map, and temperature monitoring explains how sensor feeds attach.


PortMiami: refrigerated space beside the rail ramp

PortMiami lists on-dock rail with 9,000 feet of track (3 × 3,000 ft), up to 1.5 million square feet of dry and refrigerated warehouse, distribution and transloading space co-located with the intermodal ramp, and direct highway access via tunnel. A reefer container is a cold chain with a plug: it stays cold only while it is powered, and the risky moments are the hand-offs, from ship to yard stack, to chassis, to dock.

Draw the reefer docks and yard slots, post the reefer readings and gate events from your own systems as rows, and the map shows which reefer is at which door and which one has been warm longest. Spatial Map does not read vessel, terminal or railroad systems; it begins at your gate. The Eastport demo shows yard slots and dock doors for the trailer side.

Doral: a district of small bays and many tenants

The City of Doral counts over 2,600 trade and logistics related companies in transportation, warehousing and wholesale trade, about a mile from the airport. In districts like that a cold chain is often a bay or two inside a shared building, run by a forwarder or importer with a handful of sensors and a clipboard.

Treat each bay as an area on a floor plan, name each sensor after the room it sits in, and a manager can open one map for the whole building instead of five app logins. Read-only share links can show one importer’s rooms to its customer without an account, with an expiry and a view cap. Hardware for the sensors and gateways is a separate decision: our team can source it on request, quoted per project, with manufacturer warranty and device support.

Storm season, power and silent sensors

Hurricane season runs from 1 June to 30 November, and the worst cold-chain day is often the one when power or connectivity fails. A sensor that stops reporting looks, on a chart, like a flat line. An alert rule set to “not updated for N minutes” turns that silence into an alert, and a heatmap of readings shows which side of a room warmed first; see warehouse sensor alert rules and cold storage temperature monitoring with a heatmap.

Be clear about the limits. Alerts are shown in the app only, with no email, SMS or push, so someone has to be looking at it; for an overnight excursion keep your sensor vendor’s own alarm. Spatial Map is not a certified data logger and makes no compliance claim: your quality records stay the record.

Services for teams in Miami

Miami cold-chain teams tend to start with sensors, then add stock:

Also served nearby

The same page covers Medley, Hialeah, Miami Gardens and the airport-adjacent areas of Miami-Dade, and Broward County to the north.

How Spatial Map does it

From a cold room to a Miami alert

  1. 01

    Pick one cold room

    The room or reefer dock where a warm hour costs a full pallet.

  2. 02

    Draw rooms and doors

    Upload the plan, draw each room as an area and name sensors and doors after it.

  3. 03

    Post readings

    Sensor gateways or your platform post temperature and door rows through the table write API, or Spatial Map polls your endpoint.

  4. 04

    Add excursion and silence rules

    In-app alerts for temperature above a limit and for sensors that stopped reporting.

What Miami teams monitor

Perishables cold rooms

Rooms coloured by live temperature, with open doors flagged.

Pharma and healthcare imports

Controlled-ambient and cold zones, with held and quarantined pallets in place.

Reefer docks and yard slots

Trailers and containers at their docks, with gate events.

Warehouse stock by rack

Pallets by rack location beside the temperature picture.

See it on real demo facilities

Fictional names, real floor plans, live sensors, RFID, BLE tags and gateways — open any of them in the browser.

All 13 demo facilities

Cold chain monitoring in Miami — questions we get

No. It does not measure anything. Your sensors and gateways measure, and their readings arrive as rows in a table; Spatial Map colours rooms by the latest value and keeps a history you can replay and export. It makes no compliance claim, and your quality system stays the record.

Not directly. If your platform exposes a REST endpoint or can post rows, its readings can be shown on the map; there is no built-in link to airport or port systems, and the only built-in device driver is for BlueIOT RTLS.

Alerts appear inside the app only, as a bell, toast and Alerts page, and can be directed at roles or members. There is no email, SMS or push, so keep your sensor vendor’s own alarm for the night shift.

Yes. A read-only share link limits the layers and floors, can lock a floor and expires, and viewers do not need an account.

No. Spatial Map is sold online and our team works with customers in the United States remotely, by video call and through the contact form. There are no local resellers or partners.

In US dollars, the same worldwide: a 7-day free trial for up to 5 facilities with no card, then Pro at $60 a month or $600 a year for up to 4 facilities. Sensors and gateways, if you ask us to source them, are quoted per project.

Put one Miami cold room on the map this week.

Start the free trial and open the Polar Pharma demo, or send us a floor plan and a sample of your sensor readings through the contact form.