Portland, Oregon · Port terminals, Rivergate, Swan Island, apparel and outdoor

Inventory tracking in Portland, Oregon, from the port’s industrial parks to the apparel stockroom

Spatial Map shows where stock is inside each building on a live 3D map, colored by the bin counts and RFID reads your WMS and readers already produce. Inventory tracking in Portland, Oregon splits into two worlds that sit a few miles apart: bulky port-side and distribution stock in the large industrial parks along the Columbia and Willamette, and small, many-variant apparel and gear stock where every size and color is its own line. One workspace can hold both kinds of building.

No credit card. Runs in the browser. Pro is $60/month for up to 4 facilities. Book a demo

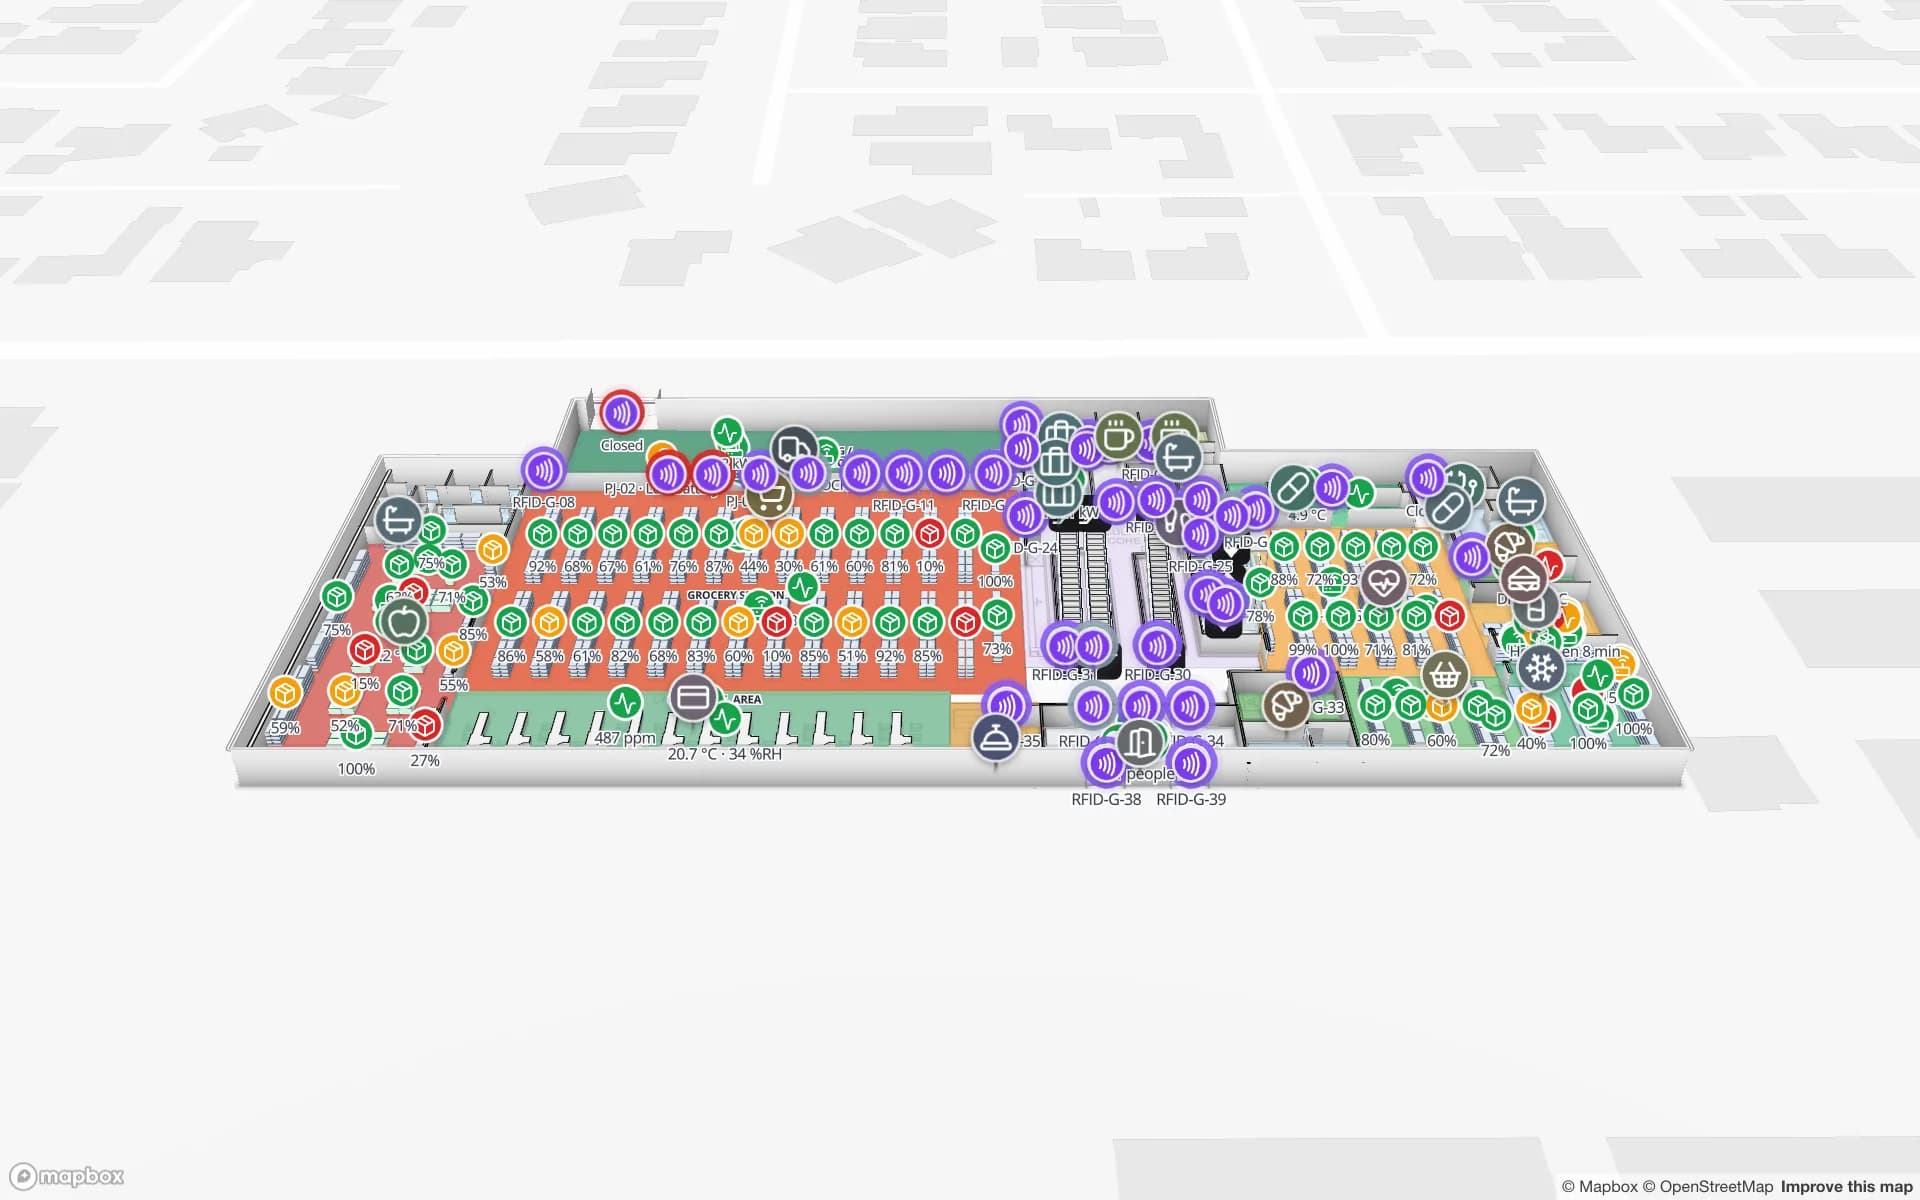
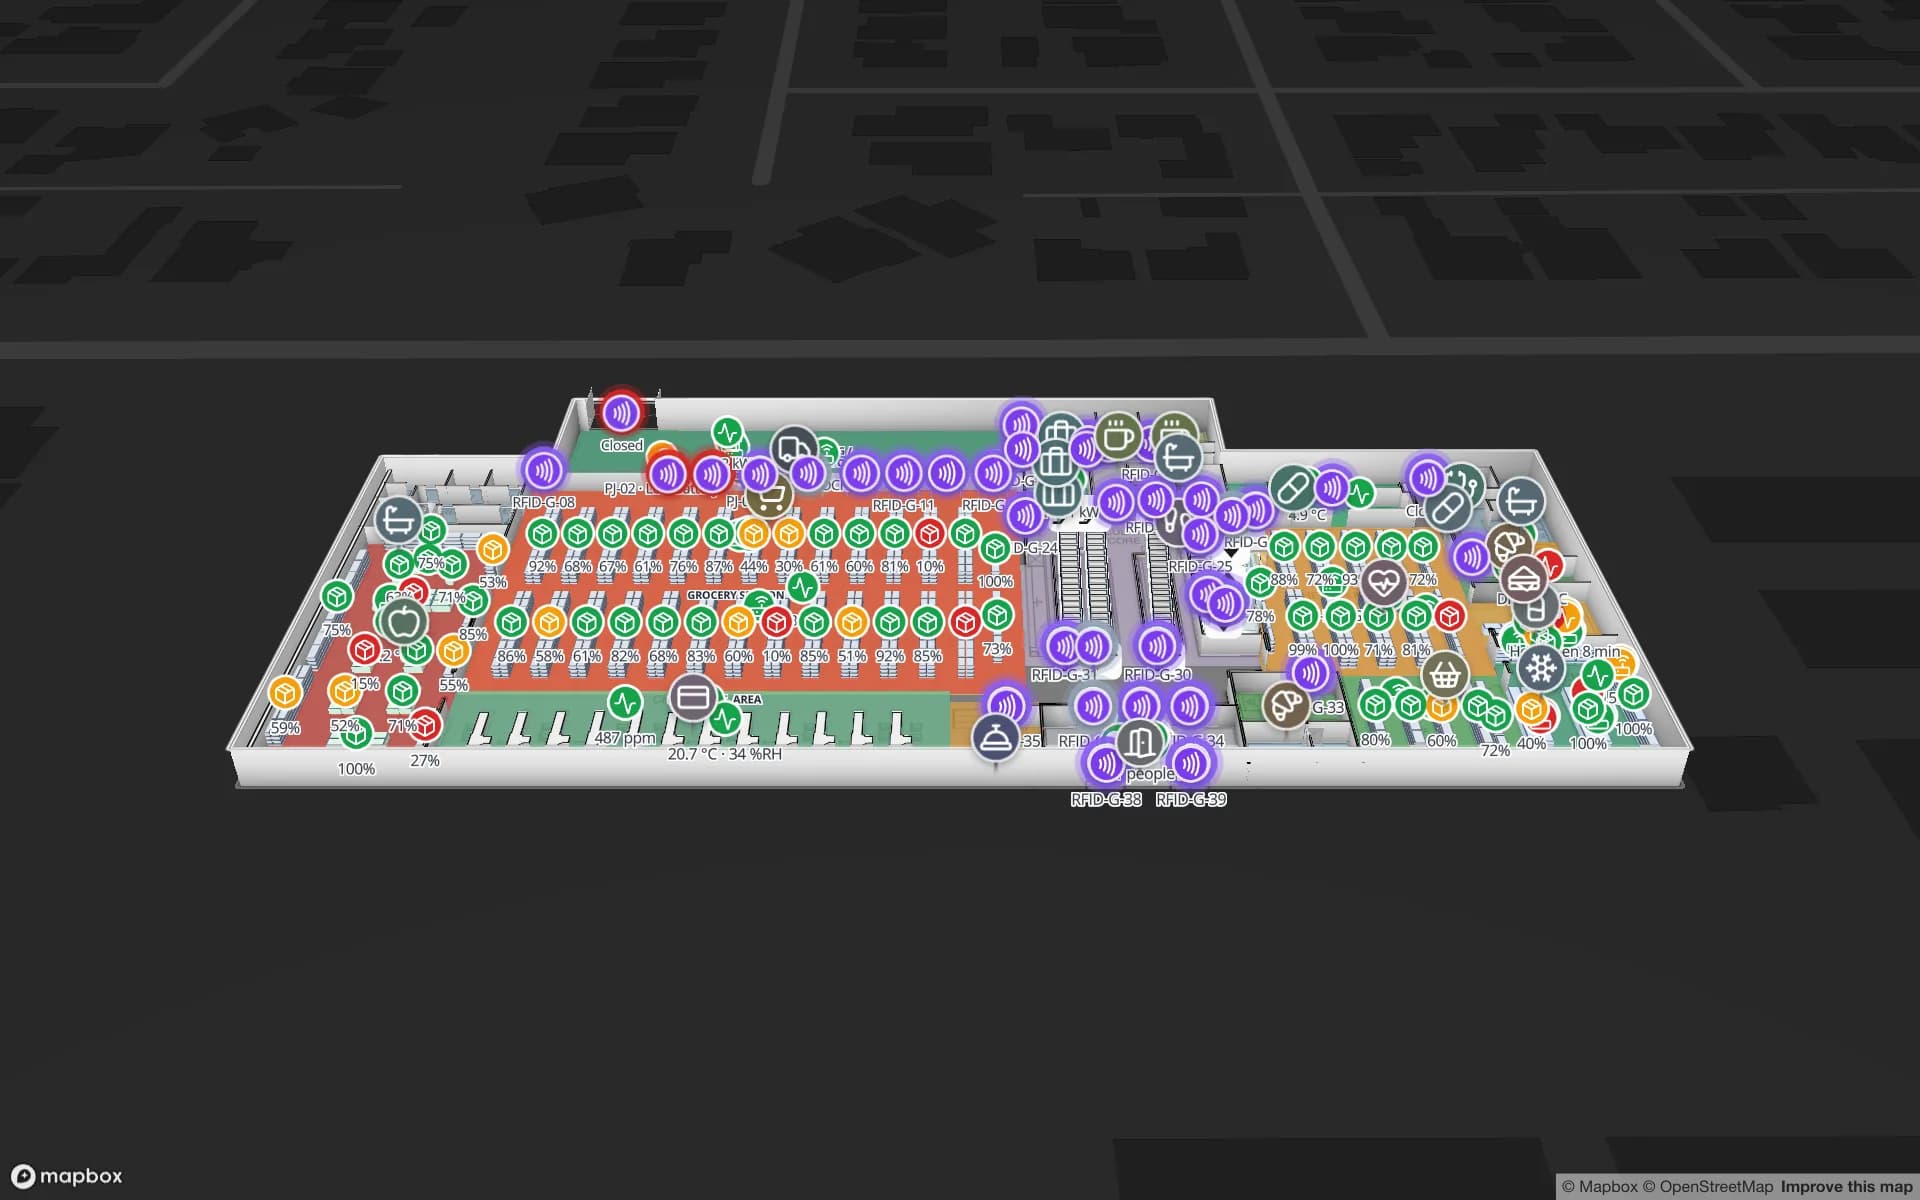
Retail Mart Store, a three-floor retail store demo, in the Spatial Map 3D viewer with live device markers
Retail Mart Store
Retail Mart, a demo three-floor store: 85 RFID readers at the doors, escalators and lifts, with shelf stock and fridge temperatures.
RFID readers in the Retail Mart demo store
85
Shelving runs mapped in the Retail Mart demo
167
How often alert rules are checked, with alerts shown in the app
15 s
Free trial, up to 5 facilities, no card
7 days

The port: terminals, a railyard and a short list of firsts

The Port of Portland’s marine page lists three marine terminals, 4, 5 and 6. Terminal 6 is described as a 419-acre facility with an on-dock railyard that can handle autos, containers and breakbulk, and as having an eight-track intermodal railyard. The Port calls the Oregon Container Terminal “Oregon’s only active international container port” and says Portland is a top auto gateway on the West Coast for both imports and exports.

What that means inside a warehouse is mixed freight: boxed goods stripped from containers, palletized import stock waiting for transport, and project cargo that does not fit a rack at all. The useful map for those buildings shows zones and lanes before racks, with each pallet’s status (received, on hold, released) colored in place. Spatial Map does not connect to the port or to a terminal operator; it shows what your own reads and WMS rows say once the goods are in your building.


Rivergate, Swan Island and the parks in between

The Port’s own industrial-property page gives the scale of the parks around it. Rivergate is 2,800 acres, the city’s largest industrial park, with more than 14 million square feet of buildings, rail access and easy reach of freeways and marine terminals, nine miles northwest of downtown. Swan Island is 430 acres close to downtown with approximately 170 businesses. Portland International Center is 458 acres beside I-205 and Airport Way, and the Troutdale Reynolds Industrial Park is 700 acres.

Those parks hold the mid-size distribution buildings where inventory tracking pays first: several clients’ stock in one shed, cross-docked loads, and returns. Draw the building, tint each rack by stock status from a bin-inventory export, and share a read-only link with each client so they see only their zone; see stock by bin on a rack grid and turning a CSV into a live rack map. Alerts are shown in the app only, so a rule such as “count below threshold” raises a bell and a toast.

Apparel and gear: the stockroom where every size is a line

Prosper Portland, the city’s development agency, defines an athletic and outdoor cluster of footwear, apparel, gear and bicycle companies and their suppliers. Employment figures for it differ by year and definition, so we quote none. For an inventory team the pattern is more important than the headcount: each style comes in many sizes and colors, seasons change the range every few months, and returns come back mixed.

Item-level RFID is the usual answer, and it can count a stockroom far faster than scanning each barcode; the post on how RFID stock counting works walks through it. Tag type matters for apparel and metal trims, so read UHF, HF and NFC for inventory and test in your own stockroom first. The Retail Mart demo shows 85 RFID readers and 167 shelving runs over three floors, with reads pulsing at the doors. Spatial Map shows the reads on the plan; your system of record keeps the counts.

Starting small: one stockroom, one shed

Pick a single area, upload its plan as a PDF, DWG (AutoCAD R2004–R2018, placed as a picture) or image, align it at real scale, and let AI Map draft walls, doors, racks and areas for a person to review; AI Map is on paid plans and the trial, with a monthly limit. Name locations the way your WMS does, load a bin-inventory export, and the racks color straight away.

Later, RFID middleware or your WMS posts rows through the table write API (HTTPS, bearer API key, bulk upsert, 60 requests per minute per key), or Spatial Map polls a REST endpoint. A history on each row and a History player replay what a shelf looked like last week, which helps when a count disagrees with the system.

Services for teams in Portland

Portland teams usually start in one of two places:

  • Distribution and port-side warehouses begin with inventory tracking by rack and zone, and add RFID at the dock doors when scan time grows.
  • Apparel, footwear and gear teams begin with item-level counts in the stockroom, then widen to the store floor and returns.
  • Yards and forklifts add asset tracking for trailers, returnable pallets and equipment.
  • If you have no readers or tags yet, our team can source RFID readers and tags on request, quoted per project, with warranty and device support from the manufacturer: see hardware and demo kits on request.
  • Where your IT team has no time, we build RFID handheld apps, ERP and WMS integrations and an RFID inventory system as client projects, and POS or booking systems for stores. The product runs as cloud or on-premises.

Also served nearby

The same approach covers Gresham and Troutdale to the east, Hillsboro and Beaverton to the west, Wilsonville to the south, and Vancouver across the Columbia in Washington. Nothing needs to be installed on site: the map opens in a browser.

How Spatial Map does it

From a stockroom plan to a live Portland map

  1. 01

    Pick one area

    A stockroom, a shed bay or a client zone where counts disagree most.

  2. 02

    Draw it and name locations

    Upload the plan, let AI Map draft the floor, then name racks and bins the way your WMS does.

  3. 03

    Color it from a spreadsheet

    A bin-inventory CSV first, then the table write API or a polled REST endpoint for WMS and RFID rows.

  4. 04

    Share and alert

    Read-only share links for clients, plus in-app alerts for low counts and quiet readers.

What Portland teams track

Apparel and gear stock

Item-level counts by department and shelf, with reads at the doors.

Multi-client distribution

Rack-level stock by client with a read-only link for each one.

Port-side cross-docking

Dock doors, yard slots and pallets staged for the right outbound load.

Forklifts and returnable pallets

Equipment and pallets with their last-seen area and a History player.

See it on real demo facilities

Fictional names, real floor plans, live sensors, RFID, BLE tags and gateways — open any of them in the browser.

All 13 demo facilities

Inventory tracking in Portland — questions we get

No. It has no link to port or terminal systems. It shows what happens inside your own building from your own WMS, RFID reads and sensors, so it complements the port-level systems rather than replacing them.

Often, but tag type, placement and packaging change results, especially near metal trims or in dense stacks. Test tags in your own stockroom before buying volume. Spatial Map does not make tags; it shows the reads your middleware posts.

Yes. A read-only share link lets you choose the layers and floors a client sees, set an expiry and a view cap, and revoke it at any time. For ongoing access you can add people with the Viewer role or a custom role.

It can show the same bins from two sources side by side and replay what a shelf looked like on an earlier day through the History player. Spatial Map does not write corrections back to your WMS or ERP.

No. Spatial Map is sold online and our team works with customers in the United States remotely, by video call and through the contact form. There are no local resellers or partners.

In US dollars, the same worldwide: a 7-day free trial for up to 5 facilities with no card, then Pro at $60 a month or $600 a year for up to 4 facilities. RFID hardware, if you ask us to source it, is quoted per project and is not part of the subscription.

Map one Portland stockroom or shed this week.

Start the free trial and open the Retail Mart and Crestline demos, or send us the plan of a stockroom or distribution center and a sample of your bin export through the contact form.