Chonburi · Laem Chabang, IEAT estates and automotive supply

RFID tracking in Chonburi, from the Ro-Ro dock to the line-side rack

Spatial Map puts RFID reads on a live 3D map of the building where they happen, so a tag at a dock door becomes a pallet in a lane, a rack at line side or a carton in a free-zone cage. RFID tracking in Chonburi is shaped by one fact of geography: the country’s biggest deep-sea port, its estates and the plants that feed an automotive supply chain are all within about 40 km of each other, and goods make that short hop several times before they leave. Your readers and middleware do the reading; Spatial Map shows each read in place.

No credit card. Runs in the browser. Pro is $60/month for up to 4 facilities. Book a demo

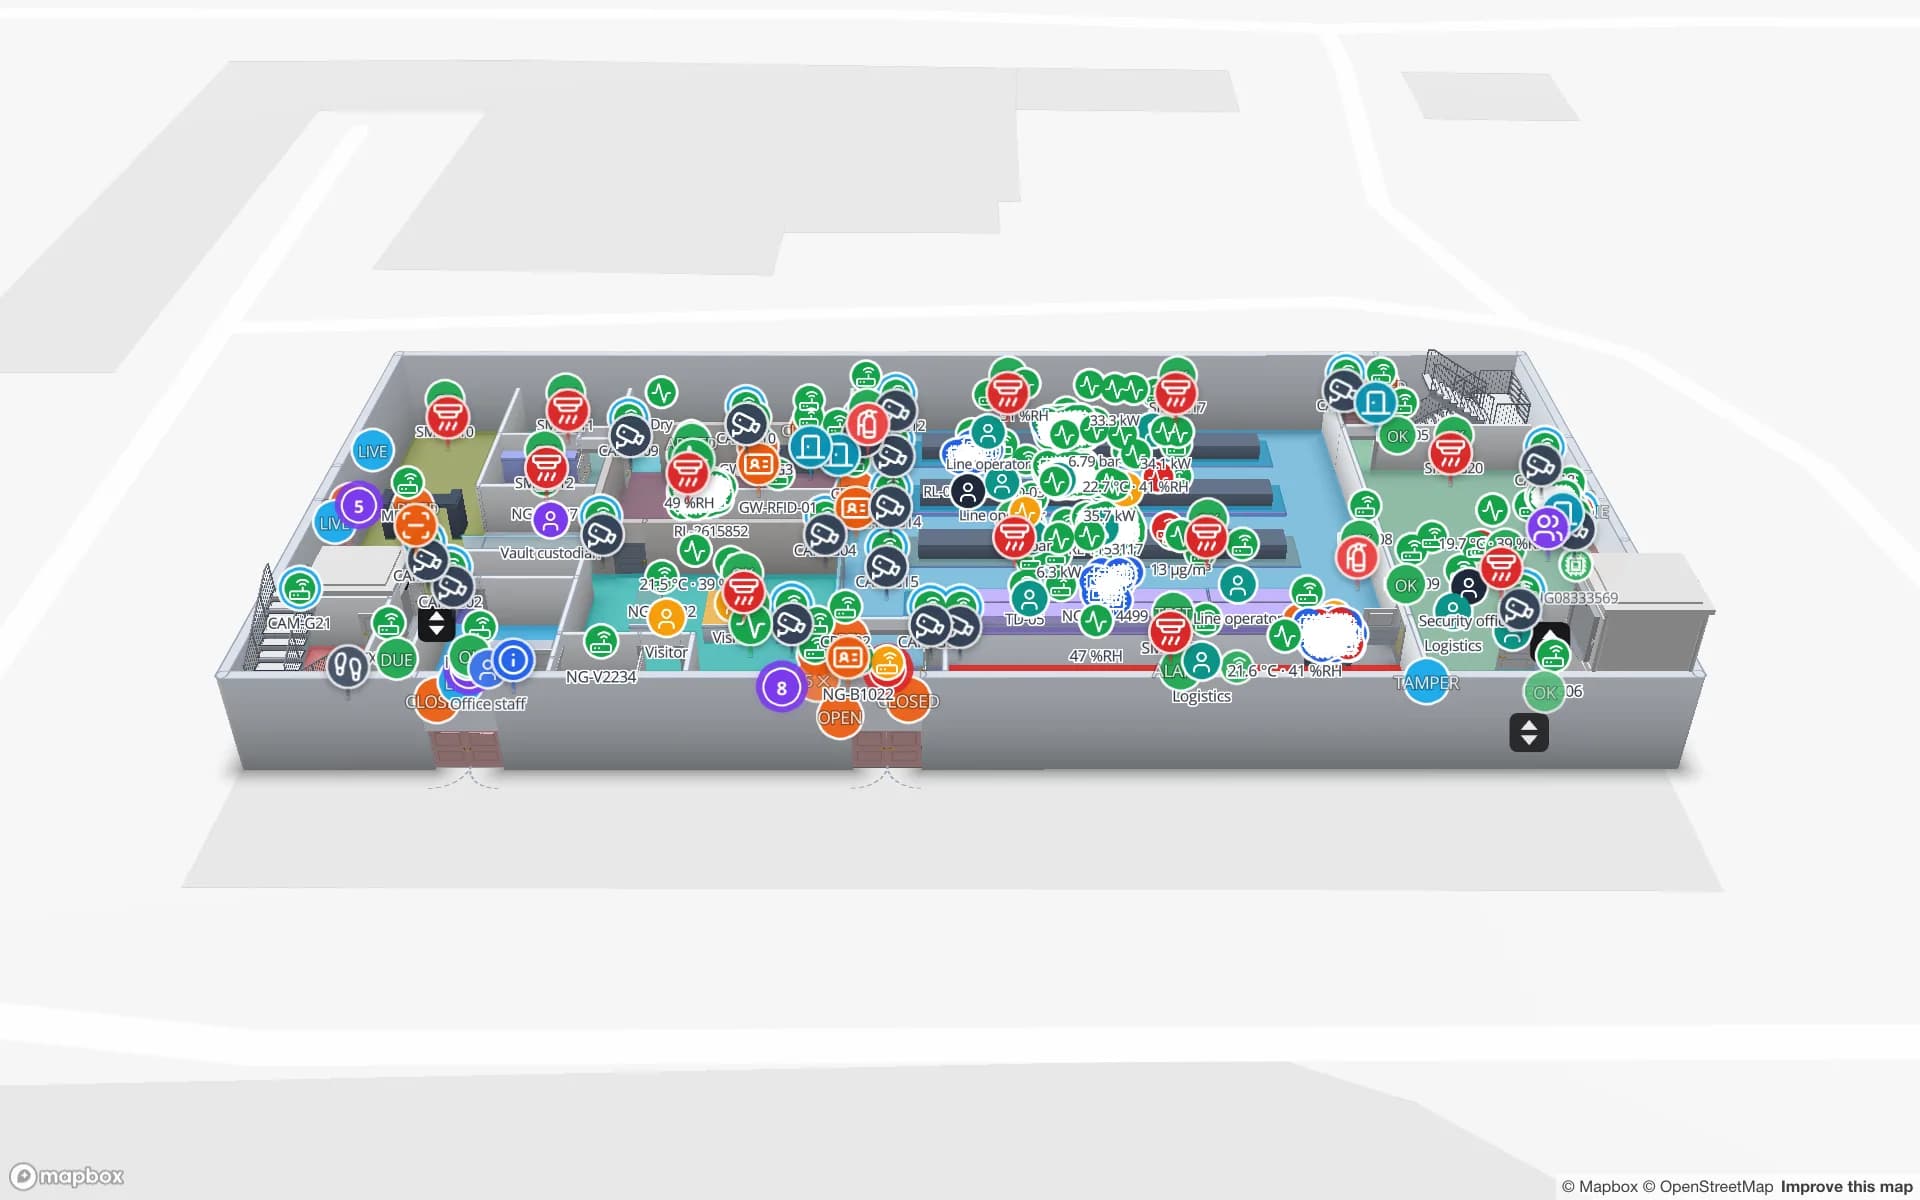
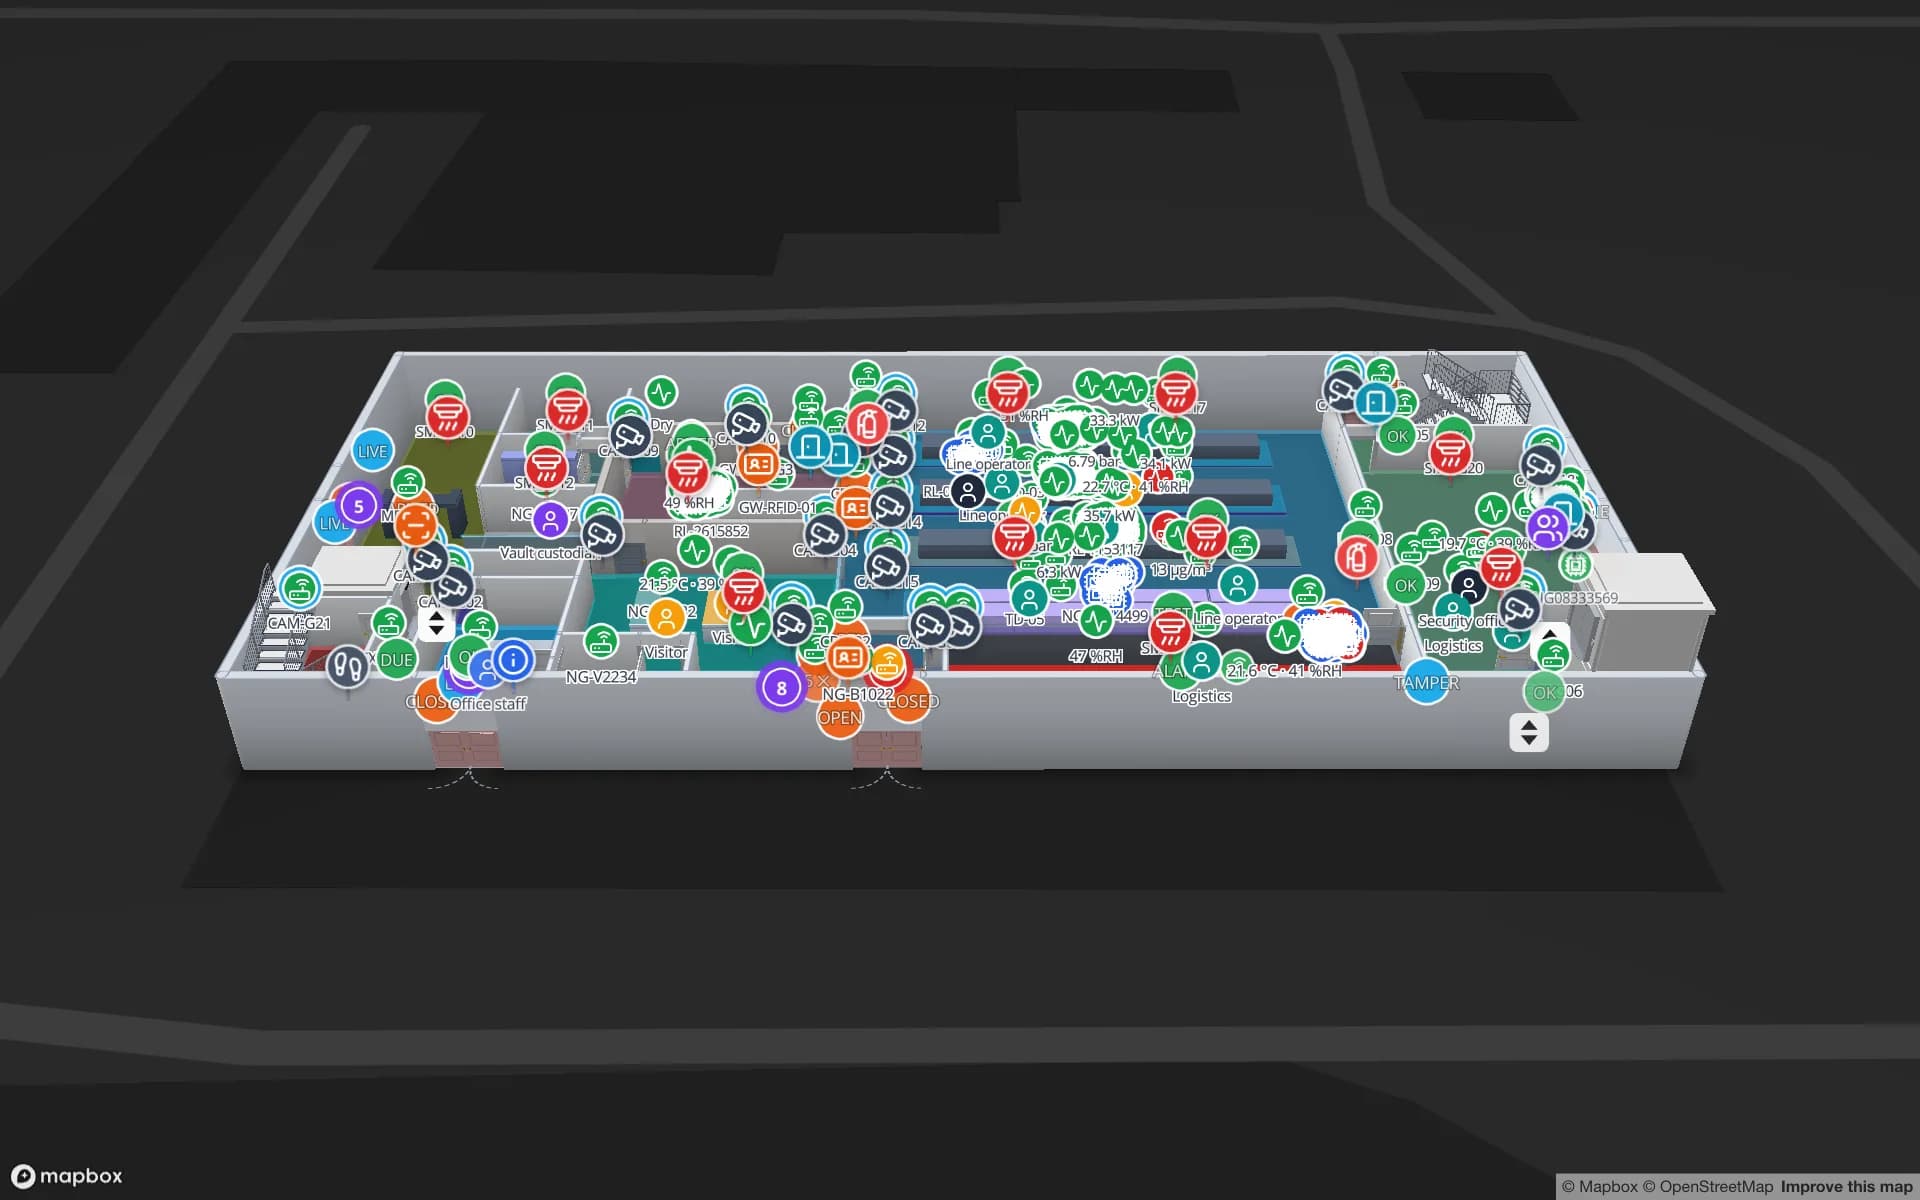
Summit Assembly Plant, a assembly plant demo, in the Spatial Map 3D viewer with live device markers
Summit Assembly Plant
Summit Assembly Plant, a demo plant: 3 assembly lines, 7 docks, 867 rack locations and 351 RFID work-in-progress carriers, with a held lot traced to the line it starves.
RFID work-in-progress carriers in the Summit plant demo
351
Dock doors in the Eastport Cross-Dock demo
50
RFID pallets moving through Eastport
1,180
Free trial, up to 5 facilities, no card
7 days

One port, six kinds of terminal

The Port Authority of Thailand’s figures, published on the Eastern Economic Corridor Office’s site, list 11 container terminals at Laem Chabang, 4 multi-purpose terminals, 2 car transport (Ro-Ro) terminals, one bulk cargo terminal and one cruise terminal, with a current total capacity of 11 million TEU. The Phase 3 plan adds a new double-track railway and a rail container transfer centre.

Most of those terminals have a building behind them: container freight stations, vehicle processing yards, bonded sheds. Inside such a building the question is not the port’s, it is yours: which pallet is in which lane, which carton went into which box, which trailer is waiting at which door. RFID portals at the dock doors answer it. The Eastport Cross-Dock demo shows 50 dock doors, 44 yard slots and 1,180 RFID pallets on one map, with gate lanes and weighbridges. Spatial Map does not connect to the port’s systems; it shows what your own reads say.


The free-zone estate, 1 km from the berths

The Industrial Estate Authority of Thailand (IEAT) lists the Laem Chabang Industrial Estate at 3,556 rai, of which 979 rai is an I-EA-T Free Zone, established in 1982 and 1 km from the deep sea port. Two further IEAT estates in Chonburi are listed at 40 km from the port: one established in 1989 at 15,567 rai, and one established in 2010 at 8,226 rai. A plant 1 km from the quay and a plant 40 km away have very different logistics, yet may ship the same product.

A free zone adds a boundary inside the map. Draw the zone gate, the cages and the inbound and outbound lanes as areas, read tagged cartons at the gate and the cage door, and a report shows counts by area for the shipping team. Spatial Map makes no customs determination; how goods in a free zone are treated stays with your broker and your authority. What the map gives you is the physical record of where each tagged unit was last read, with row history.

Automotive supply: the parts that wait

The EEC Office names five strategic industrial clusters, and Next-Generation Automotive is one of them. Behind each vehicle that reaches a Ro-Ro dock is a chain of suppliers who deliver sequenced parts, kits and returnable containers to line side, often on a milk run between estates.

The useful RFID reads sit at the supplier’s outbound dock, the car maker’s receiving dock and the line-side store, and between them lie the containers that wait. Tag kit trolleys and returnable racks (on-metal tags for steel ones) and the map shows where each last read, which zone holds the most empties and which is running short. An alert on the number of matching items is checked every 15 seconds and shown in the app with Show on map. The Summit Assembly demo shows lines, andon calls and 351 RFID work-in-progress carriers between stations; our post on fixed readers, handhelds and gates helps decide which read point suits which door.

Rail transfer and a bigger corridor

The EEC Office lists Laem Chabang Port Phase 3, U-Tapao Airport and Eastern Airport City, and High-Speed Rail Linking Three Airports among its key projects, and its port page describes a rail container transfer centre as part of Phase 3. These are plans; this page does not claim dates for any of them.

If rail does take a larger share of box moves, the buildings at the rail end will need what road yards already do: slots, turns and a count of what is staged for which train. Spatial Map draws yard slots, tracks and lanes the same way, and where a plant runs a BlueIOT RTLS server it connects from Integrations and can run in the cloud or through the sgv-edge agent on the plant’s network, so tractors and trolleys move live on the map. Other RTLS engines connect through the table write API.

Services for teams in Chonburi

Where Chonburi teams usually start depends on the building:

  • Port-side warehouses and freight stations usually begin with inventory tracking at the dock doors, because a lost pallet there costs a vessel cut-off.
  • Supplier plants tend to begin with asset tracking for returnable racks, kit trolleys, moulds and forklifts, then add RFID for stock.
  • RTLS and UWB matters mainly for big, busy plants and yards where vehicles and people must be located continuously; most buildings will not need it first.
  • If you have no readers or tags yet, our team can source RFID readers, antennas and tags on request, quoted per project, with warranty from the manufacturer: see hardware and demo kits on request.
  • Where your IT team is busy, we build Android RFID handheld apps, ERP and WMS integrations and other custom software as client projects. The product itself runs as cloud or on-premises.

Also served nearby

The same approach covers Si Racha, Bang Lamung and Pattaya, the estates inland towards Phanthong, and the other two EEC provinces, Rayong and Chachoengsao. Nothing needs to be installed at any of them: the map opens in a browser.

How Spatial Map does it

From the port gate to the line-side rack

  1. 01

    Pick one building

    A freight station, a free-zone cage or a supplier plant dock — wherever a missing container costs most.

  2. 02

    Map doors, zones and racks

    Upload the plan, let AI Map draft the floor, and name read points the way your middleware does.

  3. 03

    Connect reads and stock

    RFID middleware, the yard system and your ERP post rows through the write API, or Spatial Map polls a REST endpoint.

  4. 04

    Add door and silence rules

    In-app alerts for containers staged too long, empties running short and readers that stopped reporting.

What Chonburi teams track

Port-side freight stations

Dock doors, yard slots and pallets staged for the right box before cut-off.

Automotive supplier plants

Kit trolleys, returnable racks and WIP carriers between stations.

Free-zone cartons

Cartons read at the gate and the cage door, with counts by area.

Electronics component stores

High-value reels and trays read zone by zone, with a shrink report.

See it on real demo facilities

Fictional names, real floor plans, live sensors, RFID, BLE tags and gateways — open any of them in the browser.

All 13 demo facilities

RFID tracking in Chonburi — questions we get

No. It has no link to port community, terminal or customs systems. It shows what happens inside your own building, from your own RFID reads, WMS or ERP and sensors, so it complements the port-level systems rather than replacing them.

Yes. Draw the free-zone gate, cages and lanes as areas and read tagged units at each boundary. Spatial Map shows where each unit was last read and keeps the row history; it does not decide customs treatment, which stays with your broker and the authority.

Yes, from the reads your system already makes. Each read (rack, reader, time) is posted to a table, and Spatial Map shows each rack at its last read point, counts racks per zone and raises an in-app alert when a zone runs low. Positions come from your readers; Spatial Map does not compute them.

That depends on the hardware and how it is mounted, so ask the vendor for its operating range and test tags in your own shed. Spatial Map adds visibility: an in-app alert when a reader stops reporting, and sensor readings coloured on the plan.

Yes. Your developers can push rows to a table through the write API (HTTPS, bearer API key, bulk upsert, 60 requests per minute per key) or expose a REST endpoint that Spatial Map polls. If you would rather not, our team builds integrations as client projects.

No. Spatial Map is sold online and our team works with customers in Thailand remotely, by video call and through the contact form. There are no local resellers or partners.

In US dollars, the same worldwide: a 7-day free trial for up to 5 facilities with no card, then Pro at $60 a month or $600 a year for up to 4 facilities. RFID hardware, if you ask us to source it, is quoted per project and is not part of the subscription.

Map one Chonburi dock before the next vessel.

Start the free trial and open the Summit or Eastport demo, or send us the plan of a freight station, free-zone shed or supplier plant and a sample of your reads through the contact form.