Kathmandu · Valley warehouses, Balaju, Patan, Bhaktapur and air cargo

Inventory tracking in Kathmandu, from the truck to the bin

Spatial Map shows stock where it actually is: racks, bins and dock doors on a live 3D map of the building, coloured from your spreadsheet, stock software, scans and RFID reads. Inventory tracking in Kathmandu starts with a geography problem. Most of what the valley sells and makes comes in by road from the border depots or by air, goes into crowded buildings in a dense city, and has to be found again quickly. Each of those buildings can have its own map in one workspace.

No credit card. Runs in the browser. Pro is $60/month for up to 4 facilities. Book a demo

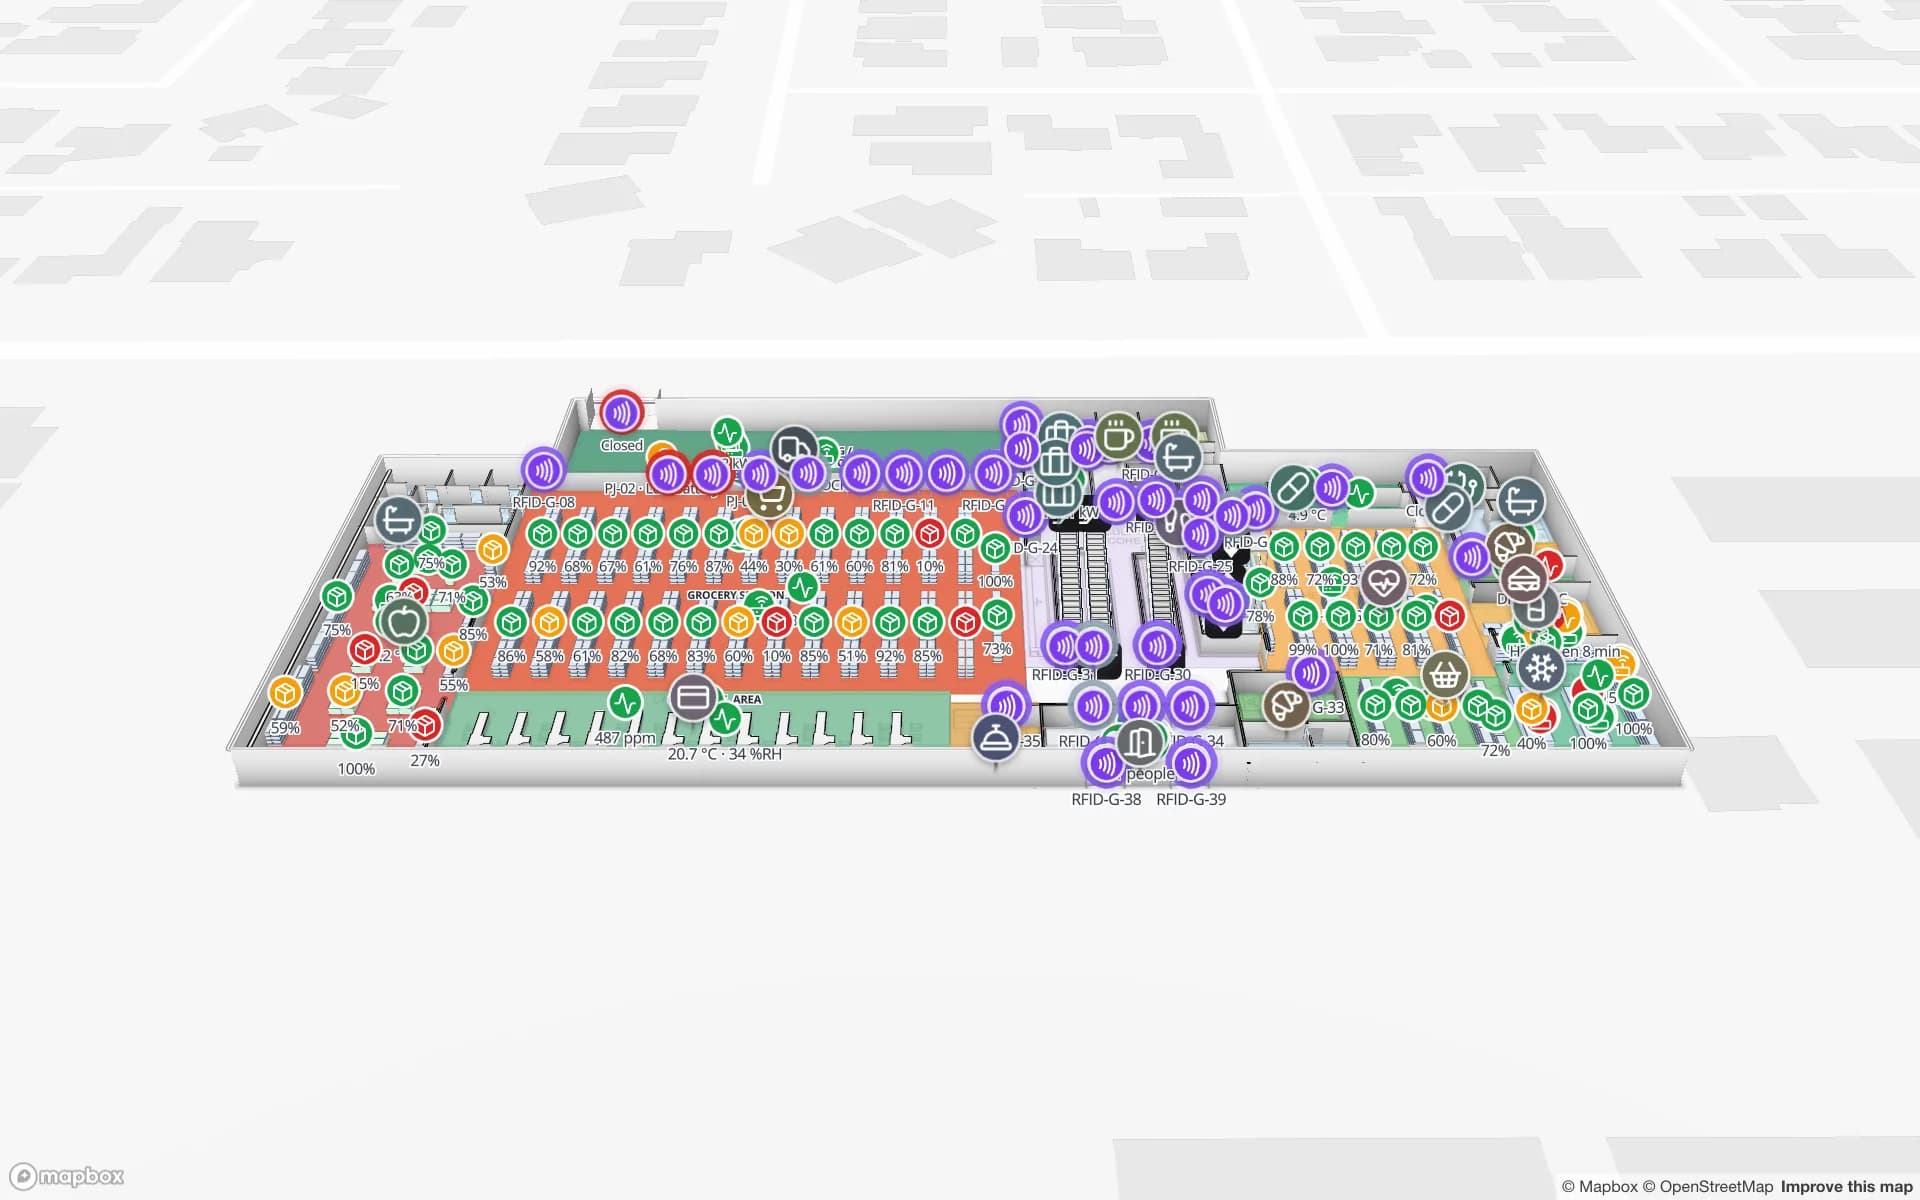
Crestline Fulfillment Center, a fulfillment center demo, in the Spatial Map 3D viewer with live device markers
Crestline Fulfillment Center
Crestline Fulfillment Center, a demo distribution site: 20 racks and 2,204 locations coloured from inventory, with packing stations, staging lanes and the trailer yard.
Rack locations in the Crestline inventory demo
2,204
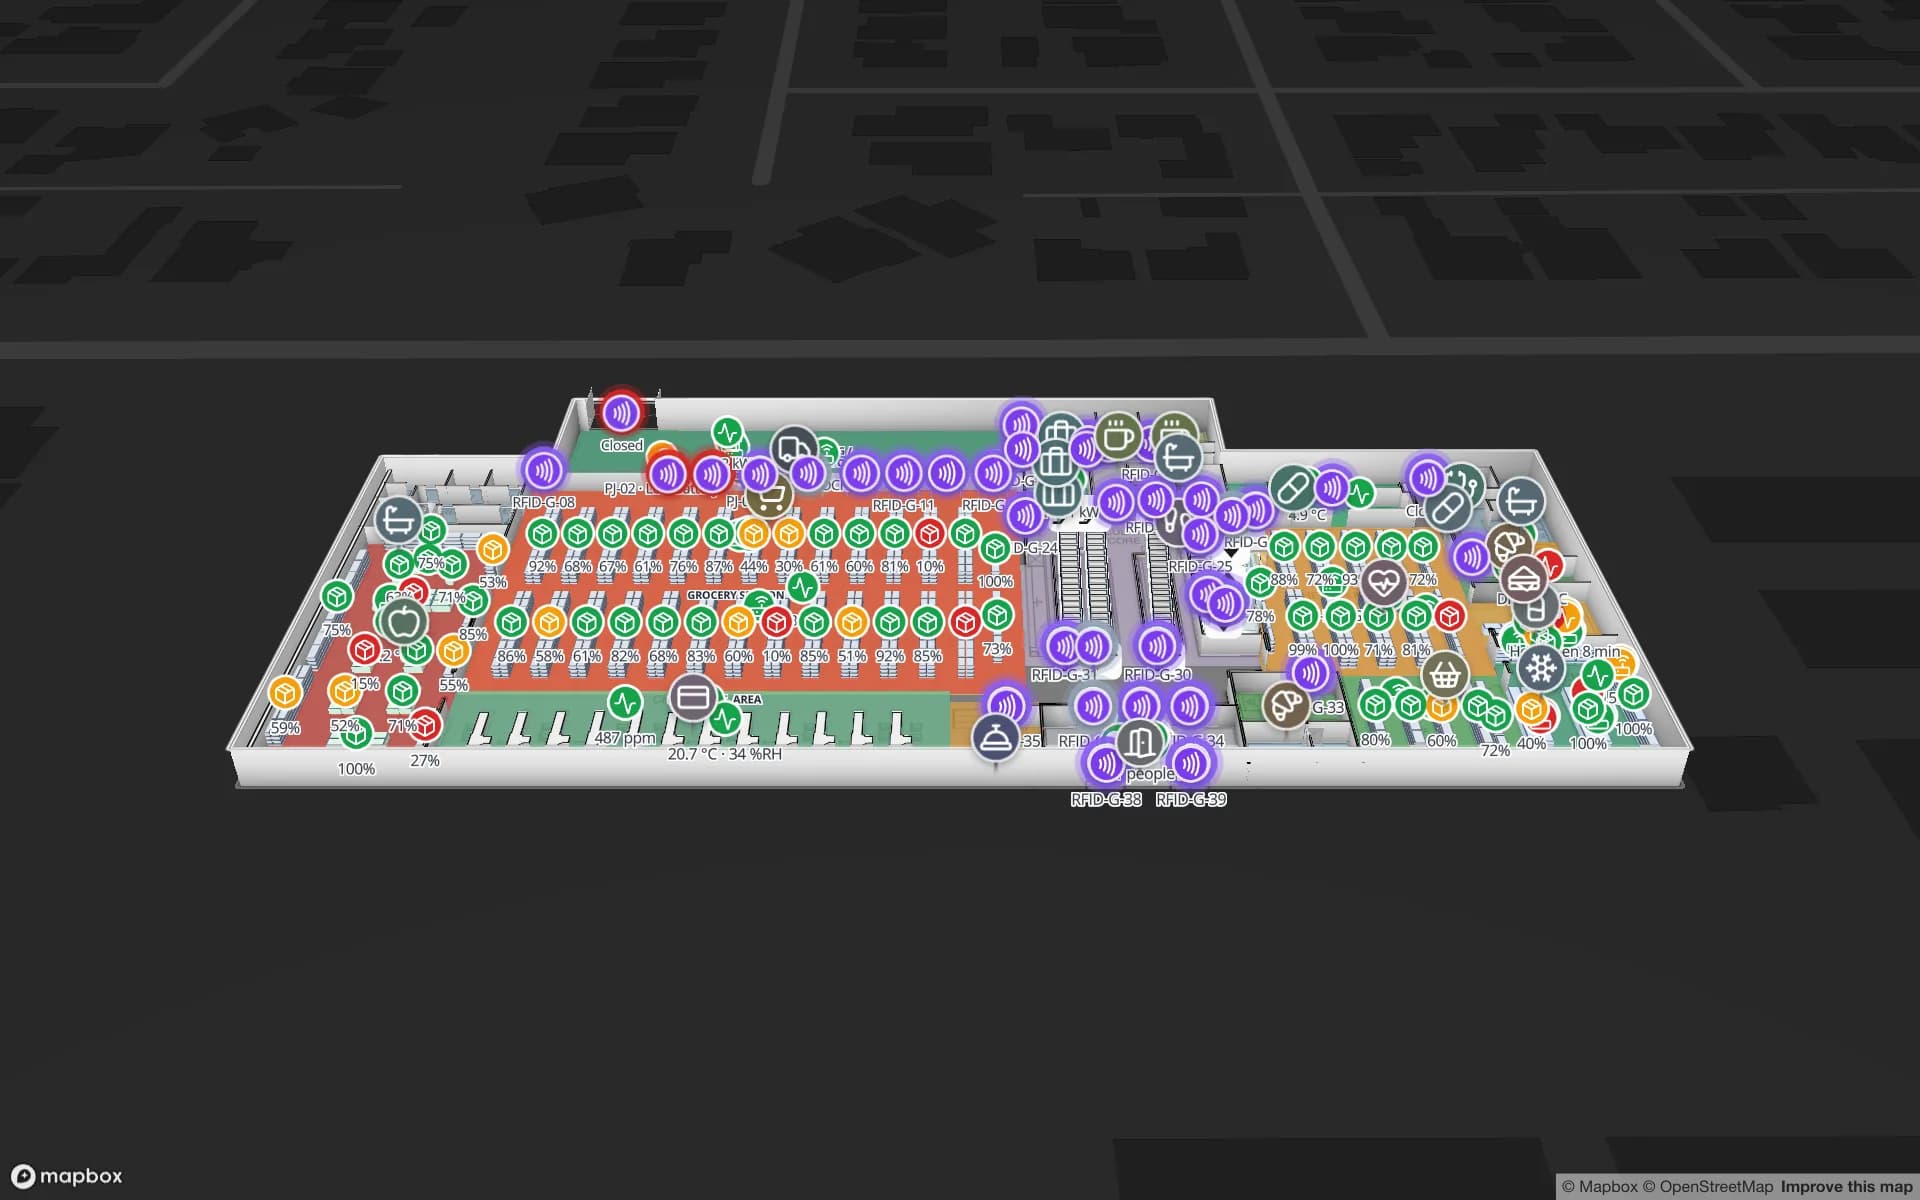
Floors in the Retail Mart demo store
3
How often alert rules are checked, with alerts shown in the app
15 s
Free trial, up to 5 facilities, no card
7 days

The valley is the second stop

Goods for Kathmandu mostly arrive by truck from border depots, above all Birgunj. An Asian Development Bank case study of the road corridor describes Birgunj as Nepal’s most important trade border, with its trade passing on to Kathmandu, and the Kathmandu Post calls the dry port there Nepal’s first and largest inland trade gateway. By the time a pallet reaches the valley it has been through customs, a depot and a long road, and the importer or distributor holds it in a warehouse that nobody else tracks for them. That warehouse is where inventory tracking pays back: which bin, how many, how old, and what is still on the truck.

The road matters too. In July 2017 the authorities barred trucks, mini-trucks and tippers from the Ring Road from 9 to 11 in the morning and from 4 to 7 in the evening to ease office-hour congestion, according to the Kathmandu Post, and a later version of the rule was reported as 8 am to 7 pm. Rules like this have been revised more than once, so check the current ones with the traffic police. For a warehouse, the lesson is that deliveries bunch into the hours allowed. A receiving plan that shows trucks waiting, pallets staged and doors in use is worth more than a stock list; the Eastport demo shows 50 dock doors and 44 yard slots on one map.


Balaju, Patan and Bhaktapur: old estates in a dense valley

Kathmandu’s three government-built industrial estates are old. Balaju dates from 1959, built with American assistance, and covers 670 ropanis; Patan was established in 1962 with Indian assistance on 293 ropanis; the Bhaktapur estate, begun as a small industrial area, followed in 1979 on 71.28 ropanis, the Kathmandu Post reported in 2022. Kantipur reported in March 2024 that the plan to move the valley’s industrial areas out of the city has stalled, so these estates keep running where they are.

Factories there are mid-sized, built over decades, often with a store on a different floor from the line it feeds, and the best drawing may be a scan, a photograph of a plan or nothing at all. Upload what exists, align it at real size and let AI Map draft walls, doors and racks for a person to review. Then load the stock as a table, one row per bin, and colour each rack by quantity or age. A plan photographed on a phone works; see digitising a paper floor plan. The Summit demo shows a plant with 867 raw-material and finished-goods locations on one map.

Air cargo at Tribhuvan and what comes after clearance

The Logistics Capacity Assessment published by the humanitarian logistics cluster describes the air cargo terminal at Tribhuvan International Airport as the only customs facility in the country where goods and parcels are processed for import and export by air, in a complex of 5,430 square metres split into equal import and export halves. The assessment is older, so check the current arrangements with the customs office. What matters for your own shed is what happens after release: air freight tends to be small, urgent and valuable, such as spares, electronics and samples, and it is exactly what disappears into a general store.

Give those items their own bins, scan them in at the door and count them by zone with a handheld. RFID stock counting explains the walk-through, and the post on how RFID stock counting works shows what a count by zone looks like. A count rule on the bin table raises an in-app alert when a high-value bin drops below its minimum.

Start with a spreadsheet, before any hardware

Most valley warehouses already have a stock list. Upload it as CSV or Excel with a bin code on each row, draw the racks, and the map is coloured from the list the same day; the guide to a CSV stock list on a rack map walks through it. Handheld counts come next, then RFID at the dock door once the bins are trusted. The Crestline demo shows 2,204 rack locations coloured by stock status, and the Retail Mart demo shows item-level stock across three floors for shops with more than one level.

Spatial Map does not replace your accounting or stock software. It shows what that software or your counts say, in place, so the person at the door can see which shelf to walk to.

Services for teams in Kathmandu

Where valley teams usually start:

  • Importers, distributors and wholesalers start with inventory tracking at the bin and the dock door.
  • Factories on the old estates add asset tracking for moulds, tools and forklifts once stock is in order.
  • RTLS and UWB matters mainly for large plants where vehicles and people must be located continuously; most buildings will not need it first.
  • If you have no handhelds or readers yet, our team can source them on request, quoted per project, with warranty and device support from the manufacturer: see RFID readers and tags on request.
  • Teams without in-house IT can have an RFID inventory system, Android handheld apps and ERP links built as client projects. The product runs as cloud or on-premises.

Also served nearby

The same page covers Lalitpur, Bhaktapur, Kirtipur and Banepa, and the industrial areas on the roads out of the valley. Nothing needs to be installed at any of them: the map opens in a browser.

How Spatial Map does it

From a stock list to a live rack map

  1. 01

    Pick one warehouse

    The importer’s store, a distributor’s godown or a factory stores room, wherever finding things costs most.

  2. 02

    Map racks and doors

    Upload the plan, scan or photographed sketch, draw racks with their locations, and name doors the way your drivers do.

  3. 03

    Load the stock

    One row per bin from CSV or Excel, then handheld counts; your own software can post rows through the write API.

  4. 04

    Add minimum and age rules

    In-app alerts for bins below their minimum and stock that has not moved for days.

What Kathmandu teams track

Importers’ valley warehouses

Pallets staged by consignment, bins by product, receiving doors in use.

Distribution and wholesale stock

Rack-level stock coloured by status, built from a spreadsheet.

Factory stores on the estates

Raw material, work in progress and finished goods by location.

Multi-floor shops

Item-level stock by shelf across floors.

See it on real demo facilities

Fictional names, real floor plans, live sensors, RFID, BLE tags and gateways — open any of them in the browser.

All 13 demo facilities

Inventory tracking in Kathmandu: questions we get

Yes. Floors, stairs and lifts are drawn per floor, so a store on an upper level is its own floor on the map. If there is no drawing, measure the outer walls and main columns, sketch the rooms and racks, photograph the sketch and upload it at real size. AI Map can draft from the picture and you correct what it gets wrong.

Yes. Give the air-freight items their own bins or a zone and a status column in the table, and colour the map by that column. Spatial Map does not connect to the customs office or the cargo terminal; it shows what your own scans and stock records say after release.

It affects how you use the map more than how you build it. Draw the dock doors and yard slots, post truck arrivals and pallet counts as rows, and an alert rule on the staging table can flag more pallets waiting than the plan allows. Check the current traffic rules with the authorities.

Yes, and it is the recommended way. A CSV or Excel list of stock with a bin code becomes a table, and the racks on the map are coloured from it. You can add handheld counts and RFID later without redrawing anything.

No. Spatial Map is sold online and our team works with customers in Nepal remotely, by video call and through the contact form. The app has no Nepali interface; names and labels you write can be in Nepali.

In US dollars, the same worldwide: a 7-day free trial for up to 5 facilities with no card, then Pro at $60 a month or $600 a year for up to 4 facilities. A warehouse, a shop and a factory store fit in one Pro plan. Hardware, if you ask us to source it, is quoted per project.

Put one Kathmandu store room on a live map this week.

Start the free trial, upload a stock list with its bin codes, or send us a plan or sketch of a warehouse through the contact form.