São Paulo · Santos, the Rodoanel, Guarulhos and Viracopos

Warehouse tracking in São Paulo, from the port run to the cargo airports

Spatial Map turns the plan of a shed into a live 3D map where racks, dock doors, trailers and RFID reads share one screen. Warehouse tracking in São Paulo is shaped by geography: containers come up the escarpment from the Port of Santos, ring roads spread trucks around a metropolis of 39 municipalities, and two large cargo airports sit to the north. Whichever leg your building sits on, Spatial Map shows what your own WMS, readers and sensors report about it.

No credit card. Runs in the browser. Pro is $60/month for up to 4 facilities. Book a demo

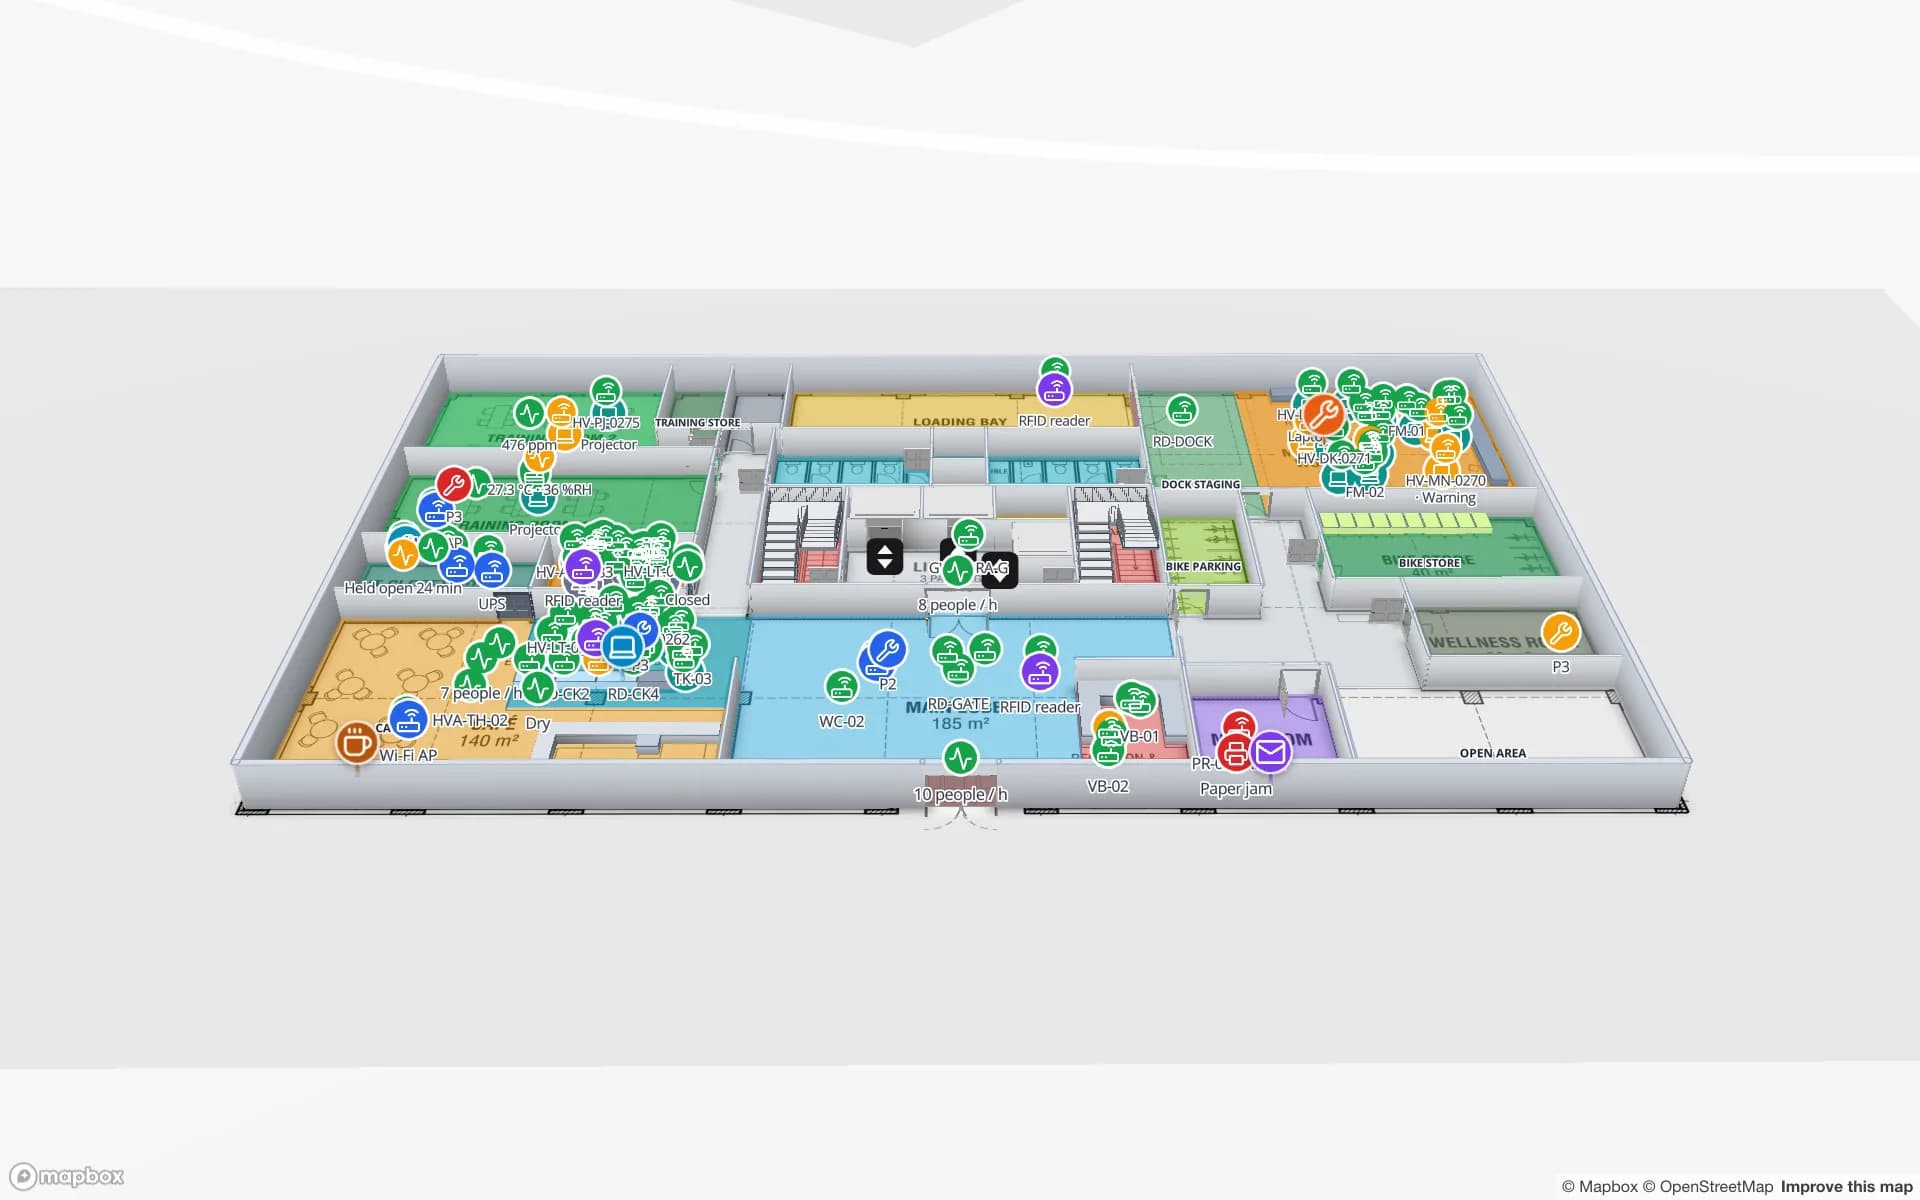
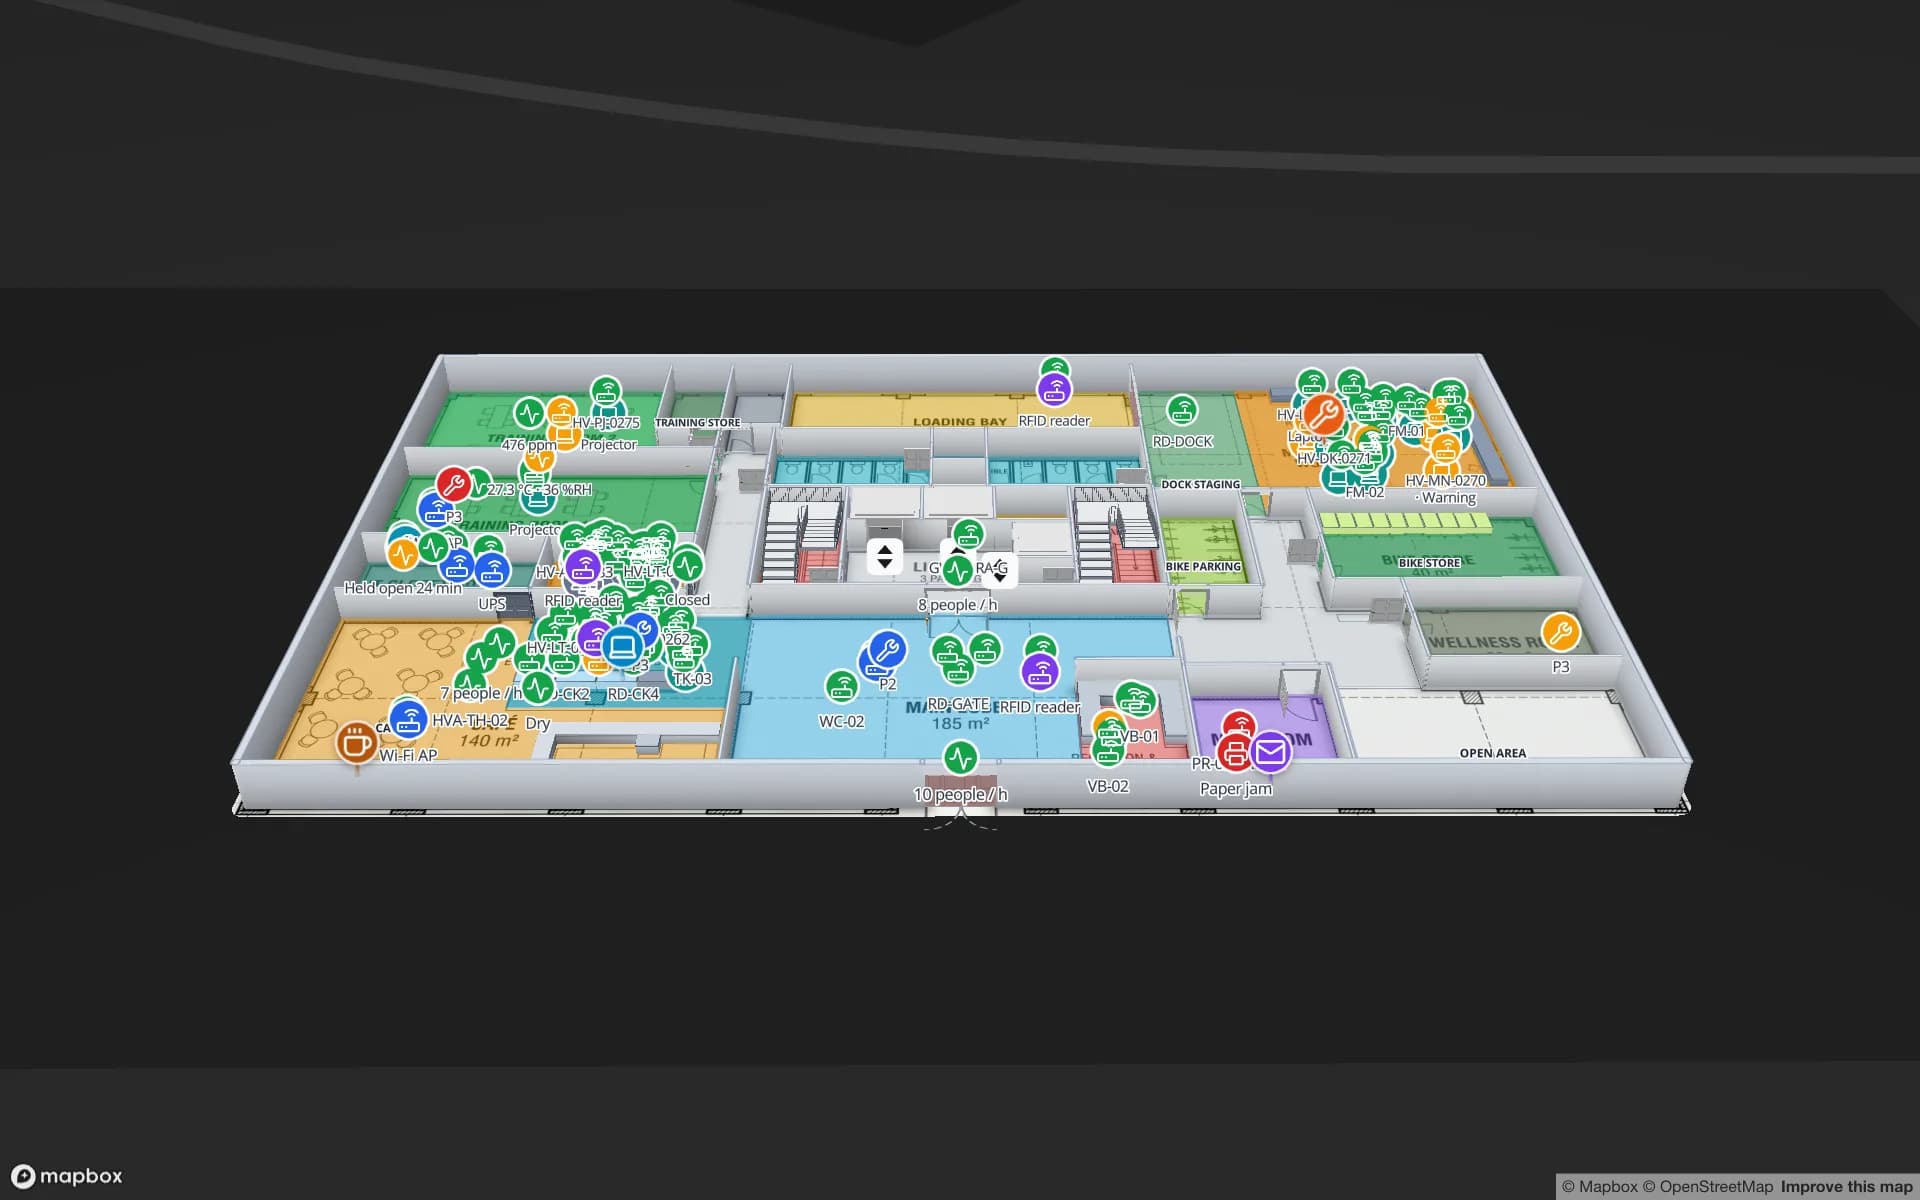
Eastport Cross-Dock Freight Hub, a cross-dock & trailer yard demo, in the Spatial Map 3D viewer with live device markers
Eastport Cross-Dock Freight Hub
Eastport Cross-Dock, a demo freight hub: 50 dock doors, 44 yard slots, the gate and weighbridge, and 1,180 RFID pallets moving through the cross-dock.
Dock doors in the Eastport cross-dock demo
50
Rack locations in the Crestline fulfilment demo
2,204
How often alert rules are checked, with alerts shown in the app
15 s
Free trial, up to 5 facilities, no credit card
7 days

The run up from Santos

The first railway from Santos to São Paulo, 79 km long, was completed in 1864, and the same climb is served today by the Anchieta and Imigrantes highways and by rail into the port. The Port of Santos itself is federally owned, run by the Santos Port Authority and Brazil’s leading container port. Everything bound for or from the plateau passes that corridor, and the buildings at either end of it are where schedules are won or lost.

At the port end, a depot or cross-dock cares about trailers, dock doors and yard slots: which trailer is on which door, which pallets are staged for which loading window. In the Eastport demo, yard slots, gate lanes and weighbridge readings share a plan with the building, and the post on yard visibility explains how the data gets there. Spatial Map does not connect to port, customs or terminal systems; your own gate and WMS records feed the map.


The Rodoanel and the logistics belt

Greater São Paulo has 39 municipalities and 20,743,587 inhabitants at the 2022 census. The Rodoanel Mário Covas ring road, a controlled-access beltway planned at 177 km with 132.5 km complete according to public records, lets freight skirt the city: its south section, opened in April 2010, links the west section to the Anchieta and Imigrantes highways, and the north section is still being completed. Sheds cluster where the ring meets the trunk roads, and their tenants change often.

A multi-tenant shed is the classic case for a map. Draw an area for each tenant, point each tenant’s stock table at its own rows, and send each customer a read-only share link locked to its floor and layers, with an expiry date and a view cap. Inside, the Crestline demo shows 20 racks with 2,204 locations coloured by stock status, pick modules, packing stations, staging lanes and the trailer yard. The post on CSV bin inventory to a live rack map shows the quickest way to colour racks from a WMS export.

Two cargo airports: Guarulhos and Viracopos

São Paulo-Guarulhos Airport is in Guarulhos, about 25 km from downtown São Paulo. It has a large air cargo terminal that can handle any cargo type, including refrigerated and hazardous shipments, and is Brazil’s busiest airport for cargo handled. Viracopos is in Campinas, about 82 km north-west of São Paulo, and was inaugurated on 19 October 1960; its administration was conceded for 30 years on 6 February 2012, and its cargo side has space for animal and refrigerated cargo and express lanes for couriers.

Around each airport, forwarders’ sheds break down and build up consolidated freight against flight cut-offs. RFID tags on cartons or pallets read at the door show the build-up area’s progress on the plan, and an alert rule for freight staged beyond a set time raises an in-app alert while there is still time to move it. Cold rooms for perishables and pharmaceuticals follow the Polar Pharma demo: rooms coloured by live temperature, held stock marked in place. Customs and airline systems stay out of it; Spatial Map shows your building.

Personal data and Portuguese

Forklift drivers, pickers and drivers are staff, and Brazil’s general data protection law (LGPD) is the context when a tag follows a person. Your legal advisers decide what applies; many projects tag pallets, cages, trolleys and equipment instead, and a data processing agreement is available.

The app is available in English, Spanish, French, German, Arabic and Chinese; Portuguese is not available. Shed supervisors typically use the map through room, lane and rack names written in Portuguese exactly as typed, and the reports your team exports carry the same names.

Services for teams in São Paulo

Which service to start with depends on the shed:

Also served nearby

The same approach covers the ABC industrial belt (Santo André, São Bernardo do Campo and São Caetano), Barueri, Osasco and Cajamar, Jundiaí, Sorocaba, São José dos Campos and the port towns of Guarujá and Cubatão. Nothing needs installing at any of them.

How Spatial Map does it

From the plan of one shed to a live map

  1. 01

    Pick one building

    The shed where a lost pallet costs most: the port-run depot, the multi-tenant warehouse or the airport build-up area.

  2. 02

    Map doors, lanes and racks

    Upload the plan, let AI Map draft walls, doors and racks for review, and name read points the way your middleware does.

  3. 03

    Connect stock and reads

    Your WMS and RFID middleware post rows through the write API, a polled REST endpoint, or CSV and Excel uploads.

  4. 04

    Add door and staging rules

    In-app alerts for pallets staged too long, trailers waiting at a door and readers that stopped reporting.

What São Paulo teams track

Port-run depots and cross-docks

Dock doors, yard slots and pallets staged for the right trailer before the loading window.

Multi-tenant fulfilment sheds

Rack locations by stock status per tenant, with a read-only share link for each customer.

Air cargo build-up areas

Cartons and pallets read at the door, staged against flight cut-offs.

Cold rooms for perishables

Rooms tinted by live temperature, with in-app alerts for excursions and silent probes.

See it on real demo facilities

Fictional names, real floor plans, live sensors, RFID, BLE tags and gateways — open any of them in the browser.

All 13 demo facilities

Warehouse tracking in São Paulo — questions we get

Yes, in two ways. Draw an area per tenant and filter each tenant’s data to its own table, then send each customer a read-only share link that locks the floor and the layers and has an expiry date. A customer who needs to log in gets a Viewer role instead.

No. Spatial Map has no link to port community, customs or terminal systems. It shows what happens inside your own building, from your WMS, gate records, RFID reads and sensors, so it complements the port-level systems rather than replacing them.

It shows counts per lane and per door and stock per rack location, not individual parcels as moving dots. Post lane counts to a table every minute or so, colour lanes by value, and use an alert rule for lanes over a limit.

No. The interface is available in English, Spanish, French, German, Arabic and Chinese, and each user picks their own. Rack codes, lane names and report titles stay exactly as you write them, accents included.

Brazil’s data protection law (LGPD) is the context when location data relates to people, and your legal advisers decide what applies. Many projects avoid the question by tagging pallets, cages and equipment instead of people.

No. Spatial Map is sold online and our team works with customers in Brazil remotely, by video call and through the contact form, in English. There are no local resellers or partners.

In US dollars, the same worldwide: a 7-day free trial for up to 5 facilities with no credit card, then Pro at $60 a month or $600 a year for up to 4 facilities. RFID hardware, if you ask us to source it, is quoted per project and is not part of the subscription.

Map one São Paulo shed before the next peak.

Start the free trial and open the Eastport demo, or send us the plan of a depot or warehouse and a sample of your WMS or RFID data through the contact form.