Santiago · Central Valley, San Antonio, Valparaíso and the airport

Cold chain monitoring in Santiago, from the orchard gate to the reefer plug

Spatial Map colours every cold room, pre-cooling tunnel and dock on a live 3D plan from the readings your probes already produce, so a room drifting out of range shows up on the map before the pallets inside do. Cold chain monitoring in Santiago follows the fruit calendar: harvest from the Central Valley arrives in dry, hot summer weather, rests in cold stores around the capital and leaves by road for San Antonio and Valparaíso or by air from Pudahuel. Spatial Map shows what your own probes and reads say about each step.

No credit card. Runs in the browser. Pro is $60/month for up to 4 facilities. Book a demo

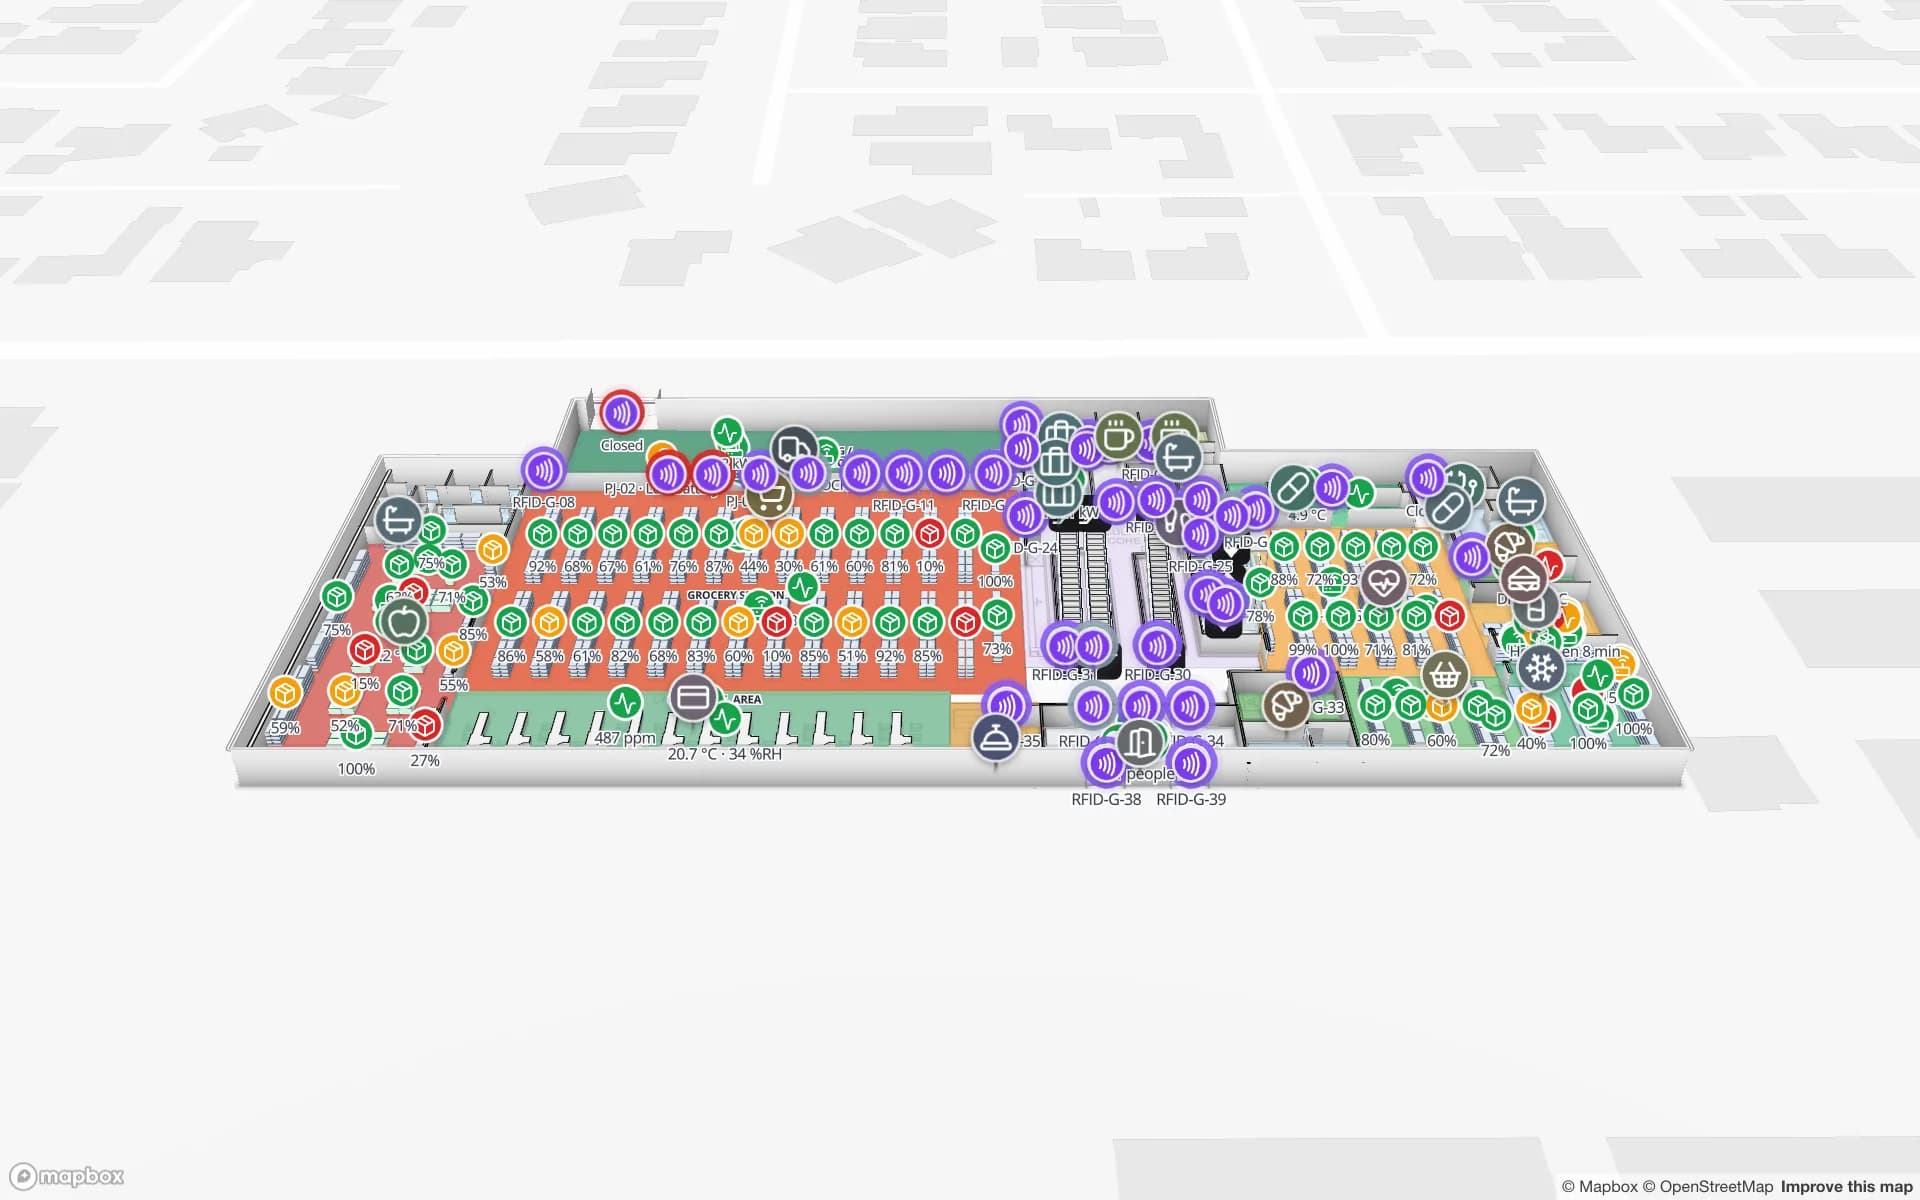
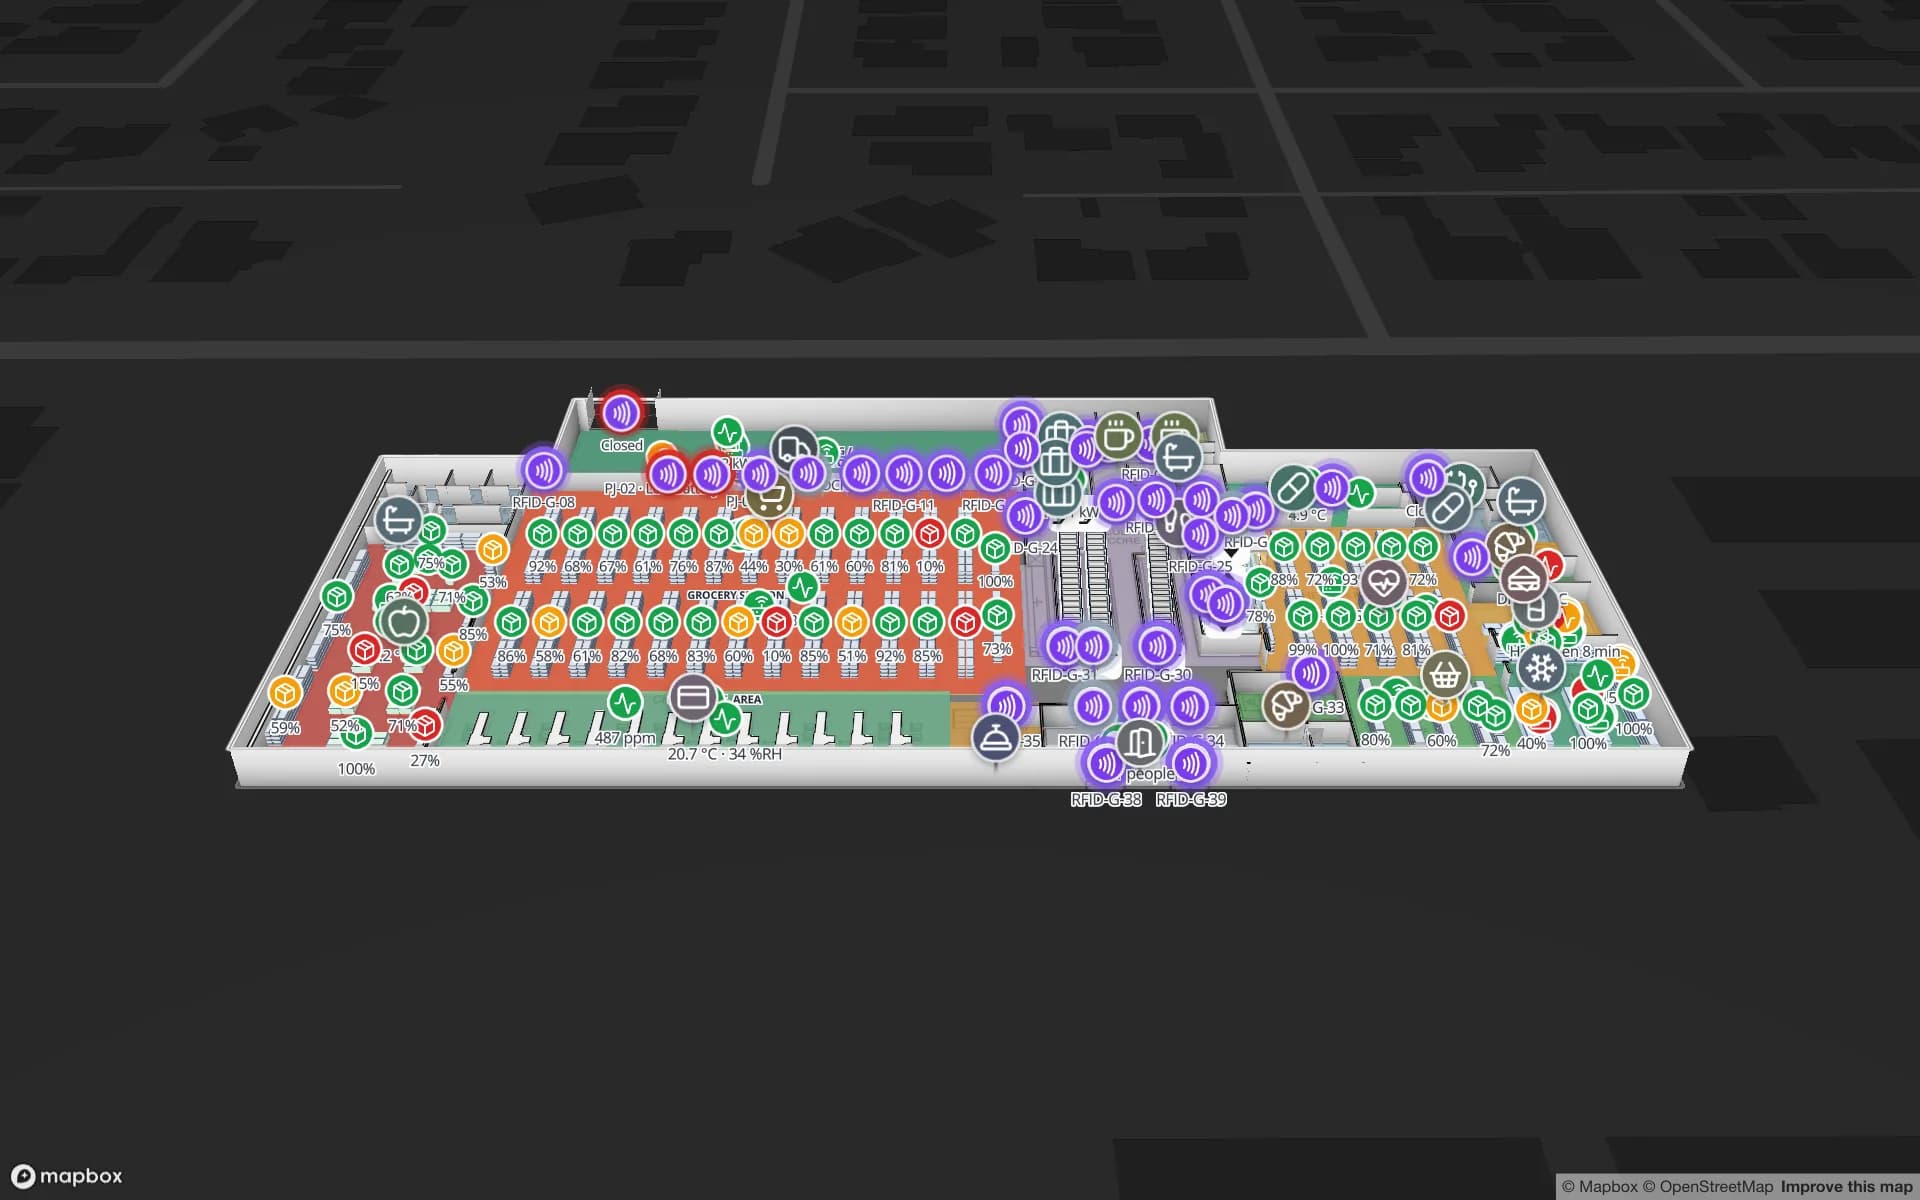
Polar Pharma — Cold Storage & QC Facility, a pharmaceutical cold store & qc lab demo, in the Spatial Map 3D viewer with live device markers
Polar Pharma — Cold Storage & QC Facility
Polar Pharma, a demo cold store: 8 temperature zones and 1,140 rack locations, probes, door sensors, reefer docks and quarantine areas on one map.
Temperature zones in the Polar Pharma cold-store demo
8
Rack locations in the Polar Pharma demo
1,140
How often alert rules are checked, with alerts shown in the app
15 s
Free trial, up to 5 facilities, no credit card
7 days

A harvest that peaks in the middle of the capital’s summer

The Santiago Metropolitan Region has 7,400,741 inhabitants at the 2024 census, six provinces and 52 communes, and a temperate Mediterranean climate: precipitation falls mainly in winter, and the summer months are usually dry and hot. It lies in the Central Valley, Chile’s agricultural heartland between the Coast Range and the Andes, and Chile’s harvest season differs from that of the Northern Hemisphere, which is what gives its fruit its export value.

The heat is the point. Fruit picked on a hot day must be pre-cooled and kept cold from the packhouse onward, and every handover — pre-cooling tunnel, cold room, trailer, port — is a place where a pallet can be too warm for too long. Spatial Map tints each tunnel and room from its latest probe reading, shows door sensors so you can tell which cold room is open, and keeps every reading in row history for the rest of the season. The Polar Pharma demo shows the pattern with 8 temperature zones; the post on cold-storage temperature monitoring with a heatmap shows how a heatmap exposes the warm corner.


San Antonio and Valparaíso, and the cherry ships

Two ports on the coast take most of the fruit. For the 2025–26 season, the first dedicated “Cherry Express” ships sailed from Puerto San Antonio to China in late November 2025; the industry scheduled 32 nonstop sailings, double the previous season’s 16, and Frutas de Chile promoted the season. San Antonio’s two concessioned container terminals moved 1,474,958 TEU in January–September 2025, up 12 % year on year. The Terminal Pacífico Sur at Valparaíso describes itself as 113 km from Santiago.

The port’s own reefer plugs are its operator’s business; your side begins at the gate of your cold store. On the map, the dock door a trailer is loading at, the pallets staged for that container and the temperature of the room they came from share one plan, as in the Eastport demo. When a sailing is missed, the question is usually which pallets were not ready; a lane view of staged and held pallets answers it in seconds. Export documents and phytosanitary records stay in the systems that own them.

Reading the cold store as an operations map

A useful cold-store map is not just colours. Draw each room and tunnel as an area, link each to its probe table, and decide the bands — for example, chilled room, freezer, pre-cooling tunnel — with a rule per band. Alert rules check every 15 seconds and can match when a value is out of range for N minutes, or when a probe has not updated for N minutes; alerts appear in the app’s bell, toast and Alerts page, and can be acknowledged and resolved there.

Add reports for the people who ask questions after the fact: Spatial Map’s built-in reports and report builder export to PDF, Excel, CSV and JSON, and a public read-only report link goes to a buyer without an account. Spatial Map makes no food-safety, phytosanitary or buyer-audit claim; your quality system and the importer’s requirements stay the record. See the cold-chain solution and temperature monitoring for how teams set this up.

Santiago’s airport and the last mile to the shelf

Arturo Merino Benítez International Airport is in Pudahuel, about 15 km north-west of central Santiago; the construction begun in 1961 included cargo facilities, and the airport is served by a number of cargo airlines. Perishables and other time-critical freight leave Santiago through it, while the region’s 7.4 million inhabitants are supplied from distribution centres and cold stores spread across its communes.

For a chilled distribution centre, the same map shows reefer docks, cold rooms and the staging lane where cartons wait for the trucks; item-level RFID helps in retail stores. See Retail Mart for the store side, and Crestline for racks and staging.

Services for teams in Santiago

Where Santiago teams usually start:

  • Packhouses and exporters usually begin with temperature monitoring on tunnels and rooms, because an excursion found late costs a whole pallet.
  • Chilled and frozen distribution centres add inventory tracking at dock doors and in staging lanes.
  • Forklifts, pallet jacks and crates need asset tracking; RTLS and UWB only where vehicles and people must be located continuously.
  • If you have no probes, gateways or tags yet, our team can source them on request, quoted per project, with warranty and device support from the manufacturer: see hardware and demo kits on request. The interface is in Spanish, and services are described en español.
  • Our team builds ERP and WMS integrations and other custom software as client projects; the product runs as cloud or on-premises.

Also served nearby

The same approach covers cold stores and packhouses in Quilicura, Pudahuel, Maipú, San Bernardo, Buin, Colina and Lampa, and the neighbouring valleys towards Rancagua and the coast. Nothing needs to be installed at any of them.

How Spatial Map does it

From the cold-store plan to the first alert

  1. 01

    Map rooms, tunnels and docks

    Upload the plan and draw each cold room, pre-cooling tunnel, reefer door and rack, or let AI Map draft them for a person to review.

  2. 02

    Connect the probes

    Your probe gateway or SCADA posts rows to a table with the write API, or Spatial Map polls a REST endpoint; CSV uploads work for history.

  3. 03

    Colour the rooms

    Link each probe table to its area so rooms tint by live reading, with doors and held pallets marked.

  4. 04

    Add excursion rules

    In-app alerts for rooms out of range for N minutes and probes silent for N minutes, with acknowledge and resolve.

What Santiago teams track

Fruit cold stores and pre-cooling tunnels

Rooms and tunnels tinted by live temperature, with alerts for excursions and silent probes.

Reefer docks before the port run

Trailers at dock doors and pallets staged for each container, by lane.

Chilled distribution centres

Rack locations by stock status and staging lanes, beside temperature zones.

Stores with chilled displays

Fridge and freezer sensors and item-level RFID across the floors.

See it on real demo facilities

Fictional names, real floor plans, live sensors, RFID, BLE tags and gateways — open any of them in the browser.

All 13 demo facilities

Cold chain monitoring in Santiago — questions we get

No. Spatial Map does not make sensors. Your probes and gateways measure; Spatial Map shows the readings, coloured on the plan, with alerts and history. Sensor accuracy and calibration are your supplier’s and your quality system’s business.

Yes. An alert rule of the type “not updated for N minutes” raises an in-app alert, checked every 15 seconds, and a second rule on temperature raises one when a room stays out of range for N minutes. Alerts appear in the app only; there is no email, SMS or push notification.

No. Export documents, phytosanitary records and customs data stay in the systems that own them. Spatial Map shows what happens inside your building, and you can share a read-only report link with a buyer.

Yes. The app is available in Spanish alongside English, French, German, Arabic and Chinese, and each user picks their own. Room names and report titles stay exactly as you write them, accents and ñ included.

Yes, in a browser. Nothing is installed; viewing needs a connection, and your middleware usually buffers probe data and posts it when the link returns. There is no separate mobile app.

No. Spatial Map is sold online and our team works with customers in Chile remotely, by video call and through the contact form, in Spanish or English. There are no local resellers or partners.

In US dollars, the same worldwide: a 7-day free trial for up to 5 facilities with no credit card, then Pro at $60 a month or $600 a year for up to 4 facilities. Larger estates are quoted as custom services.

Put one Santiago cold room on a live map before the next harvest.

Start the free trial in Spanish or English and open the Polar Pharma demo, or send us the plan of a cold store and a sample of your probe data through the contact form.