Antwerp · Port of Antwerp-Bruges, the quays and the chemical cluster

Asset tracking in Antwerp, from the quay yard to the chemical warehouse

Spatial Map shows where tagged equipment, containers and returnable packaging are inside a building or yard, on a live 3D map fed by the reads and positions your RFID, BLE and UWB systems already produce. Asset tracking in Antwerp is shaped by one of Europe’s big ports and the plants and warehouses that grew around it: the things that go missing are not only pallets but reusable tanks, chassis, forklifts, drums and tools that move between yard, shed and workshop every day. Each site is its own facility, and all of them can sit in one workspace.

No credit card. Runs in the browser. Pro is $60/month for up to 4 facilities. Book a demo

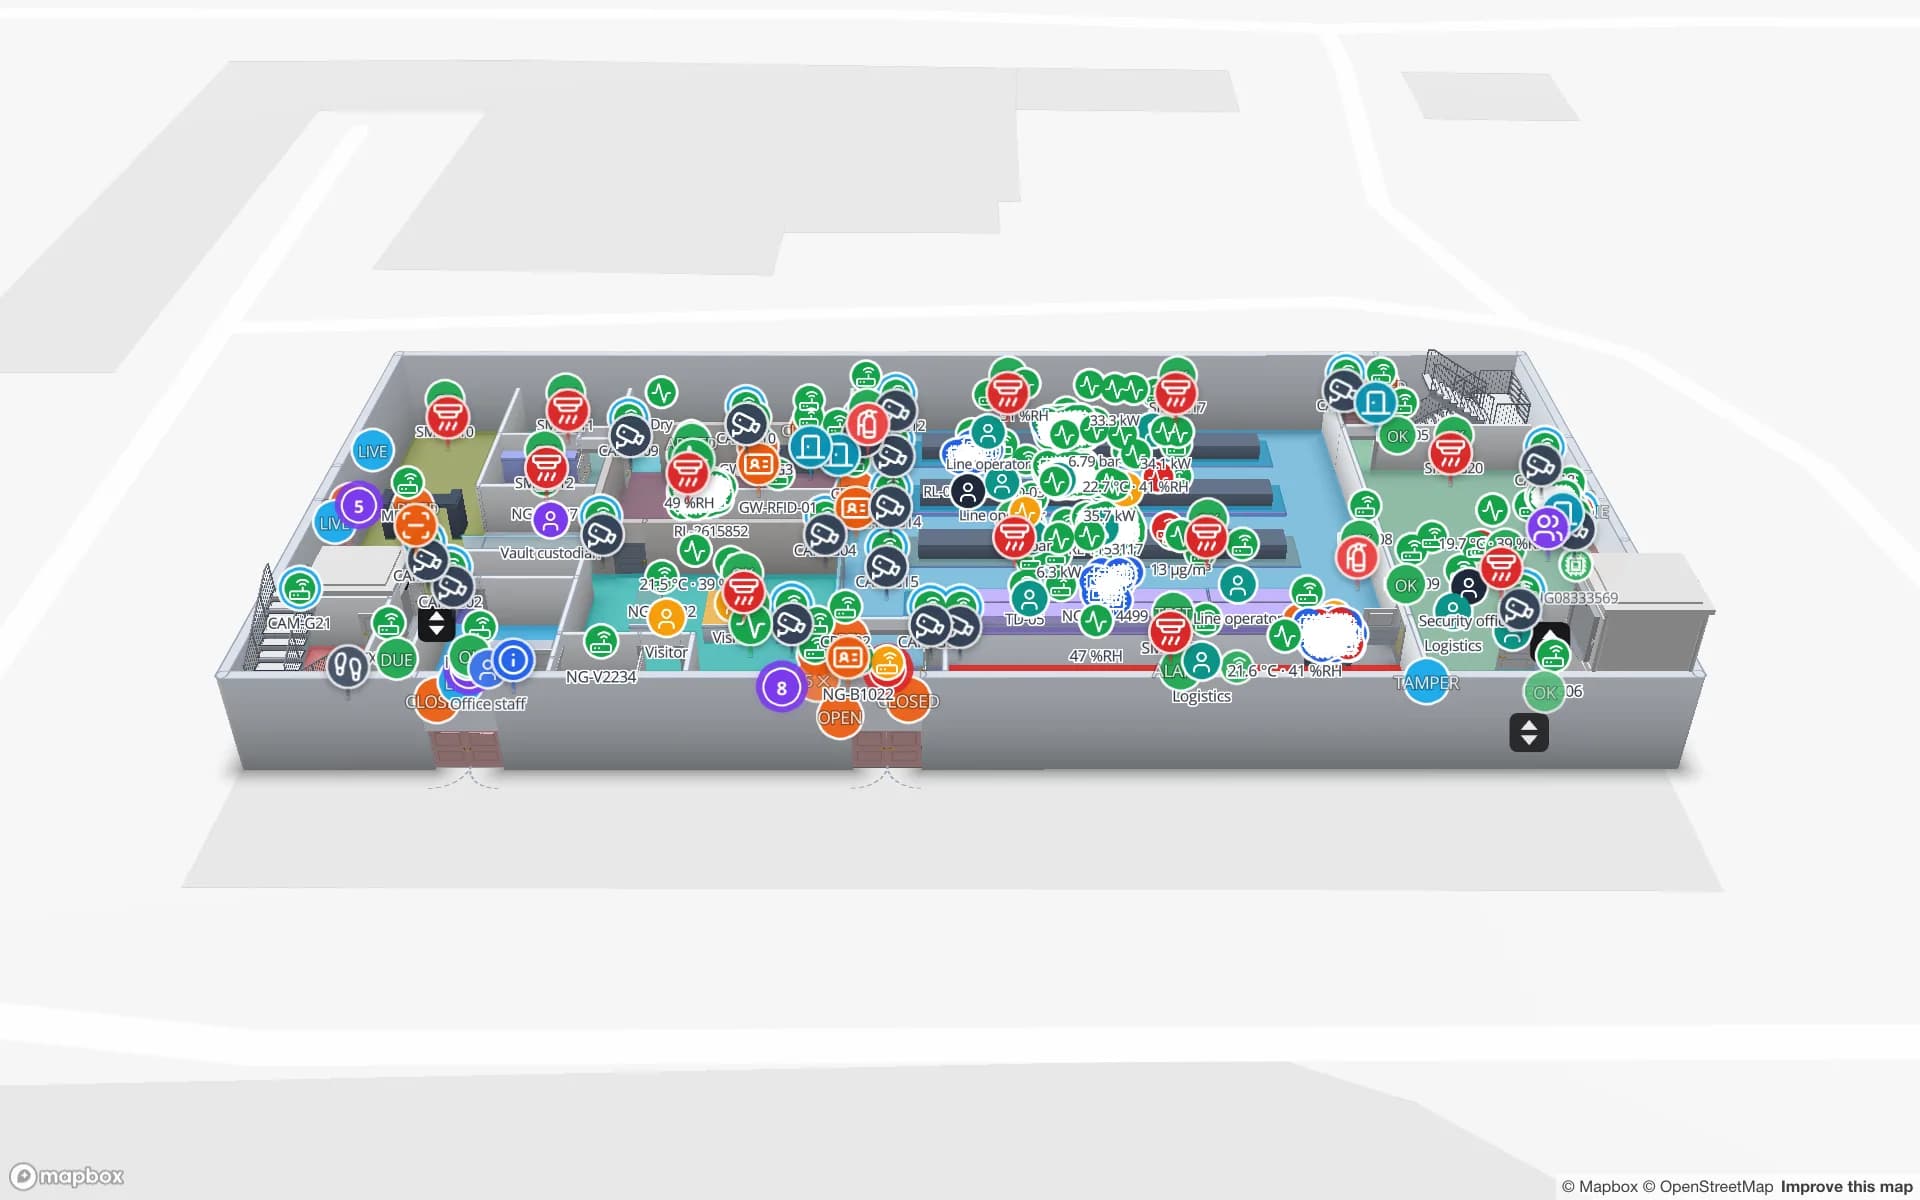
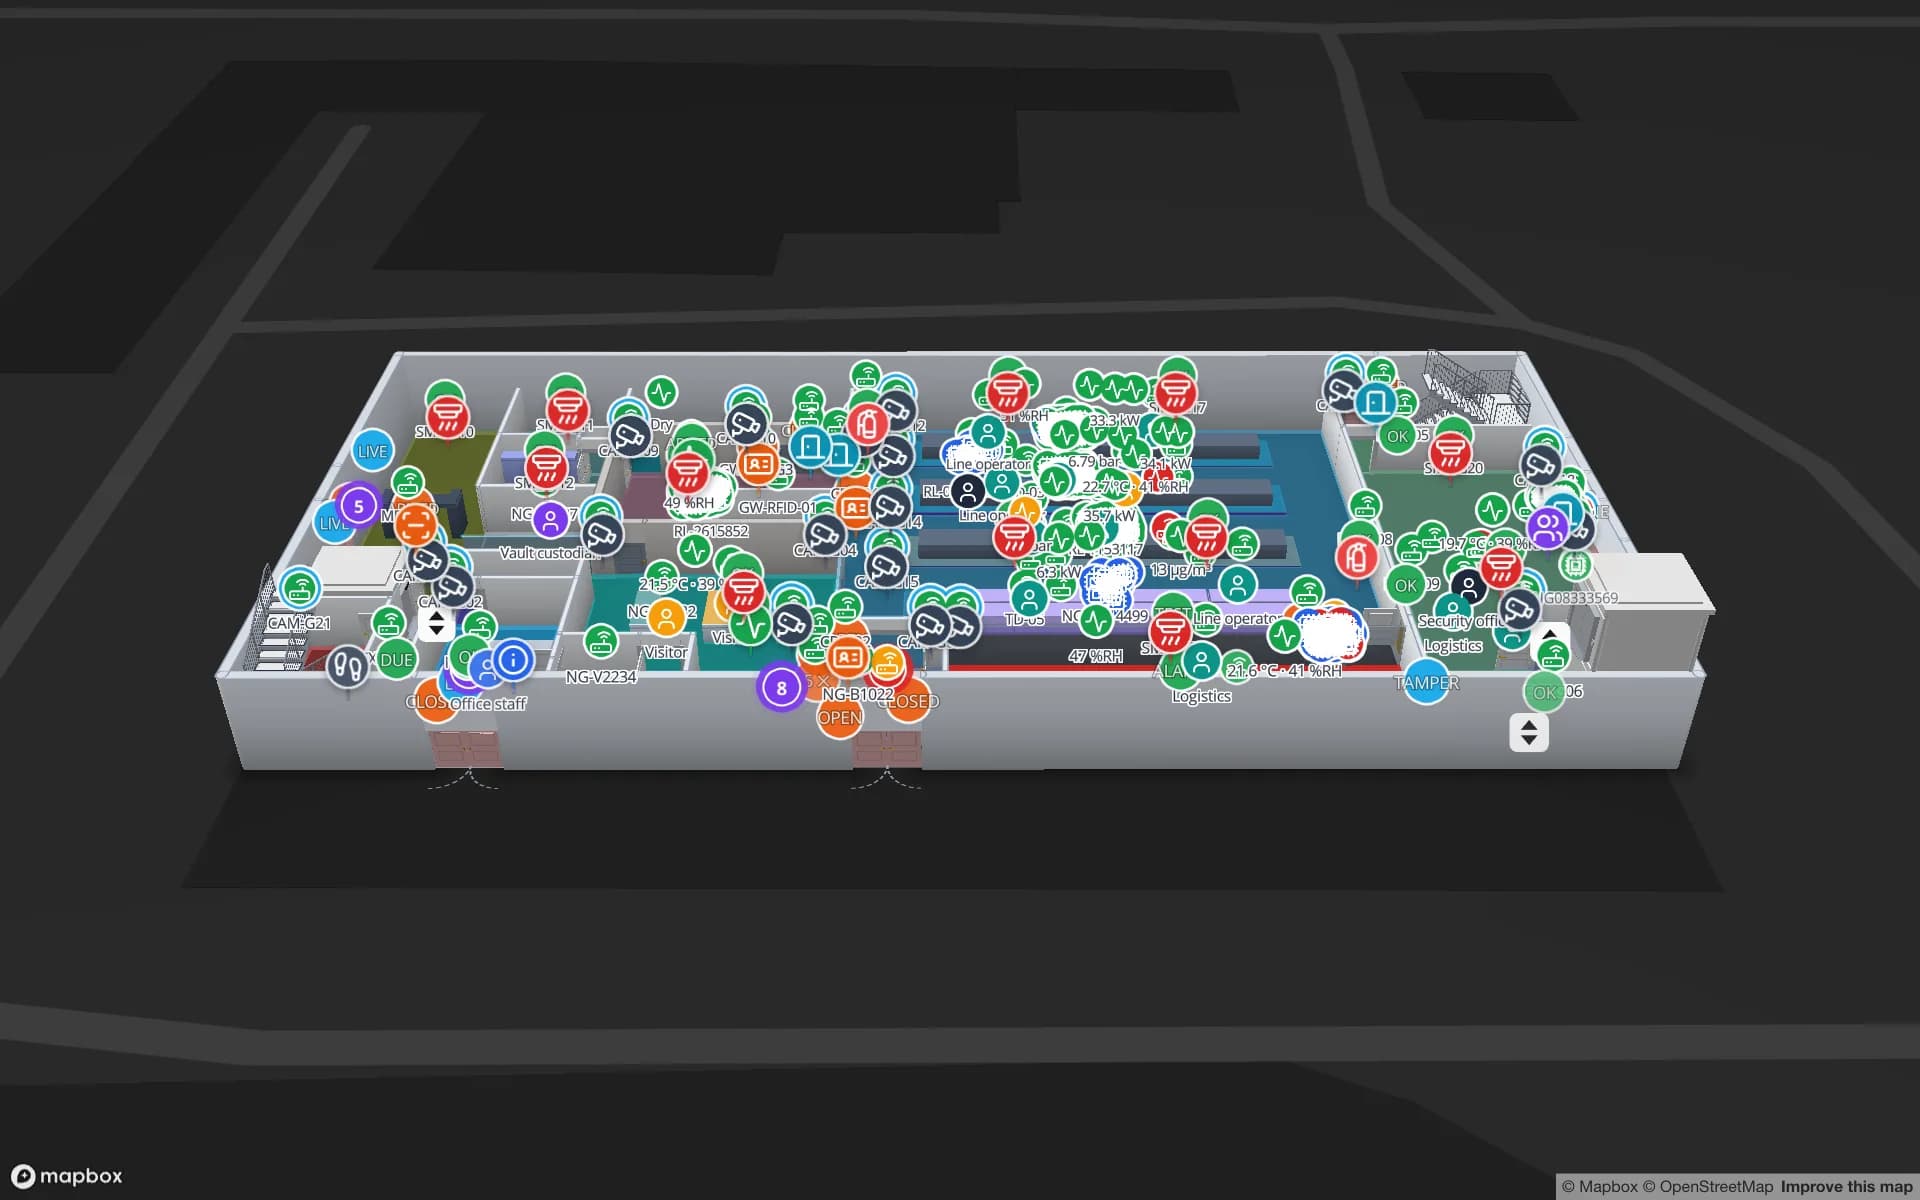
Summit Assembly Plant, a assembly plant demo, in the Spatial Map 3D viewer with live device markers
Summit Assembly Plant
Summit Assembly, a demo plant: production lines, workstations and 867 raw-material and finished-goods rack locations on one map.
Rack locations in the Summit assembly-plant demo
867
Tagged units in the Northgate secure-store demo
863
How often alert rules are checked, with alerts shown in the app
15 s
Free trial, up to 5 facilities, no card
7 days

One port authority, many sites: Antwerp and Zeebrugge since 2022

Antwerp and Zeebrugge operate as Port of Antwerp-Bruges: the shareholders’ agreement was signed on 22 April 2022. The port’s press release describes Antwerp as strong in handling and storing containers, breakbulk and chemical products, and Zeebrugge as a hub for roll-on roll-off traffic, container handling and the transhipment of liquefied natural gas.

A port authority is a landlord and regulator; the assets that move are yours and your tenants’. Cranes, chassis, trailers, reach stackers, reusable crates, forklifts and the tools of the maintenance shop all have an owner, a home and a status, and none of them stays where the register says. Spatial Map keeps the register as a table — tag ID, owner, home location, status — and shows each item’s last-seen area on a plan of the yard, shed or workshop. Alert rules raise an in-app alert when an item has not been seen for N minutes, or has been in a loading area too long.
Left Bank, Right Bank, and the buildings in between

Antwerp’s dock complex is divided by the Scheldt into a Left Bank — the Kallo Lock, the Verrebroek and Vrasene docks and the Deurganck Dock — and a Right Bank with the Berendrecht Lock and the Europa and North Sea terminals; the Right Bank’s development began with the Berendrecht Lock in 1989. A fleet that works on both sides is spread over many yards and sheds, and the question “which side is it on?” is a daily one.

Draw each site as a facility and the fleet as one table: tagged reusable equipment appears wherever its reads are posted. BLE gateways named after the areas they cover, or RFID portals at gates and workshop doors, tell your system where each item is. The map colours the item by status and the History player replays where it has been; see the post on BLE gateway asset tracking and RFID gates.

The chemical cluster: context, and what location data is for

The port describes Antwerp as home to Europe’s largest integrated chemical cluster, bringing together production, tank storage, terminals and distribution in one ecosystem, and it lists specialist facilities for hazardous goods in warehouses and tanks. That claim is the port’s own, but the picture is familiar to anyone who works there: packaged chemicals, polymers and drums stored in compartments, moved in intermediate bulk containers and returnable packaging that must come back to the right owner.

For a warehouse in that setting Spatial Map draws compartments, racks, dock doors and yard slots on the plan and colours them from your WMS; tagged IBCs and drums read at the doors appear as live markers. Returnable packaging is the usual first project, because a lost container is a cost with a name on it; the page on RFID asset management covers the pattern. Spatial Map is a logistics tool, not a safety system. It does not replace dangerous-goods procedures, permits, gas detection or your safety adviser, and it makes no safety or compliance claim.

Workshops, tools and shared equipment

Around any large port are the workshops that keep it running: maintenance stores, tool cribs, calibration cabinets, welding and electrical shops. The assets there are small and shared, and a stopped crane or pump waits for a missing tool. Tag the tools, read them at the crib door, and the map shows who has what and what is overdue; RFID tool tracking walks through it.

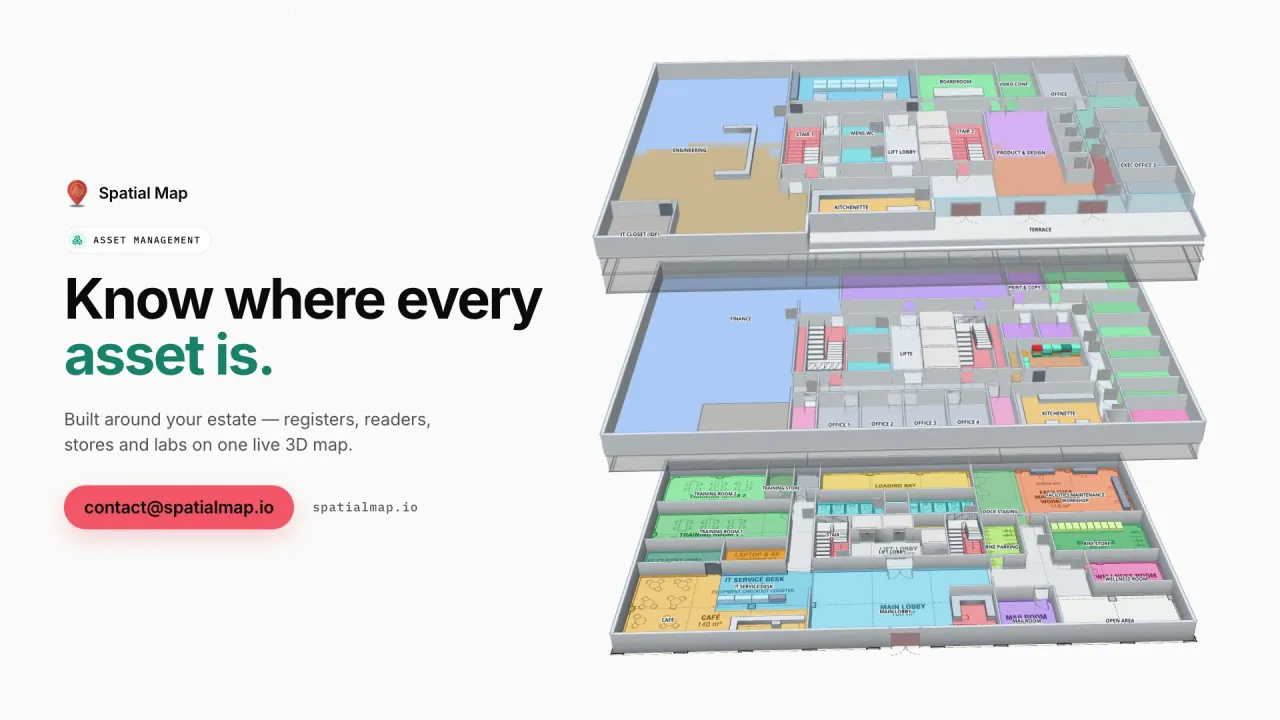
The Summit demo shows a plant with lines, workstations and rack locations, and the Northgate demo follows 863 tagged units through a secure store on two floors with access control and counters, a pattern that also fits a high-value tool store. Both use fictional data; yours replaces it.

Languages and working with a Flemish team

Flemish teams work in Dutch, but the Spatial Map interface is not yet available in it. It is available in English, French, German, Spanish, Arabic and Chinese, and each user picks their own, so a Flemish maintenance team can use English while a French-speaking planner uses French on the same facility. Asset names, area names and report titles stay in whatever language you type them, including Dutch.

Our team works with Belgian customers remotely, in English, French or German, by video call and through the contact form.

Services for teams in Antwerp

Where Antwerp teams usually start depends on the site:

  • Yard and depot operators start with asset tracking for reusable equipment and vehicles, then link it to inventory tracking for cargo in the shed.
  • Chemical and bulk warehouses start with returnable packaging and the compartment map, using RFID inventory management at the doors.
  • Maintenance shops start with tool tracking and an asset register by room.
  • RTLS and UWB is for large sheds where forklifts and people must be located continuously; a BlueIOT RTLS server connects directly and other engines through the write API.
  • If you have no readers, gateways or tags yet, our team can source them on request, quoted per project, with warranty and device support from the manufacturer: see hardware and demo kits on request.
  • Asset back offices and ERP integrations are built as client projects, for example an asset management system. The product runs as cloud or on-premises.

Also served nearby

The same approach covers the Antwerp suburbs and industrial parks, Kallo and Beveren on the Left Bank, Mechelen, Lier, Ghent and the Zeebrugge and Bruges side of the combined port.

How Spatial Map does it

Building an Antwerp asset map

  1. 01

    Load the asset register

    Upload a CSV or Excel list of assets with tag IDs, owners and home locations as a table.

  2. 02

    Map yards, sheds and workshops

    Upload plans, let AI Map draft the floors for review, and draw each store, gate and workshop as an area.

  3. 03

    Connect reads

    RFID portals, BLE gateways or UWB positions post rows through the write API, a polled REST endpoint or a connected RTLS server.

  4. 04

    Add return and silence rules

    In-app alerts for items not seen for N minutes, overdue returns and readers that stopped reporting.

What Antwerp teams track

Returnable packaging and IBCs

Tagged containers with owner, location and status, read at the gates and doors.

Yard equipment and forklifts

Last-seen area, utilisation by area and history per vehicle.

Port-side and chemical warehouses

Compartments, racks and dock doors coloured by stock and status.

High-value tool and spares stores

Who has what, what left the store and what is overdue.

See it on real demo facilities

Fictional names, real floor plans, live sensors, RFID, BLE tags and gateways — open any of them in the browser.

All 13 demo facilities

Asset tracking in Antwerp — questions we get

Only what your own systems report. It does not read container numbers, connect to terminal systems or track vehicles on its own. If your yard system, tags or gateways post positions or area names to a table, the map shows them on the plan of the yard, and the History player replays them.

No. It is a logistics view: where tagged items, compartments and racks are and what status your systems give them. It does not replace dangerous-goods procedures, permits, gas detection or your safety adviser, and Spatial Map makes no safety or compliance claim.

Yes. Each site is a facility, and one table can hold assets for all of them; layers and filters show one site or all. Roles control who sees which facility.

Not yet. It is available in English, French, German, Spanish, Arabic and Chinese, and each user picks their own language. Asset names, areas and report titles can be in Dutch exactly as you type them.

Usually not. Most teams start with RFID portals at gates and doors or BLE gateways per area, which give an area per item rather than metre-level positions. UWB is for sites that need continuous positions. Spatial Map does not compute positions from BLE signal strength itself.

No. Spatial Map is sold online and our team works with customers in Belgium remotely, by video call and through the contact form, in English, French or German. There are no local resellers or partners.

In US dollars, the same worldwide: a 7-day free trial for up to 5 facilities with no card, then Pro at $60 a month or $600 a year for up to 4 facilities. Larger estates are quoted as custom services; hardware is quoted per project.

Map one Antwerp yard or store this week.

Start the free trial and open the Summit demo, or send us an asset list and a plan of one yard, shed or workshop through the contact form.