Belgium · Belgique · België

Indoor mapping and RFID tracking software for Belgium

Belgium is small on the map and large in logistics: Port of Antwerp-Bruges is one of Europe’s largest ports, Liège Airport is a major cargo airport, Antwerp hosts one of the continent’s biggest chemical clusters, and the pharmaceutical sector manufactures and ships medicines and vaccines worldwide. Spatial Map turns the cold stores, plants and distribution centres behind them into live 3D maps in the browser — in French or German, or in English for Flemish and international teams.

No credit card. Runs in the browser. Pro is $60/month for up to 4 facilities. Book a demo

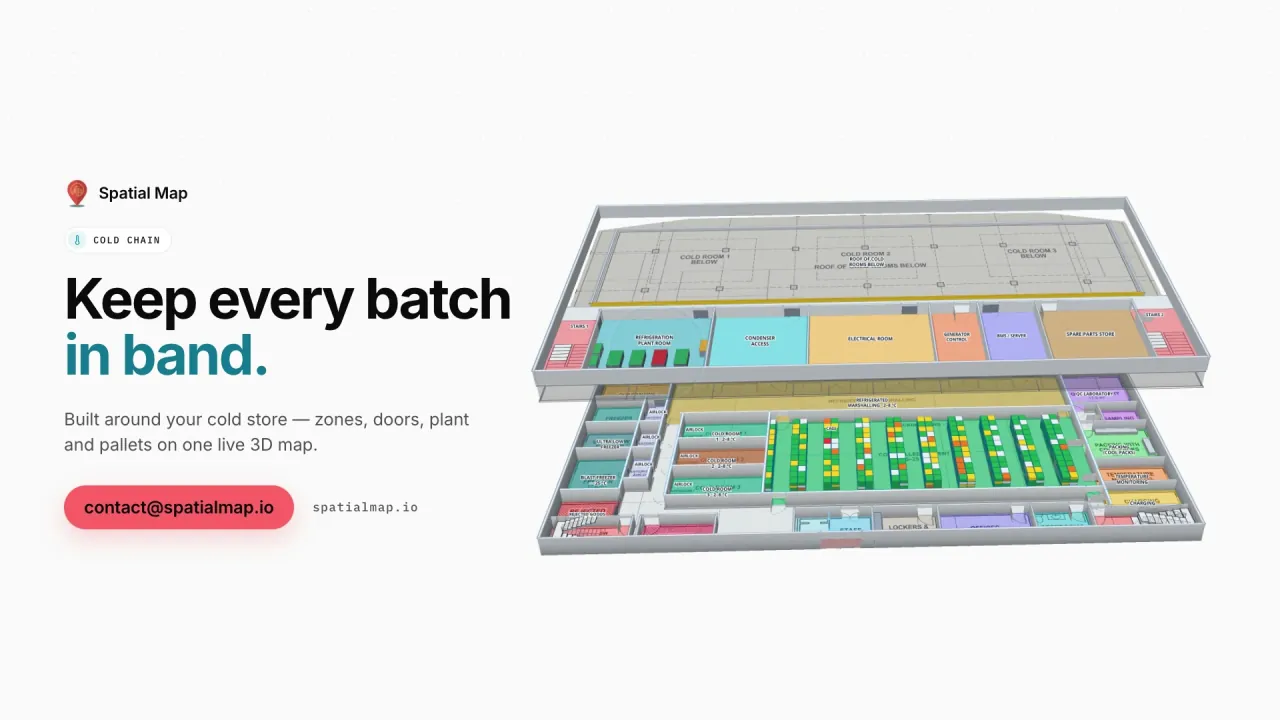
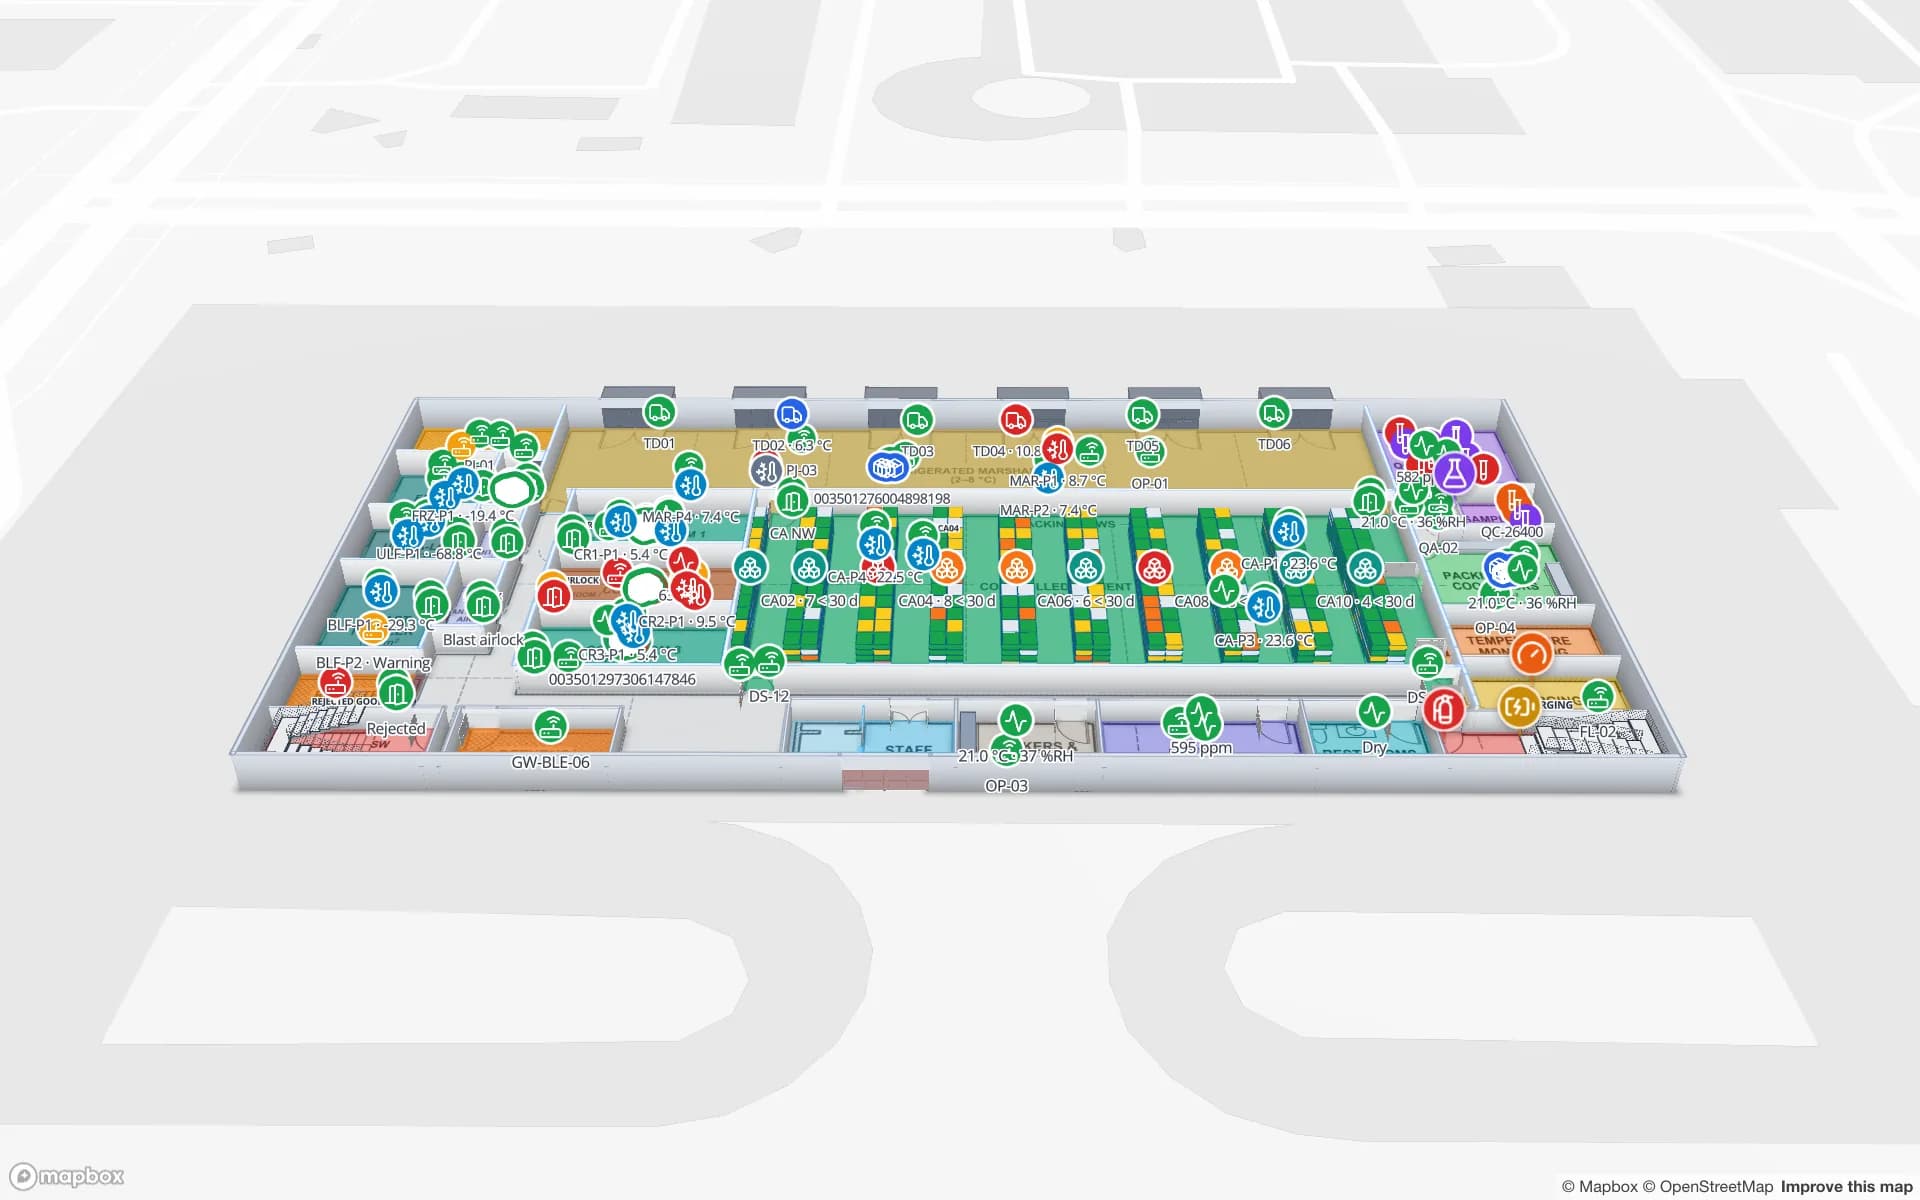
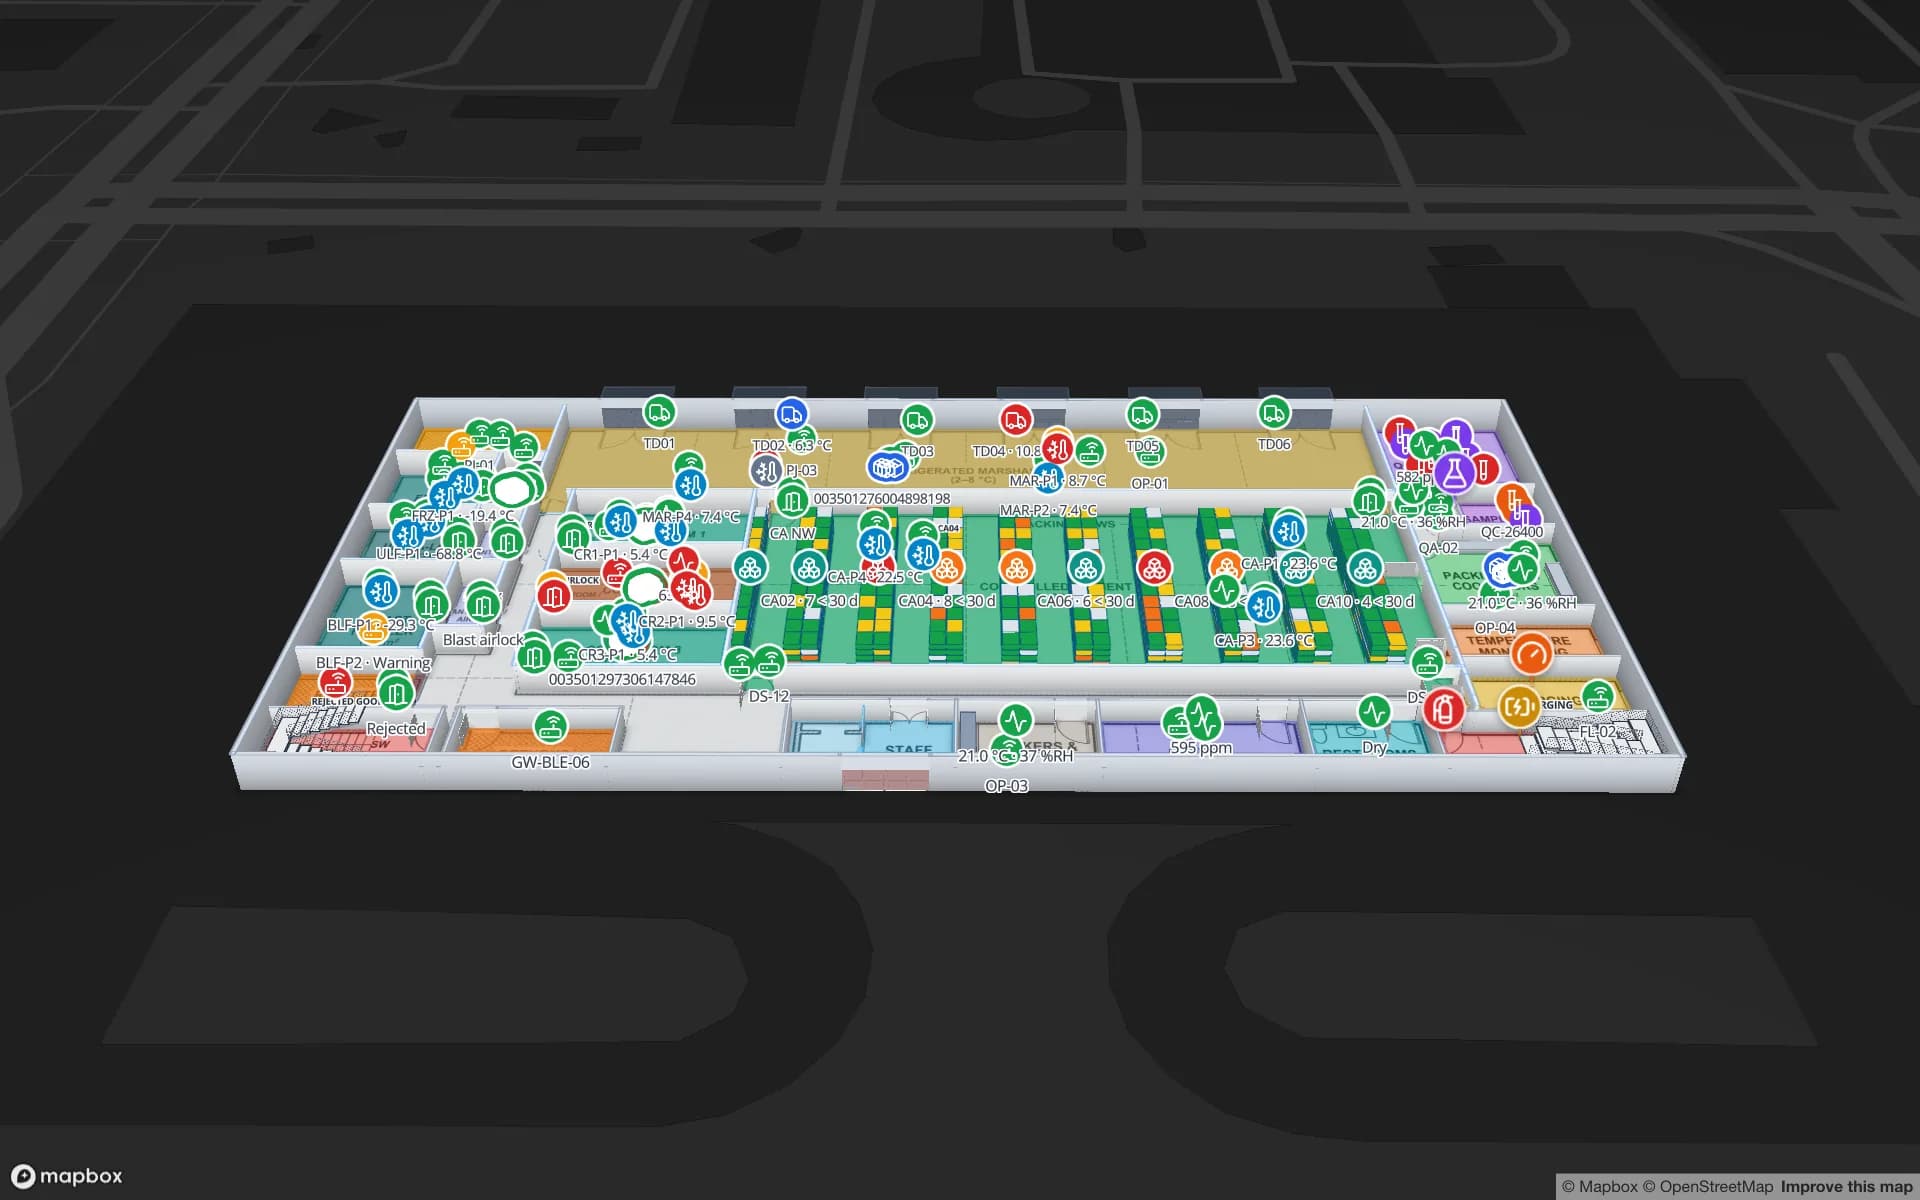
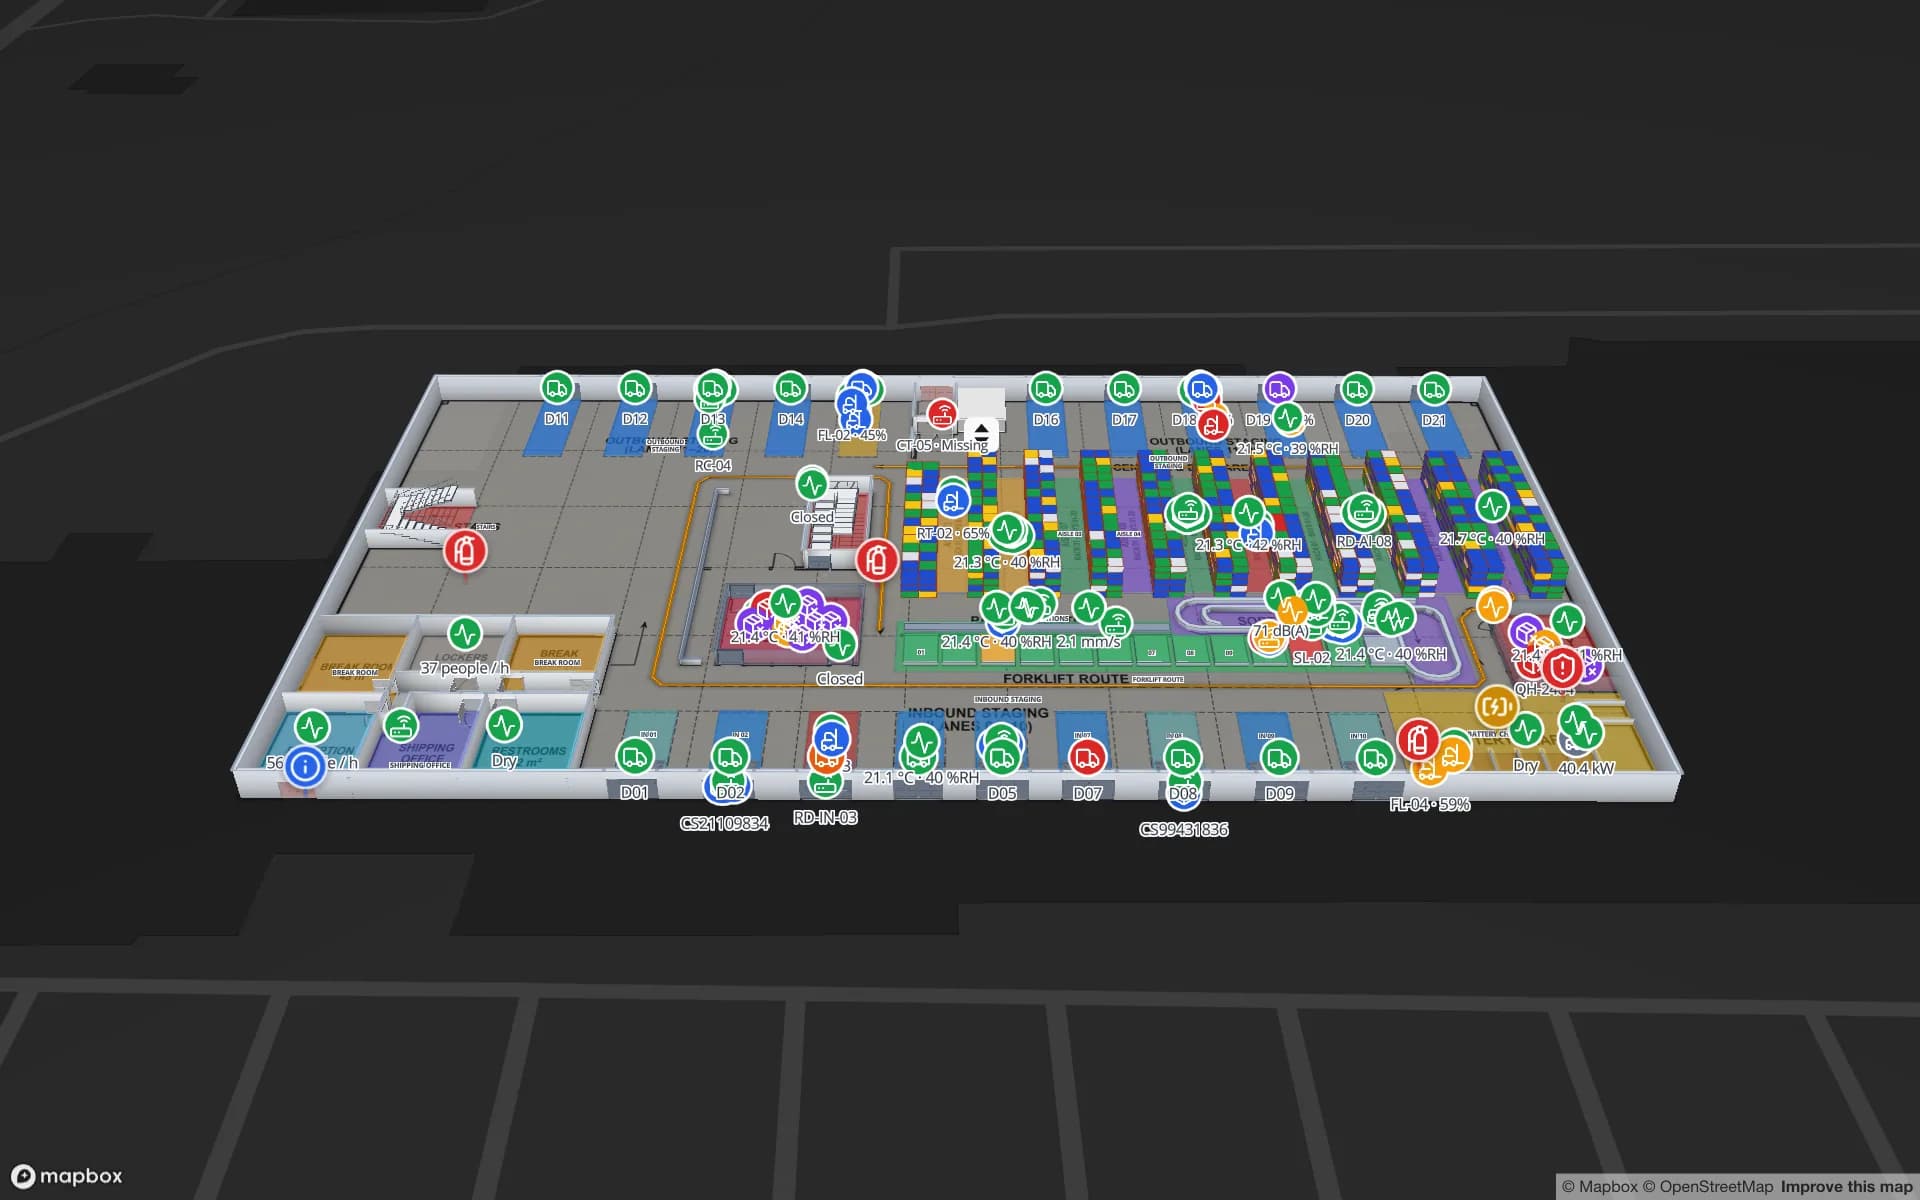
Polar Pharma — Cold Storage & QC Facility, a pharmaceutical cold store & qc lab demo, in the Spatial Map 3D viewer with live device markers
Polar Pharma — Cold Storage & QC Facility
Polar Pharma, a demo cold store and QC facility: cold rooms, freezers and controlled-ambient storage with 1,140 rack locations, reefer docks, quarantine and the QC laboratory.
French and German interface (Dutch not yet available)
FR · DE
Rack locations in the Polar Pharma demo cold store
1,140
Software to install — runs in any modern browser
0
Free trial, up to 5 facilities
7 days

Pharmaceuticals and vaccines

Belgium is one of Europe’s leading pharmaceutical producers and exporters, with research, manufacturing and packaging sites in both Flanders and Wallonia, including large-scale vaccine production. From the line, products go into cold rooms, freezers and controlled-ambient stores, then to distribution centres and airports, and wholesale distribution of medicines in the EU follows the Good Distribution Practice (GDP) guidelines.

Spatial Map makes the physical state of those buildings visible. Each temperature zone is coloured by the live reading from your probes, cold-room doors show open or closed, reefer shipments sit at their docks, and stock in quarantine or waiting for QC release is marked where it stands. The Polar Pharma demo shows exactly that, including a cold room leaving its 2–8 °C band in the Cold Chain film. Spatial Map does not make a site GDP-compliant; your quality system and batch records remain the record, and the map and its exported reports help your team see and explain what happened.
Port of Antwerp-Bruges and the chemicals cluster

Since the ports of Antwerp and Zeebrugge merged in 2022, Port of Antwerp-Bruges has been one of Europe’s largest ports, handling containers, breakbulk, new vehicles and liquid bulk. Around Antwerp sits one of the largest integrated chemical clusters in Europe, together with the warehouses that store packaged chemicals, polymers and dangerous goods for the plants and their customers.

For a port-side or chemical warehouse, Spatial Map draws compartments, racks, dock doors and yard slots on the site plan and colours them from your WMS: which compartment holds which product class, which locations are full or blocked, which trailers are waiting. RFID-tagged pallets and IBCs read at the doors appear as live markers. Spatial Map does not replace your dangerous-goods procedures or permits; it shows the data you already hold on the building.

Liège Airport and air cargo

Liège Airport is one of Europe’s major cargo airports, handling express parcels, e-commerce volumes, perishables and temperature-controlled pharmaceuticals, and Brussels Airport also runs a large cargo zone. Air freight moves in hours: shipments are built up on pallets and containers, held in cool rooms, screened and loaded against a departure time.

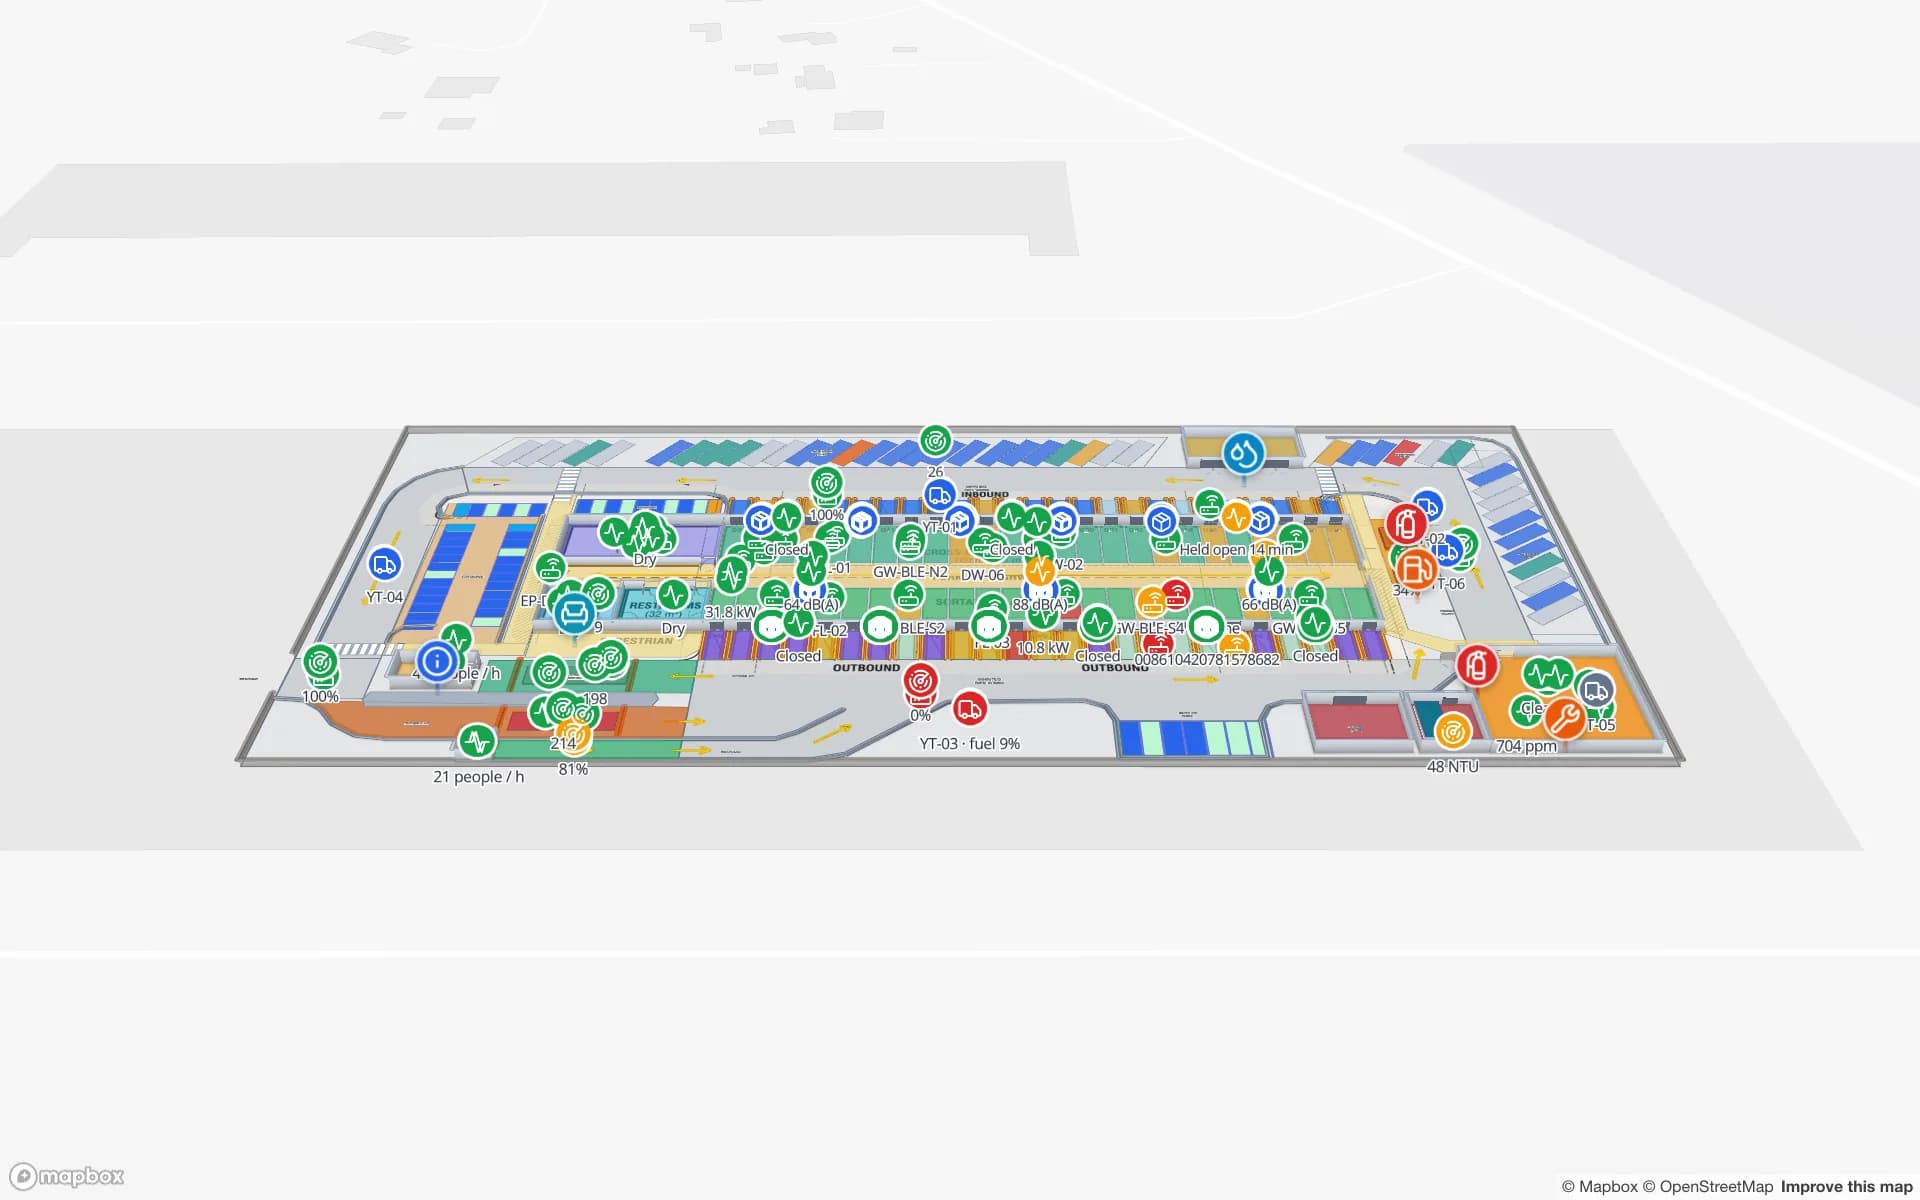
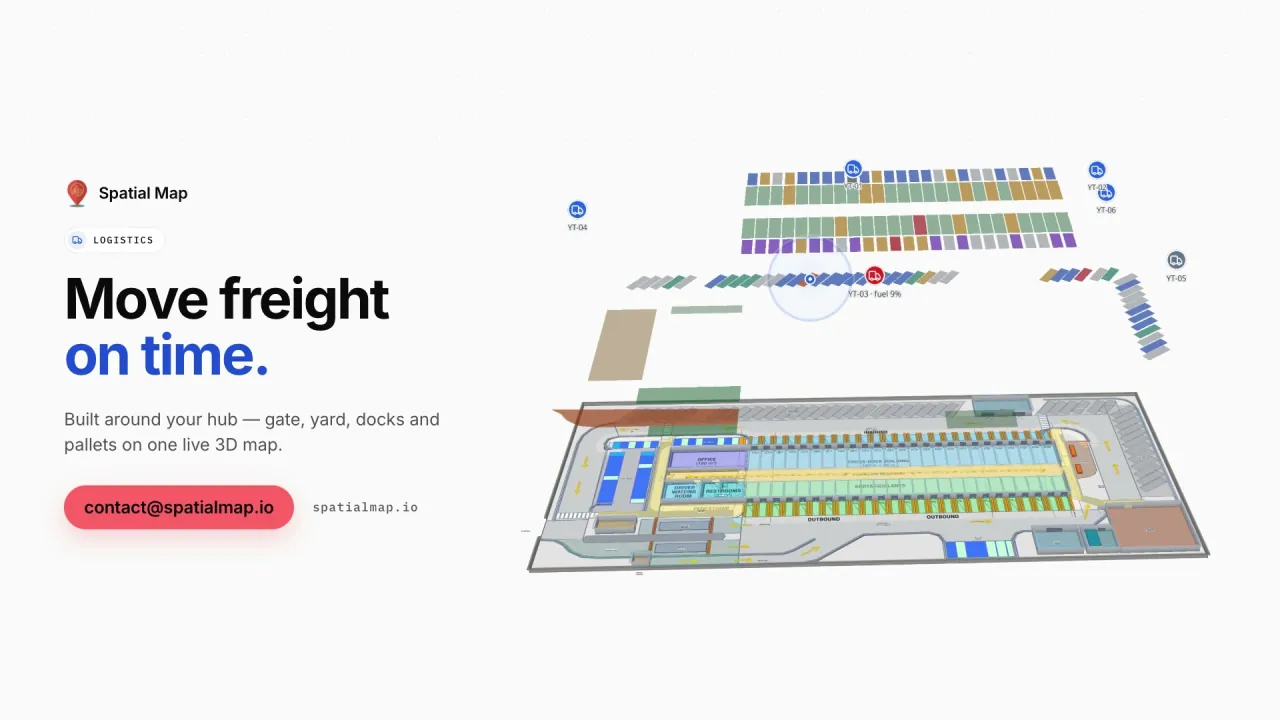
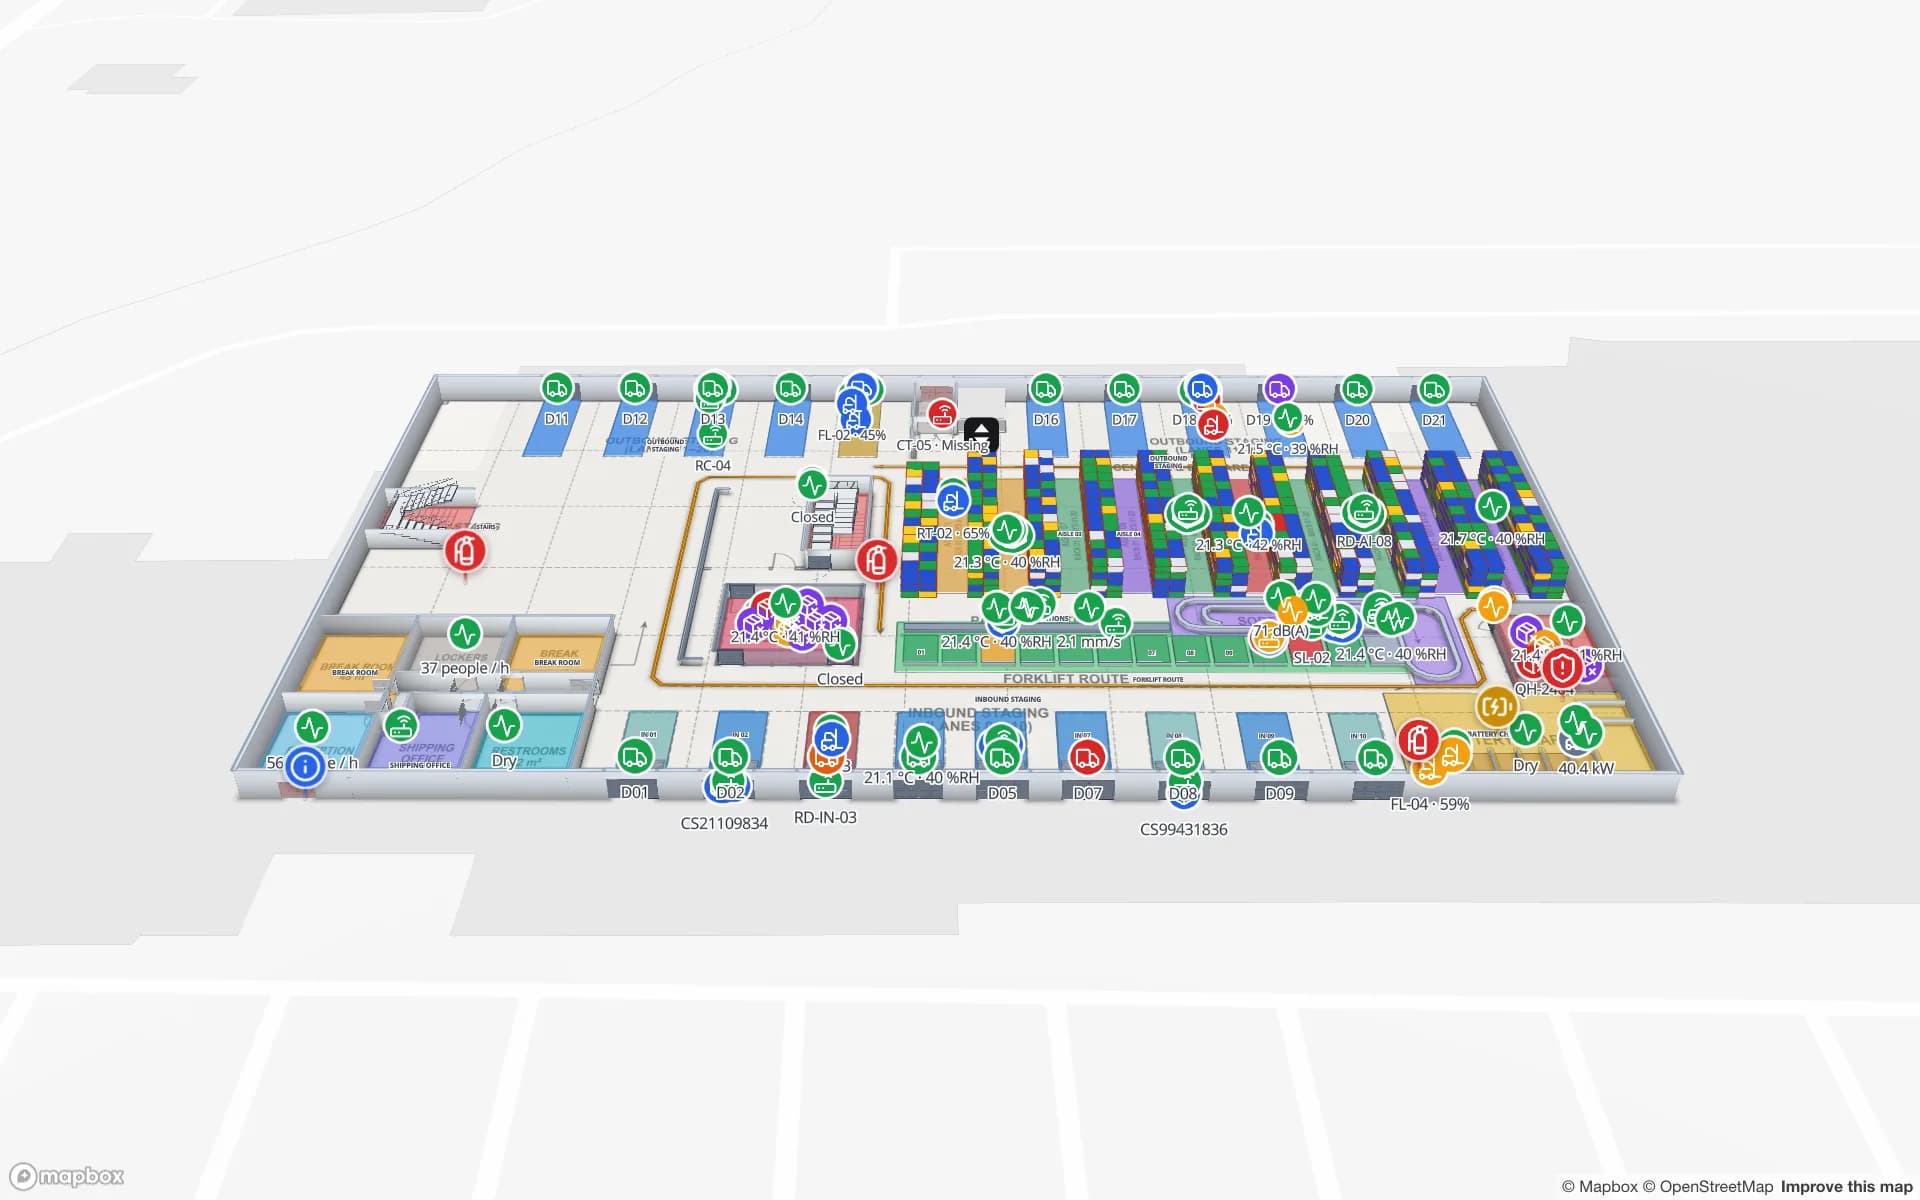
Spatial Map maps a cargo shed the same way it maps a warehouse — build-up areas, cool rooms, docks and staging lanes — and shows tagged shipments, dollies and equipment as live markers from your RTLS engine or RFID middleware. The Eastport Cross-Dock demo shows the time-critical side: 50 dock doors, 1,180 RFID pallets and short loads before cut-off on one map.

Distribution centres between Paris, the Ruhr and the Randstad

Belgium sits between some of Europe’s largest consumer markets, and many manufacturers and retailers run European distribution centres in Flanders — along the Antwerp–Brussels axis and in Limburg — and in Wallonia around Liège and Charleroi. These buildings often serve several countries and several clients at once.

Spatial Map shows such a distribution centre as one live map: rack locations coloured by stock from your WMS, RFID cartons followed from receiving to the dock, packing and staging areas in context. The Crestline Fulfillment demo has 2,204 rack locations. Read-only share links let each client see only their floors and layers, with an expiry date and no account needed.

Three languages, one map

Belgium has three official languages: Dutch, French and German. The Spatial Map interface is available in French and German — useful in Wallonia, Brussels and the German-speaking Community in the east — but not yet in Dutch; Flemish teams typically use it in English. Each user picks their own language, so a French-speaking QA team and an English-speaking warehouse team can work on the same facility, and room names, rack codes and report titles stay in whatever language you type them.

Under the GDPR, location data that can be linked to employees is personal data, and in Belgian workplaces employee representatives may also have a say before monitoring tools are introduced; your legal advisers decide what applies. Most pharma and logistics projects tag pallets, IBCs and equipment rather than people. A data processing agreement is available and the security page explains how data is protected. Our team works with Belgian customers remotely, by video call and through the contact form, and quotes larger rollouts as a fixed-price custom service in French, German or English.

How Spatial Map does it

From site plan to live cold-store map

  1. 01

    Import the plan

    Upload a PDF (scale read from standard sheet sizes) or a DWG from AutoCAD R2004–R2018 and place it at scale.

  2. 02

    Draw zones, racks and docks

    Trace cold rooms, freezers, quarantine areas, racks with locations and reefer docks.

  3. 03

    Connect probes, RFID and WMS

    Your monitoring system or middleware posts rows to a table, or Spatial Map polls its REST endpoint.

  4. 04

    Review and export

    Live state, history playback and reports in PDF or Excel for QA reviews and shift handovers.

What Belgian teams use it for

Pharma and vaccine cold stores

Temperature zones, doors, quarantine and QC release on one map.

Port-side and chemical warehouses

Compartments, racks and dock doors coloured by stock and status.

Air cargo and cross-docks

Shipments, docks and staging lanes against the departure time.

Returnable IBCs, roll cages and dollies

Tagged returnables as live markers, with row history per item.

Plant supply and finished goods

Raw materials, WIP and finished goods from the line to the dock.

See it on real demo facilities

Fictional names, real floor plans, live sensors, RFID, BLE tags and gateways — open any of them in the browser.

All 13 demo facilities

Questions from Belgian teams

Not yet. The app is available in French and German — two of Belgium’s official languages — as well as English, Spanish, Arabic and Chinese. Flemish teams typically use it in English, and room names, rack codes and report titles can be in Dutch.

No. Spatial Map shows live temperatures, door states, quarantine and held stock on the map, keeps row history and exports reports; your quality system, procedures and batch records remain the record.

Yes. Your monitoring system or IoT gateway posts readings to a table with the write API, or exposes a REST endpoint that Spatial Map polls on a schedule. Rooms are coloured by style rules on the value, and recent changes can be replayed. Spatial Map does not send notifications; your monitoring system keeps that role.

Yes. Read-only share links show only the layers and floors you choose, with an expiry date and a view cap, and can be revoked at any time. The client needs no account.

No. Spatial Map is sold online and our team works with customers remotely, by video call and through the contact form, in French, German or English.

The same worldwide, in US dollars: a 7-day free trial for up to 5 facilities, then Pro at $60 a month or $600 a year for up to 4 facilities. Larger estates are quoted as custom services.

Map your first Belgian site this week.

Start the free trial in French, German or English, or send us a site plan and a sample of your probe or WMS data through the contact form.