Savannah · Garden City Terminal, Pooler, Rincon and the I-16/I-95 corridor

RFID tracking in Savannah, from the container terminal to the import distribution center

Spatial Map puts RFID reads on a live 3D map of the building where they happen, so a tag at a dock door becomes a pallet in a lane, a carton in a rack or a case in a cold room. RFID tracking in Savannah starts with containers: they come off ships at the Georgia Ports Authority’s Garden City Terminal and are unloaded within a short drive, in distribution centers where the hard question is what was in the box and where it went. Your readers and middleware do the reading; Spatial Map shows each read in place.

No credit card. Runs in the browser. Pro is $60/month for up to 4 facilities. Book a demo

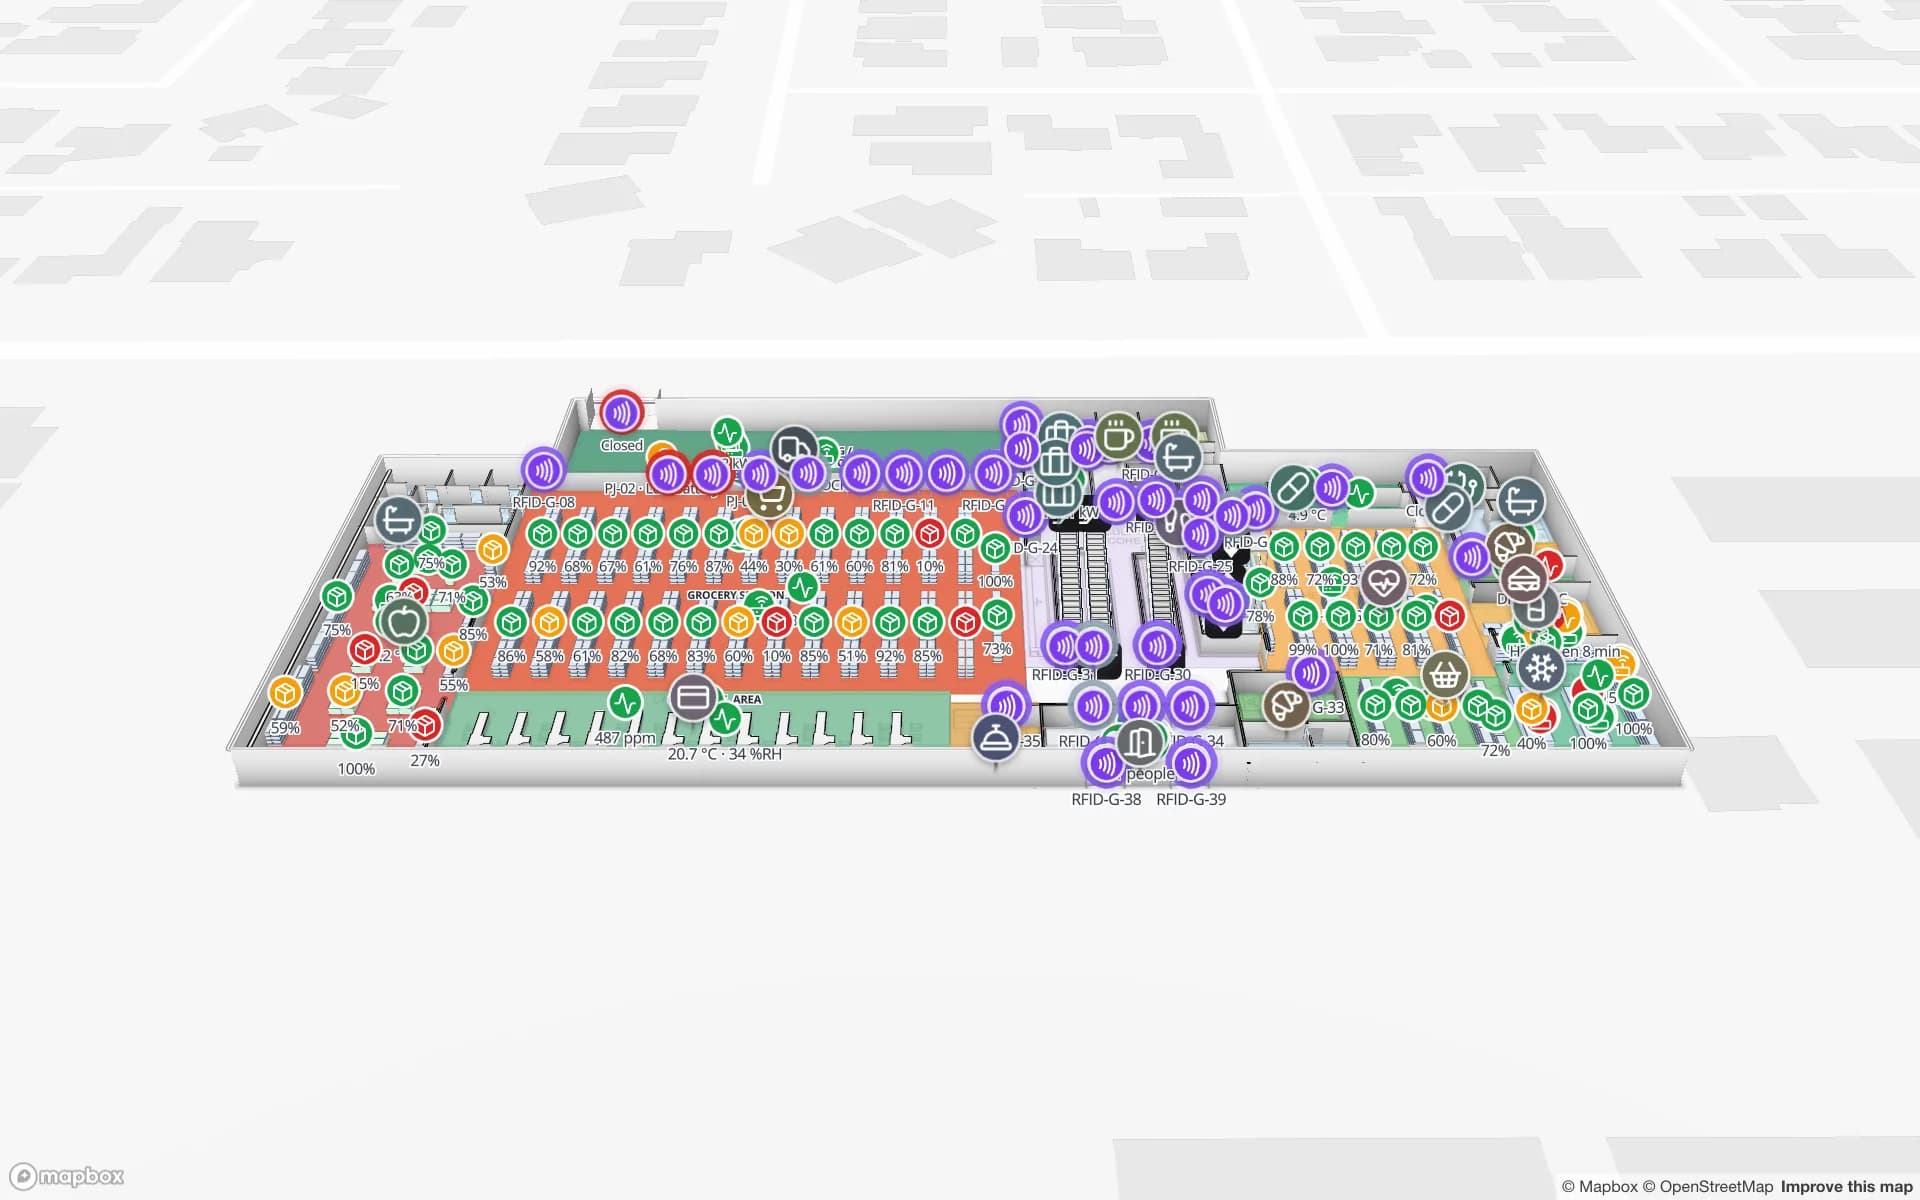
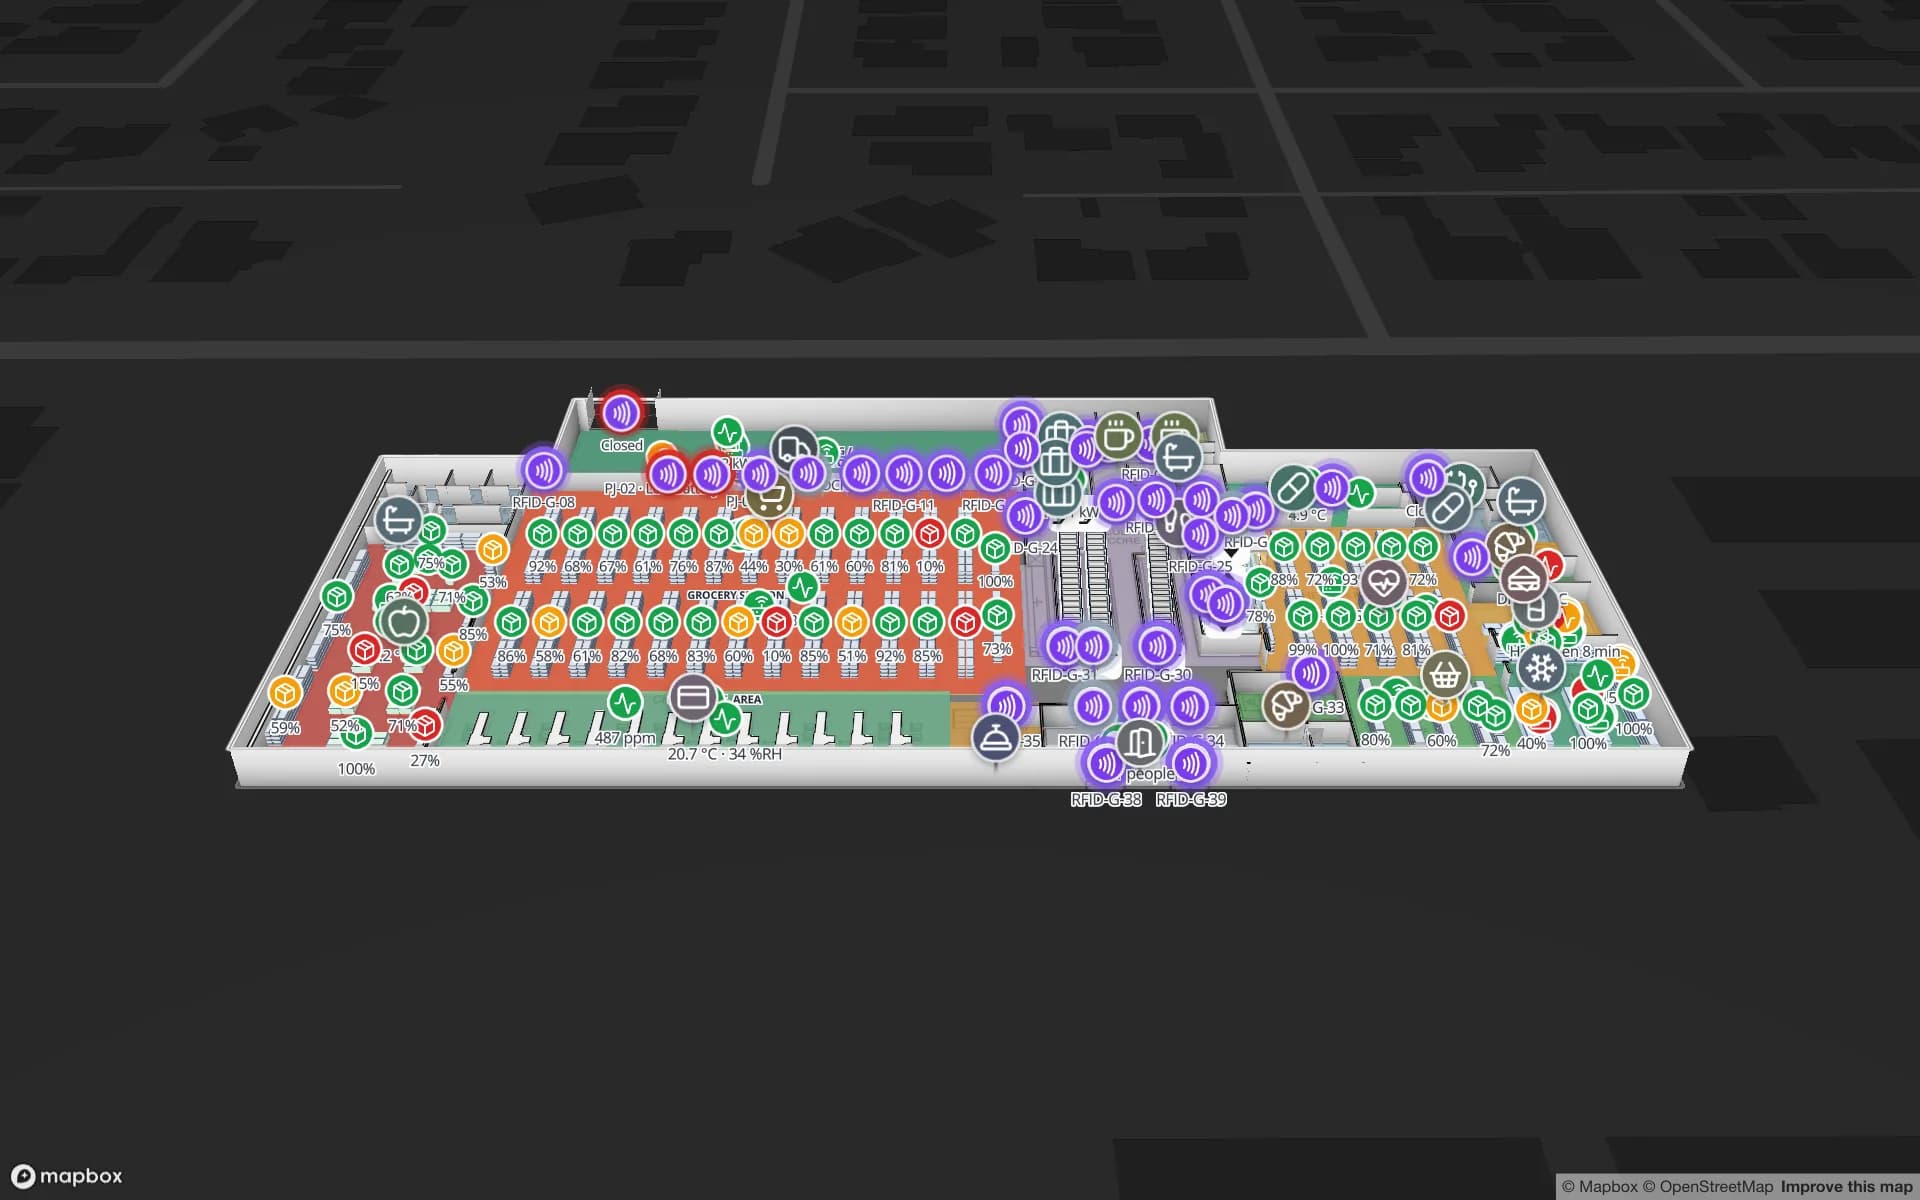
Crestline Fulfillment Center, a fulfillment center demo, in the Spatial Map 3D viewer with live device markers
Crestline Fulfillment Center
Crestline Fulfillment Center, a demo fulfillment center: 2,204 rack locations, staging lanes in front of the dock doors, forklifts and the trailer yard.
Rack locations in the Crestline demo
2,204
Racks coloured by stock status in Crestline
20
How often alert rules are checked, with alerts shown in the app
15 s
Free trial, up to 5 facilities, no card
7 days

A very large terminal with an on-terminal rail yard

The Georgia Ports Authority describes Garden City Terminal as “the largest single-operator terminal in the nation at 1,345 acres”. Its Mason Mega Rail yard covers 85 acres and is described as the largest on-terminal intermodal facility in North America, working 42 trains per week, with two Class I railroads serving it. Trucks reach the terminal directly from I-16 and I-95, and a state-built connector gives them a faster way in.

All of that is the port’s side of the fence. Spatial Map does not connect to terminal, customs or railroad systems and does not read containers on the terminal. It begins at the gate of your own building, where a box becomes pallets and cartons, and that is where item-level RFID earns its keep.


Inside the import distribution center

Import warehousing around Savannah clusters on the roads leading from the port; the Port Authority has described warehouse space in Pooler less than 10 miles from the terminal. A typical day is unloading containers, comparing what arrived to the advance shipping notice, putting pallets away and building outbound loads.

RFID makes that comparison automatic where cartons are tagged at the source. Readers at the inbound door post each tag read to a table, your system compares them with the advance notice, and the map shows which expected cartons arrived, which lane the pallet is in and which rack it was put away to. The Crestline demo shows 20 racks and 2,204 rack locations coloured by stock status. Tag reading at a dock door and the RFID inventory management page describe how to place readers.

Metal boxes, mixed pallets and read rates

A container is a steel box, and what comes out of it is mixed: cartons of different materials, liquids, metal fittings and packaging that reflects or absorbs radio waves. Read rates are decided by tag choice, placement and antenna layout, not by software, so test your own cartons before you roll out. The posts on RFID tags for metal, liquids and apparel and on missed tags and read rates list what to check.

What the map adds is visibility into the reads themselves: a heatmap of reads by door shows which portal is weakest, and an alert rule set to “not updated for N minutes” raises an in-app alert when a reader stops reporting. Spatial Map never computes positions from signal strength; it shows the reads your readers report.

Near-port cold storage

In September 2025 the Port Authority said the region now has nearly 2.4 million square feet of near-port cold storage across a dozen facilities, and the terminal’s own inspection facility has 4,000 square feet of refrigerated space for chilled cargo. Imported food, produce and other chilled goods mean temperature readings next to the pallet data.

Put your sensor feeds on the same plan: cold rooms coloured by live temperature, door sensors and held pallets marked in place. See temperature monitoring and the Polar Pharma demo, which shows 1,140 rack locations with temperature zones. Spatial Map is not a certified logger and makes no compliance claim.

Services for teams in Savannah

Savannah teams usually start from the inbound door:

  • Import distribution centers and transload warehouses start with inventory tracking at the dock doors, then item-level RFID where cartons are tagged.
  • Yards and terminals add asset tracking for chassis, yard tractors and returnable pallets.
  • RTLS and UWB fits big, busy buildings where forklifts and people must be located continuously; it is rarely the first step.
  • If you have no readers or tags yet, our team can source RFID readers, antennas and tags on request, quoted per project, with warranty and device support from the manufacturer: see RFID readers and tags and demo kits.
  • Where your IT team is stretched, we build RFID handheld apps and WMS or ERP integrations as client projects. The product runs as cloud or on-premises.

Also served nearby

The same page covers Pooler, Rincon, Port Wentworth, Garden City and Richmond Hill. Nothing needs to be installed at any of them: the map opens in a browser.

How Spatial Map does it

From the inbound door to the rack

  1. 01

    Pick one building

    The import distribution center where a short or mis-sent carton costs the most.

  2. 02

    Map doors, lanes and racks

    Upload the plan or a photo, let AI Map draft the floor, and name read points as your middleware names them.

  3. 03

    Connect reads and notices

    RFID middleware and your WMS post rows through the table write API, a polled REST endpoint or CSV and Excel uploads.

  4. 04

    Add door and silence rules

    In-app alerts for cartons staged too long and readers that stopped reporting.

What Savannah teams track

Import receiving

Cartons read at the inbound door, compared with what was expected, and shown by lane and rack.

Container yards and cross-docks

Dock doors, yard slots and pallets staged for the right outbound trailer.

Chilled and frozen imports

Temperature zones, doors and held pallets in a cold store.

Retail replenishment

Item-level stock for stores that the distribution center feeds.

See it on real demo facilities

Fictional names, real floor plans, live sensors, RFID, BLE tags and gateways — open any of them in the browser.

All 13 demo facilities

RFID tracking in Savannah — questions we get

No. It has no link to terminal, customs or railroad systems. It shows what happens inside your own building, from your own RFID reads, WMS or ERP and sensors.

That depends on the tags, where they are placed and the reader layout, so test your own cartons and ask your hardware vendor. Spatial Map does not make hardware; it shows reads in place and an in-app alert when a reader goes quiet.

Your system does the comparison, from your advance notice and the RFID reads, and posts the result as a column such as received, short or over. The map colours the pallet or rack by that column. Spatial Map does not write back to your WMS or ERP.

Yes. Temperature sensors and door sensors post rows to a table, and the rooms are coloured by the latest value; the History player replays what happened. It is a map of your sensor data, not a certified logger.

No. Spatial Map is sold online and our team works with customers in the United States remotely, by video call and through the contact form. There are no local resellers or partners.

In US dollars, the same worldwide: a 7-day free trial for up to 5 facilities with no card, then Pro at $60 a month or $600 a year for up to 4 facilities. RFID hardware, if you ask us to source it, is quoted per project and is not part of the subscription.

Map one Savannah receiving dock this week.

Start the free trial and open the Crestline demo, or send us the plan of an import distribution center and a sample of your RFID reads through the contact form.