Monterrey · Industrial parks, Interpuerto and the Colombia bridge

Asset tracking in Monterrey, from plant tooling to the trailer at the border

Spatial Map shows where tagged equipment, tooling and returnable containers are on a live 3D map of each building, using the reads and positions your RFID and BLE systems already produce. Asset tracking in Monterrey spans more than one kind of yard: plants in the industrial parks around the city, an inland port to the north, and trailers heading for the only Nuevo León crossing into Texas. Each is its own facility, and all of them can sit in one workspace, in Spanish or English.

No credit card. Runs in the browser. Pro is $60/month for up to 4 facilities. Book a demo

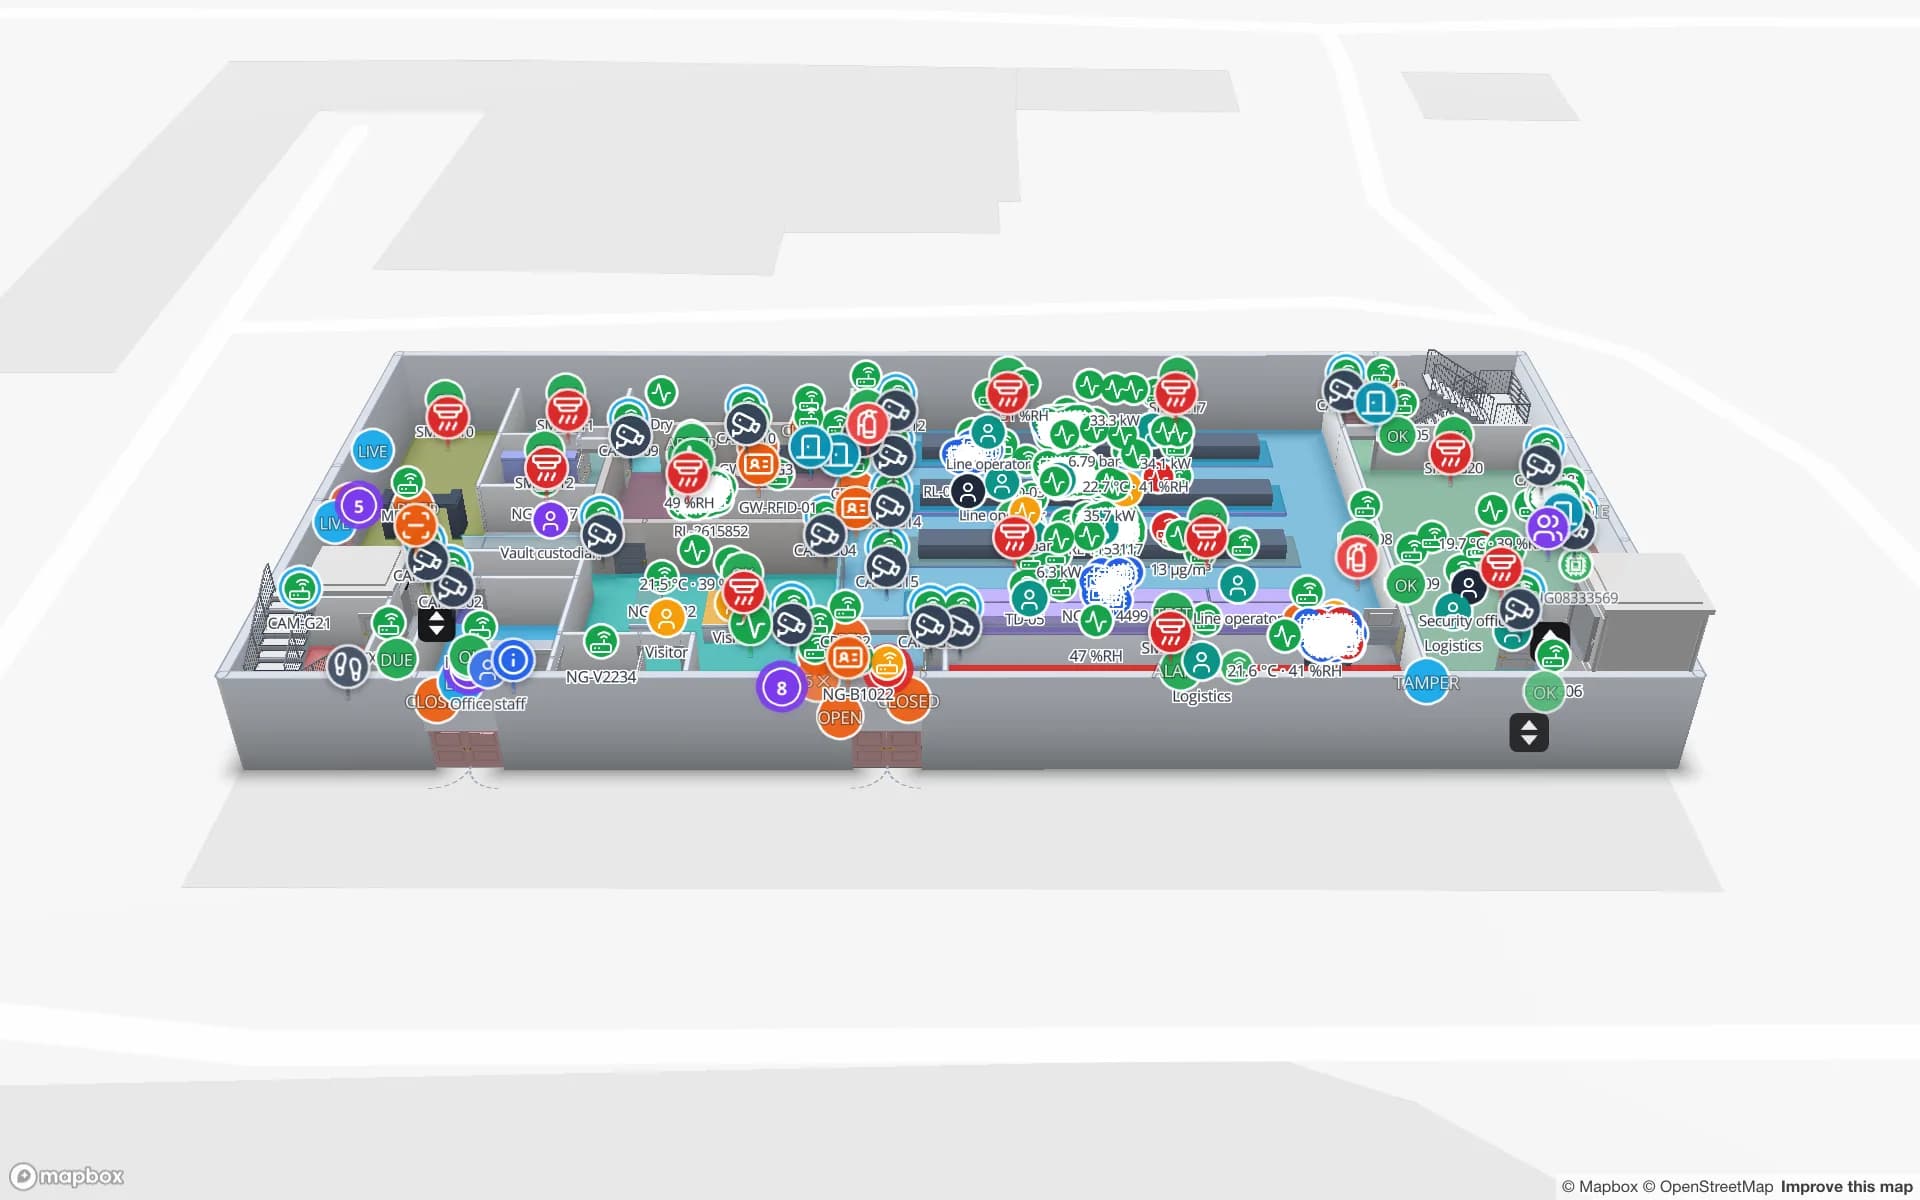
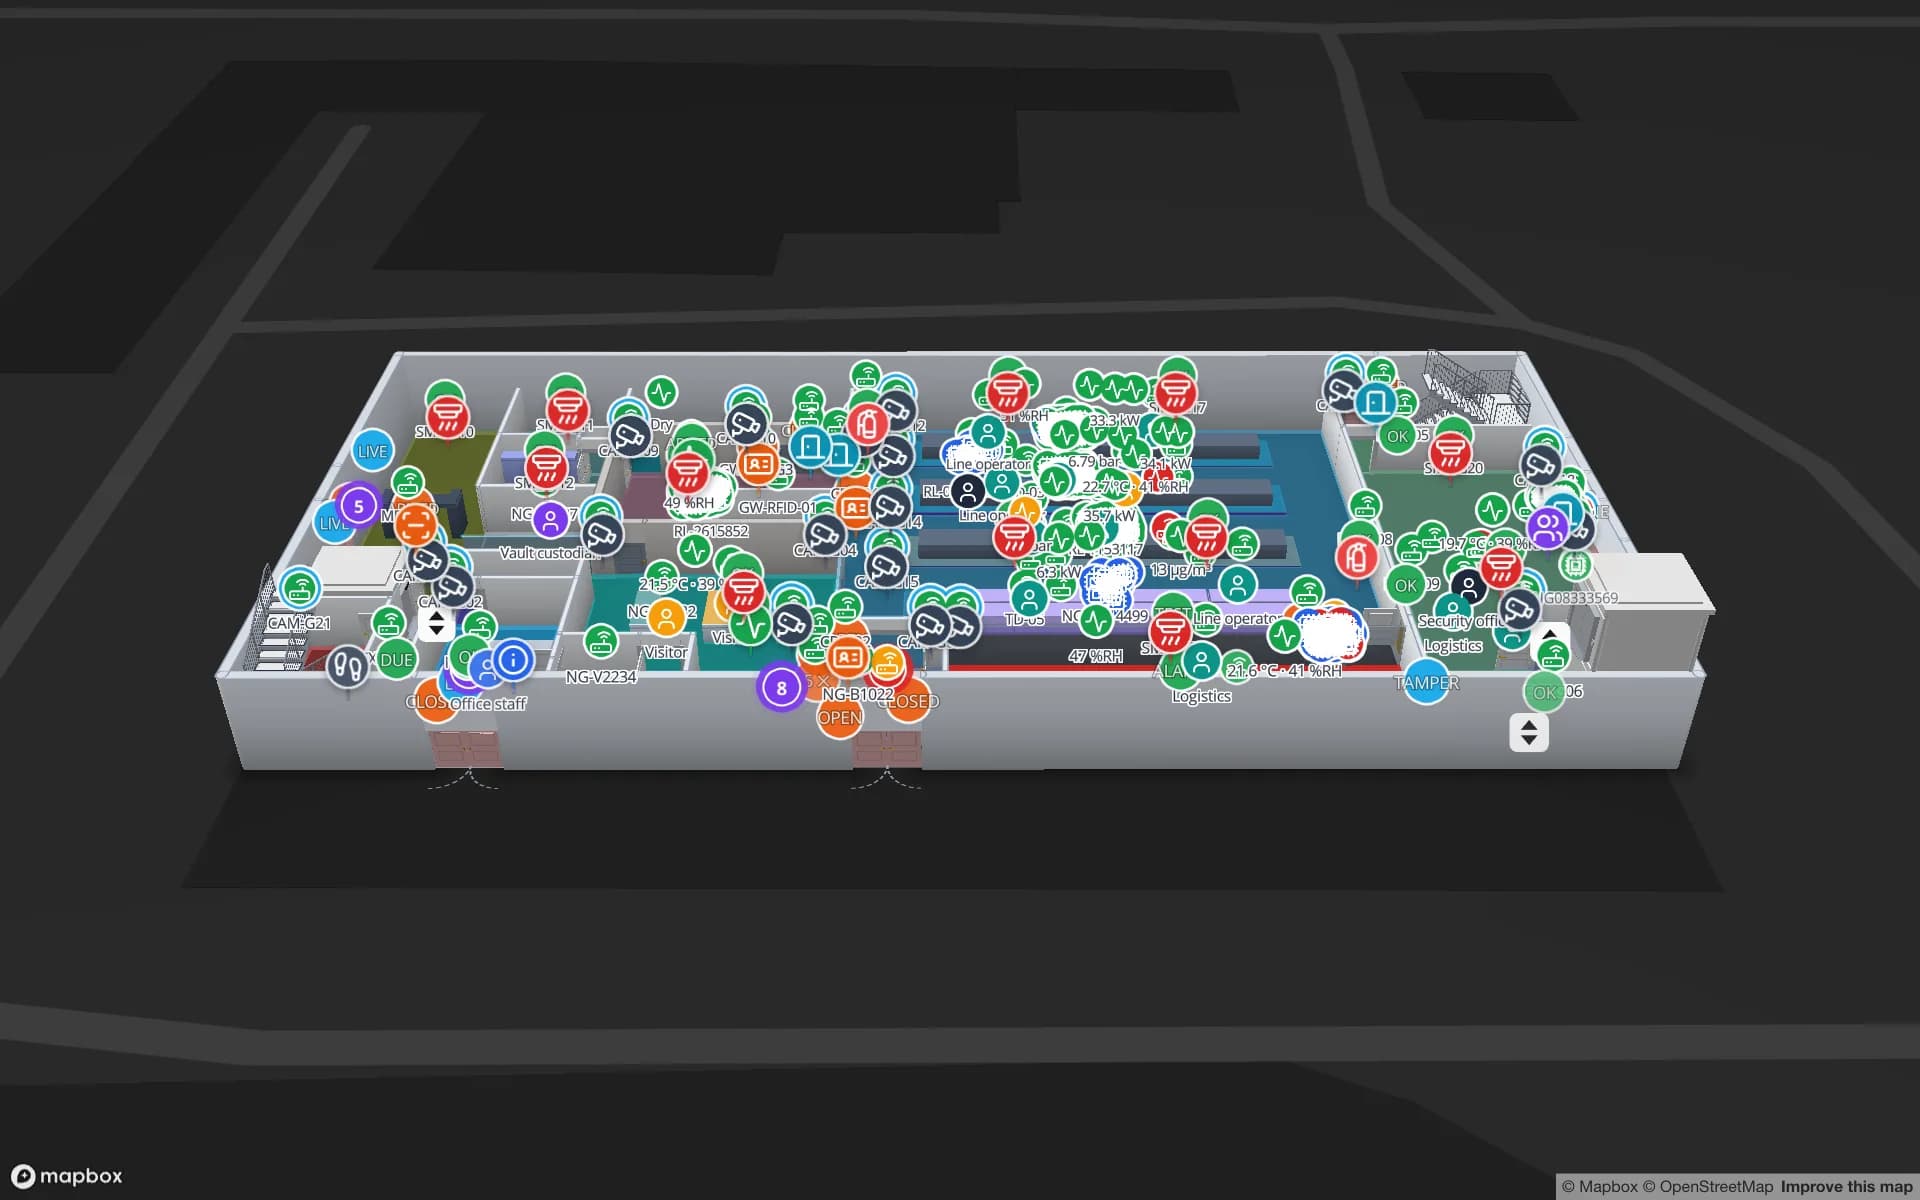
Summit Assembly Plant, a assembly plant demo, in the Spatial Map 3D viewer with live device markers
Summit Assembly Plant
Summit Assembly Plant, a demo plant: assembly lines, workstations, WIP carriers read by RFID between stations, and forklifts and tools located on the shop floor.
Rack locations in the Summit assembly-plant demo
867
Yard slots in the Eastport cross-dock demo
44
How often alert rules are checked, with alerts shown in the app
15 s
Free trial, up to 5 facilities, no card
7 days

More than 250 industrial parks, and the equipment inside them

A Nuevo León state bulletin from February 2025 counted more than 250 industrial parks across 15 municipalities and named Apodaca, Ciénega de Flores, Escobedo, Guadalupe, Santa Catarina and Pesquería as the municipalities with the most demand. A plant in one of those parks rarely loses a whole pallet. It loses a mould, a die, a gauge, a returnable rack or a battery cart that three shifts share, and which moves between line, store, workshop and an outside supplier. The cost of “where is it?” is a stopped line.

Spatial Map keeps the asset register as a table — tag ID, owner, home store, status — and draws the plant so each store, workshop and line is an area. BLE tags with gateways named after those areas, or RFID tags read at the tool-crib door, tell your system where each item is. The map shows its last-seen area, a style rule colours items overdue for return, and the History player replays where it has been. RFID tool tracking covers the crib pattern, and the Summit demo shows lines, workstations and 867 rack locations on one plant map. A customer who supplies the parts can get a read-only share link to see the floor, with no account.


Steel city: old plants, new additions

Monterrey’s industrial identity predates nearshoring. The Fundidora de Fierro y Acero de Monterrey was founded in 1900, was declared bankrupt on 10 May 1986, and its site opened on 24 February 2001 as Parque Fundidora, an industrial-archaeology park that keeps 155 historic pieces of the works. Older plants in a heavy-industry city like this often have a similar history: buildings extended in decades of additions, with a best drawing that may be a scan or a CAD file nobody has opened in years.

Upload what you have — PDF, DWG (AutoCAD R2004–R2018, placed as a picture) or a photographed plan — align it at real size and let AI Map draft walls, doors, racks and areas for a person to review. AI Map is available on paid plans and the trial, with a monthly limit. Then add tags where they pay back first: forklifts, tool carts and returnable racks. Real-time indoor asset tracking walks through the options.

Interpuerto Monterrey: an inland port with its own customs section

Interpuerto Monterrey lies in Salinas Victoria, north of the city. The tax service inaugurated a customs section there on World Customs Day in January 2019, describing the project as “a logistics and manufacturing pole” that gives companies access to the US market, with road and rail export and import operations. For a plant or a forwarder with a building in an inland port, the daily problem is the trailer and the container: which one is in which yard slot, which is loaded, which is waiting for a customs release.

Draw the yard slots, gates and dock doors, give each trailer or container a row in a table from your yard system, and the map colours slots by status. RFID or BLE tags on trailers and chassis show where they last were, and an alert rule such as “in the yard longer than N minutes” appears in the app with Show on map. The Eastport Cross-Dock demo shows 44 yard slots, 50 dock doors and 1,180 RFID pallets, with the gate and weighbridge. Customs status stays in your own systems; Spatial Map makes no compliance claim and does not connect to customs.

The Colombia bridge and the road to Laredo

Nuevo León’s only crossing into Texas is the Colombia–Solidarity International Bridge, part of the Port Laredo complex alongside the World Trade Bridge; it takes trucks when its neighbour is blocked or closed. The state government announced in October 2024 that it was pushing two more border bridges at the Colombia crossing, and truck counts quoted for the existing bridge differ so widely between sources that no single figure is safe to repeat.

What every carrier and plant on that road has in common is a trailer on the wrong side of a border queue. A map that shows each trailer and chassis as an asset, its home yard and its last read, and a view of the yard slots at both ends, answers “which of ours are where” without a phone call. A BlueIOT RTLS server connects directly for continuous positions inside a yard, and other engines connect through the write API; border waits themselves are not something Spatial Map reads.

The airport’s own logistics centre

Monterrey’s international airport operator describes a logistics centre, opened in 2017, for international cargo: 1,655 square metres of warehouse, 12 loading docks and a cross-dock model, connected to the customs section and the apron. A building of that size is a classic cross-dock, where inbound pallets are sorted to outbound loads within hours. RFID gates explain how a row of readers at a door becomes a read point on the map, and the cross-dock guide shows the yard view.

Services for teams in Monterrey

Where Monterrey teams usually start:

  • Plants in the industrial parks start with asset tracking for moulds, dies, racks and forklifts, then link it to inventory tracking for raw material and finished goods.
  • Forwarders and carriers around Interpuerto and the border begin with yard slots, trailers and RFID at the dock doors.
  • RTLS and UWB is for big plants and yards that must locate people and vehicles continuously; a BlueIOT server connects directly and other engines through the write API.
  • Tags, gateways and readers can be sourced on request, quoted per project, with warranty from the manufacturer: see hardware and demo kits on request.
  • Asset back offices, handheld apps and ERP integrations are built as client projects, for example an asset management system; the same page covers POS and booking systems. Run it as cloud or on-premises.

Also served nearby

The same page covers Apodaca, Santa Catarina, García, Escobedo, Pesquería, Ciénega de Flores and Salinas Victoria, and Saltillo and Ramos Arizpe over the state line in Coahuila. Nothing needs to be installed at any of them: the map opens in a browser.

How Spatial Map does it

Building a Monterrey asset map

  1. 01

    Load the asset register

    Upload a CSV or Excel list of moulds, racks, trailers and tools with tag IDs, owners and home locations as a table.

  2. 02

    Draw plant and yard

    Import the plan or a photo, let AI Map draft walls, doors and areas, then add stores, workshops and yard slots as areas.

  3. 03

    Connect tags and gateways

    RFID middleware and BLE gateways post rows through the write API, or Spatial Map polls a REST endpoint.

  4. 04

    Add overdue and silence rules

    In-app alerts for tooling past its return date, trailers parked too long and gateways that stopped reporting.

What Monterrey teams track

Plant tooling and returnable racks

Moulds, dies, racks and carts by store, line and supplier.

Trailers and chassis in inland-port and border yards

Yard slots, gates and dock doors by status.

Component stores for plant suppliers

Components by rack location and finished-goods staging.

High-value stock in secure stores

Vault and cage inventory, tools and BLE-tagged equipment by room.

See it on real demo facilities

Fictional names, real floor plans, live sensors, RFID, BLE tags and gateways — open any of them in the browser.

All 13 demo facilities

Asset tracking in Monterrey — questions we get

No. It has no link to customs, port or border-crossing systems and does not read wait times. It shows your own assets, from your own RFID, BLE or yard-system data, so it complements those systems rather than replacing them.

Yes. Upload the scan, DWG or photo and align it at real size. AI Map can draft walls, doors and racks from the picture, and you correct what it gets wrong. Our services team can also do the mapping remotely for a fixed price.

Yes. Give the supplier a read-only share link with the layers you choose, an expiry date and a view cap, so it sees its own items without an account. Four built-in roles and custom roles control who can edit.

Metal changes how RFID tags read, and BLE tags are often easier on large steel items, so test in your own plant first. See RFID tags for metal, liquids and apparel and BLE gateway asset tracking. Spatial Map has no reader drivers; your middleware posts reads to a table.

Yes. Keep each plant as a facility in one workspace and group them into named solutions, for example by customer or by site. Owner, Admin, Editor and Viewer roles control who can change what.

No. Spatial Map is sold online and our team works with customers in Mexico remotely, by video call and through the contact form. There are no local resellers or partners.

In US dollars, the same worldwide: a 7-day free trial for up to 5 facilities with no card, then Pro at $60 a month or $600 a year for up to 4 facilities. Tags, gateways and readers, if you ask us to source them, are quoted per project.

Map one Monterrey plant before the next audit.

Start the free trial in Spanish or English, or send us the plan of a plant or yard and an asset list through the contact form.