Adelaide · Wine and food exports, Port Adelaide and the airport

Inventory tracking in Adelaide: wine, produce and port stock, lot by lot

Spatial Map shows stock on a live 3D map of each building, rack by rack and room by room, from the WMS, RFID and sensor data you already have. Inventory tracking in Adelaide is mostly lot tracking: a vintage in tanks, barrels and pallets, a harvest of salad vegetables that has days to live, a container waiting at the port. Each building is one facility, and the map opens in a browser in the cellar, at head office or at a buyer’s desk.

No credit card. Runs in the browser. Pro is $60/month for up to 4 facilities. Book a demo

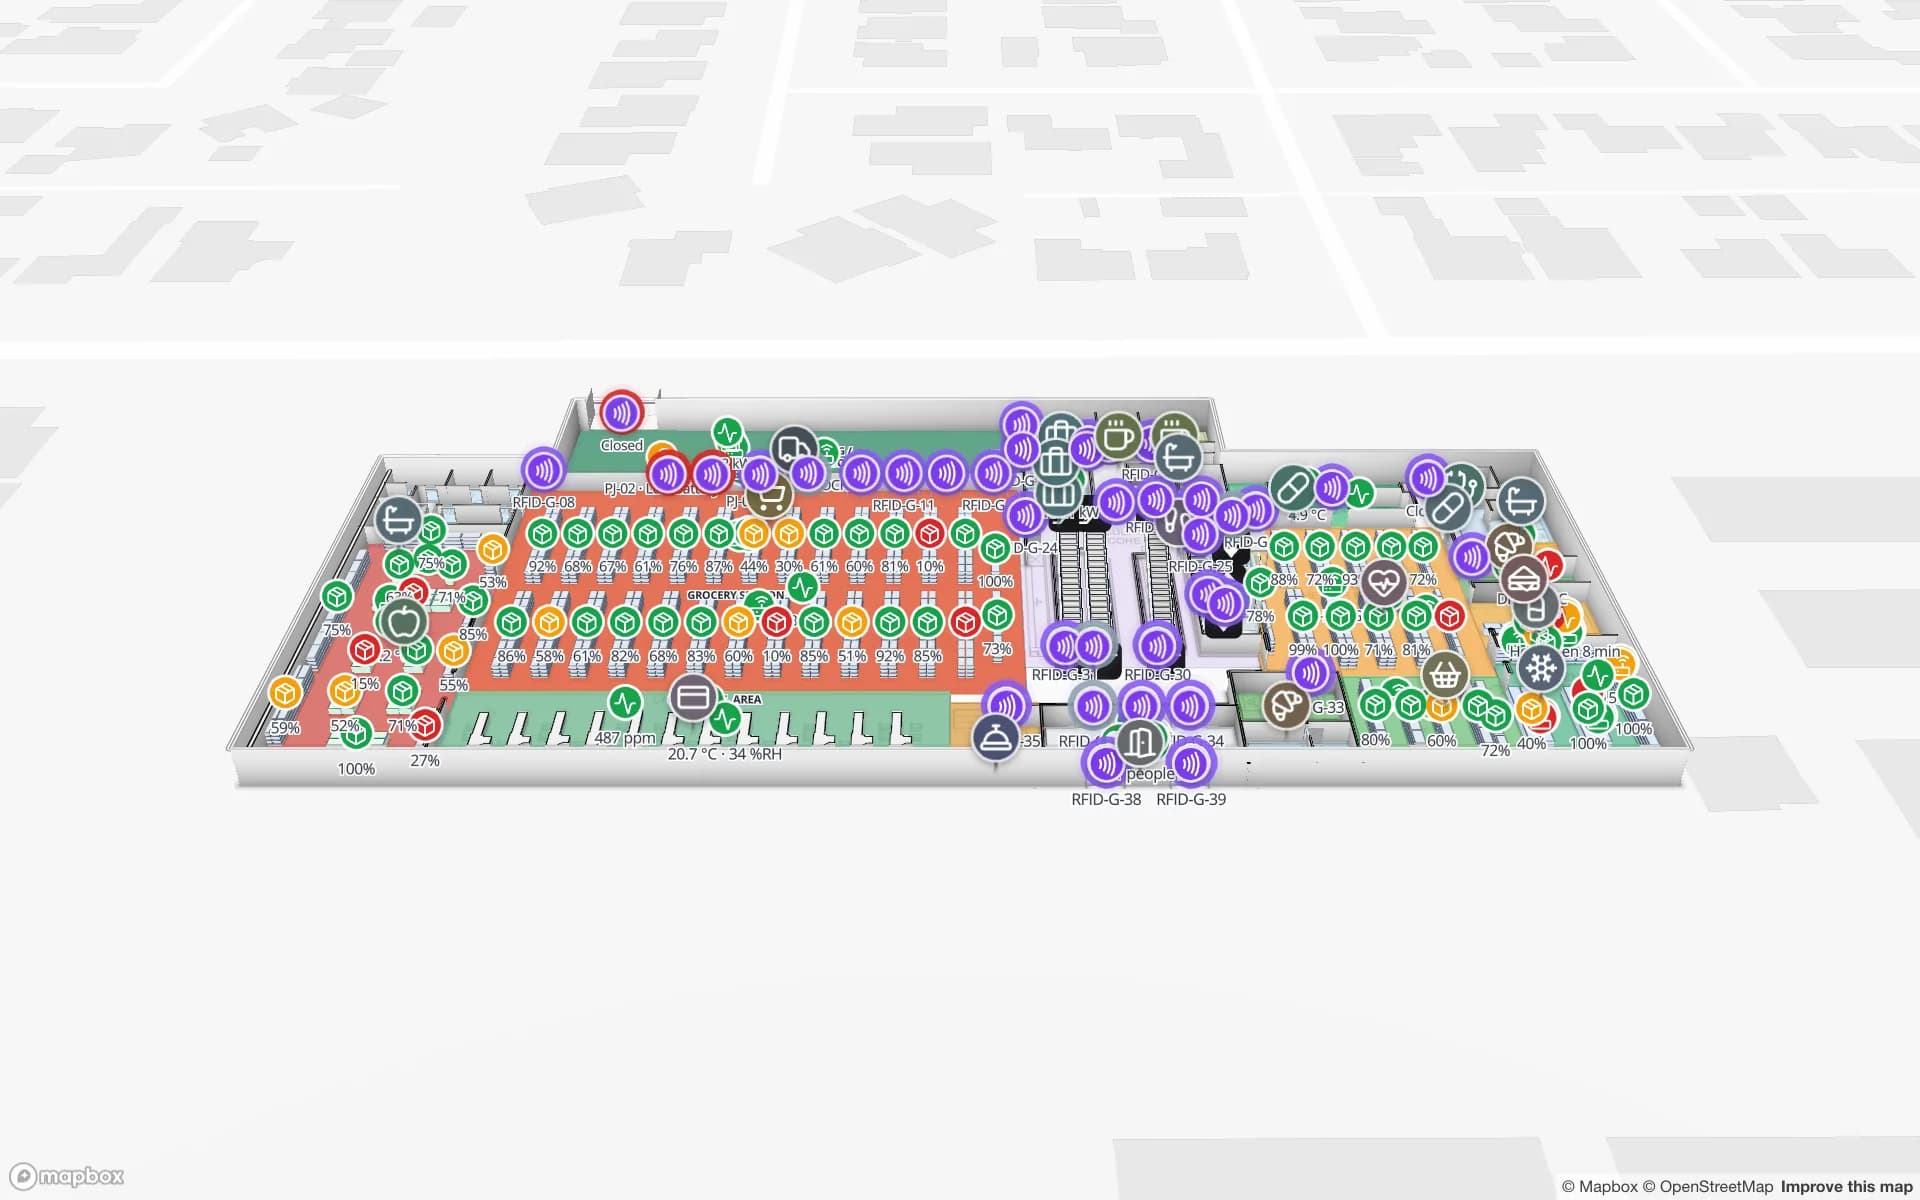
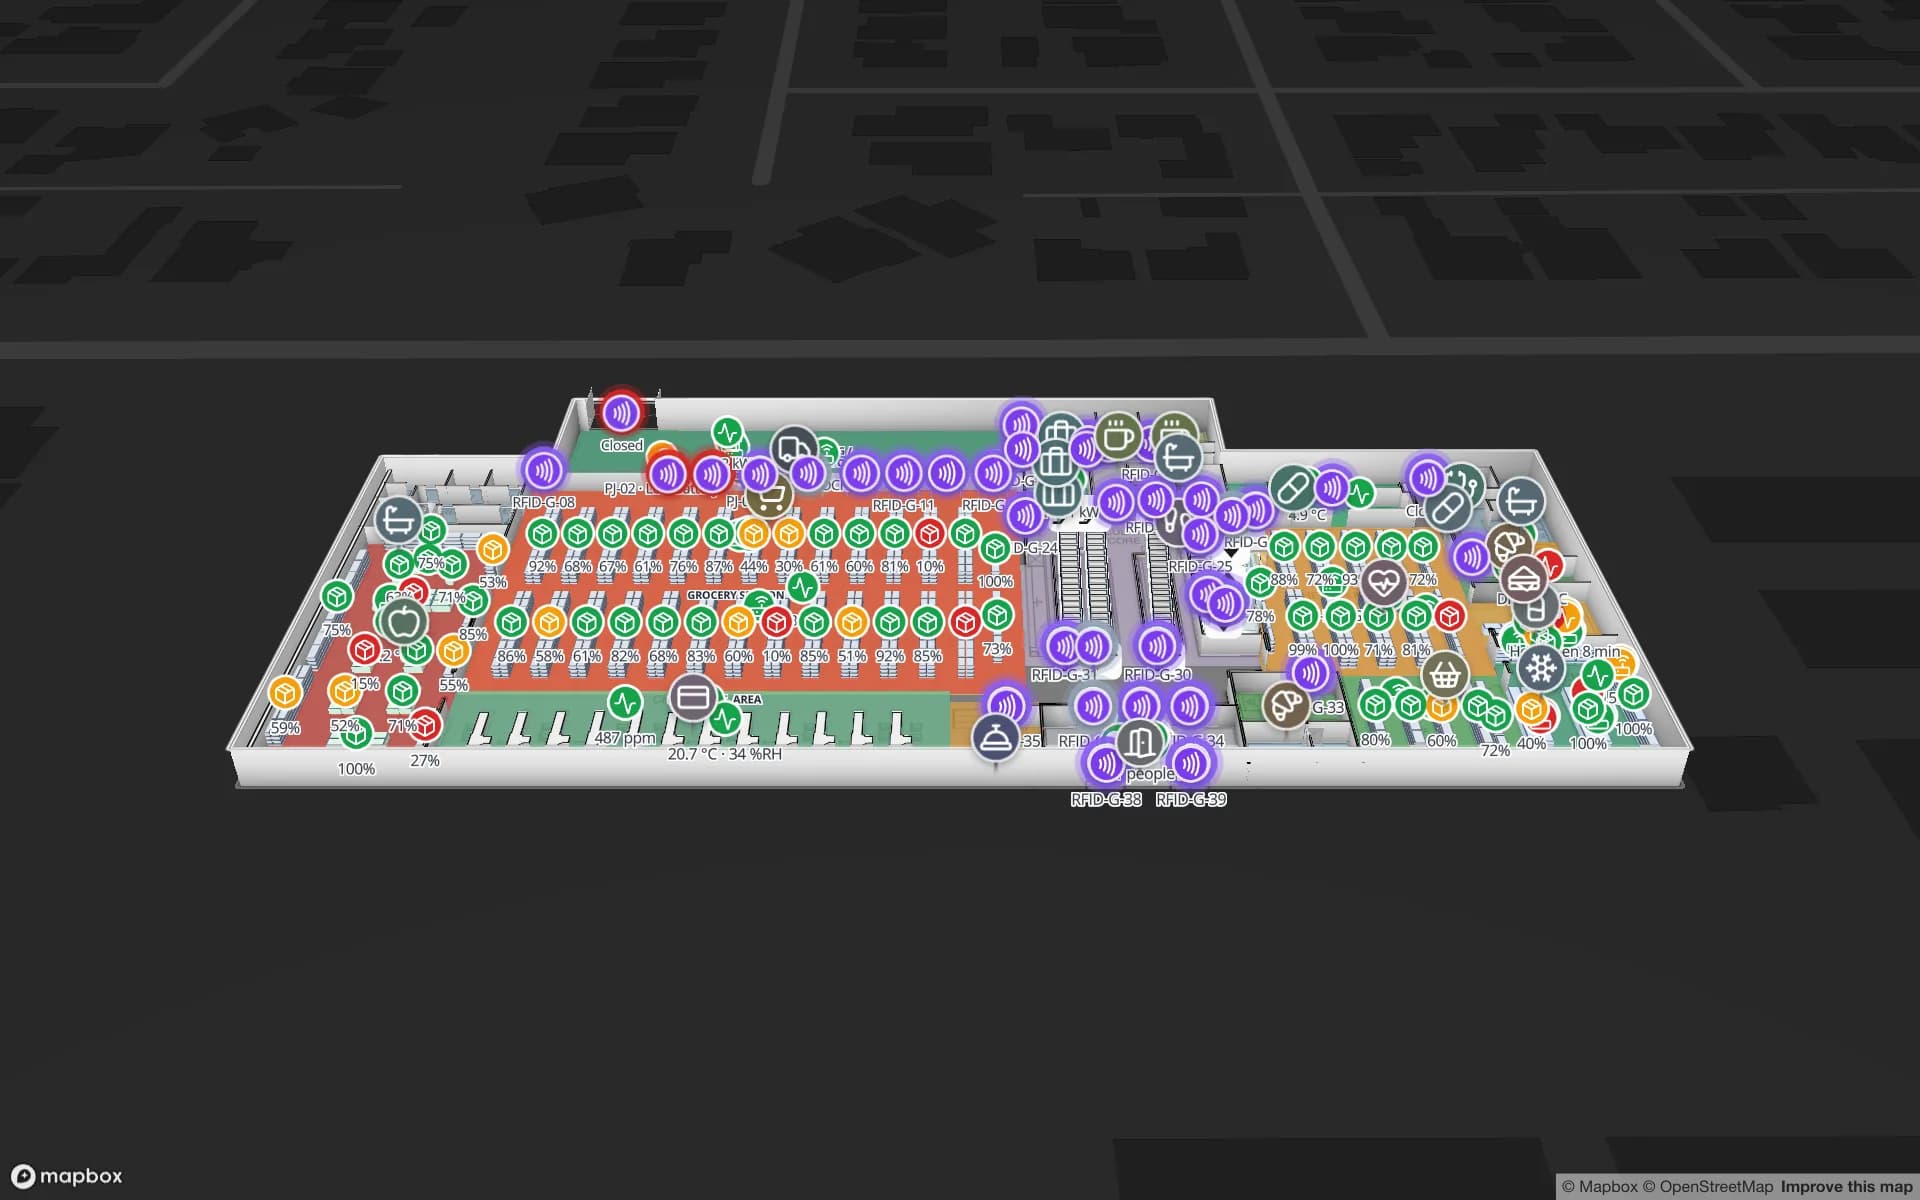
Polar Pharma — Cold Storage & QC Facility, a pharmaceutical cold store & qc lab demo, in the Spatial Map 3D viewer with live device markers
Polar Pharma — Cold Storage & QC Facility
Polar Pharma, a demo cold store: cold rooms, freezers and controlled-ambient storage coloured by live temperature, with doors and held pallets across 1,140 rack locations.
Rack locations in the Polar Pharma demo cold store
1,140
Rack locations in the Crestline demo warehouse
2,204
How often alert rules are checked, with alerts shown in the app
15 s
Free trial, up to 5 facilities, no card
7 days

South Australian wine: the lot is the unit

Wine Australia’s sector report estimates that South Australia accounted for 52 % of Australia’s vineyard area, in a 2019 vineyard scan. The state’s regions include the Barossa Valley, Eden Valley, McLaren Vale, the Adelaide Hills, the Clare Valley, Coonawarra and the Riverland, and a wine business in any of them keeps stock in several states at once: fruit, wine in tank, wine in barrel, bottled wine awaiting release, and pallets of finished goods.

Every one of those has a location and a lot. Put each tank farm, barrel hall and warehouse on the map, name rack locations the way your system does, and colour them from your stock table by lot, vintage or status. Barrels and pallets tagged with UHF RFID show up when they pass a read point; the CSV bin inventory to live rack map post shows the quickest start. Spatial Map is a location view over your records. Excise, duty and wine-label rules live in your systems and with your advisers, and it makes no claim about them.


Fresh produce: stock that expires

Reference works on South Australia list the Northern Adelaide Plains as a growing area for tomatoes, capsicums, cucumbers, brassicas, lettuce and carrots, around Virginia. Produce inventory is a first-expiry, first-out problem: a pallet that is in the wrong cool room for a day loses value that wine does not.

Colour racks by days to expiry from your stock table, read pallets at the door with RFID and tint each cool room by its probe readings, so a packer sees at a glance where the oldest pallets are and which room is drifting. The Polar Pharma demo shows cold rooms, freezers and controlled-ambient zones by temperature with doors and held pallets, and warehouse temperature mapping covers the sensors. An alert rule raises an in-app alert when a room stays out of range for N minutes; there is no email or SMS.

Port Adelaide: grain, vehicles and an old waterfront

Port Adelaide is South Australia’s main maritime gateway. Its operator lists grain and seeds, motor vehicles, limestone, petroleum products, metals, cement, fertilisers, iron ore and mineral sands among its cargoes, and set up a bulk minerals export precinct at Berth 29 in 2009. Behind the wharves, stores and depots hold the smaller flows: parts, packaging, returnable containers and equipment.

The waterfront is also old. The first wharf was finished in 1840, and part of the town centre was declared a State Heritage Area in May 1982. Older stores and sheds tend to have a drawing that no longer matches the building. Upload what exists (PDF, DWG placed as a picture, or a photo), align it and let AI Map draft racks, walls and doors for a person to review. The Eastport demo shows yard slots and pallets for a freight site, and RFID inventory management covers stock counts.

The airport: perishables and parcels by air

Adelaide Airport reported a record 1.24 million international passengers in 2025–26, and its freight statistics for 2025 list Singapore, Dubai and Doha as the busiest international freight routes. Air freight from a city like Adelaide often rides in the holds of passenger aircraft, which makes cut-off times, consolidation and a clean paper trail matter more than volume.

In a forwarder’s or exporter’s cool room, the questions are the same as at the port: which cartons are staged for which flight, which are still in the room, and which lot a short carton belongs to. A map with lanes named after flights or customers and RFID reads at the door answers them; the Crestline demo shows staging lanes and a trailer yard on 2,204 rack locations. Spatial Map does not connect to airline, customs or airport systems.

Services for teams in Adelaide

Adelaide teams tend to start with one building and one question:

Also served nearby

The same page covers Gepps Cross, Regency Park, Wingfield and Dry Creek, Salisbury, Virginia and the Northern Adelaide Plains, and the wine regions an hour or so from the city. A manager in Adelaide can open the same live map as the cellar team in the Barossa or McLaren Vale.

How Spatial Map does it

From the cellar plan to a live Adelaide map

  1. 01

    Pick one building

    A barrel hall, a packhouse cool room or a port-side store — wherever a missing lot costs most.

  2. 02

    Map racks and rooms

    Upload the plan or photo, let AI Map draft the floor, and name locations the way your system names them.

  3. 03

    Load the stock by lot

    A CSV or Excel upload, a table write API push or a polled REST endpoint carries lot, vintage, quantity and status.

  4. 04

    Add expiry and temperature rules

    In-app alerts for rooms out of range, stock near expiry and readers that stopped reporting.

What Adelaide teams track

Wine stock by lot and location

Racks and pallets coloured by lot, vintage or release status.

Cool rooms and packhouses

Rooms tinted by live temperature, with held pallets marked.

Port-side stores and yards

Dock doors, yard slots and pallets for the right load.

Supplier-to-shelf flow

Item-level stock by shelf and department in stores that sell the product.

See it on real demo facilities

Fictional names, real floor plans, live sensors, RFID, BLE tags and gateways — open any of them in the browser.

All 13 demo facilities

Inventory tracking in Adelaide — questions we get

It can show the location of whatever your records say, at each stage. Each tank farm, barrel hall and warehouse is a facility; the lot sits in a table row that your winery system pushes through the write API, an upload or a polled REST endpoint. Spatial Map does not run winemaking records or duty reporting.

It depends on the tag, the material and where the reader sits, so test with your own barrels and cartons. Liquids and metal change read ranges. The post on RFID tags for metal, liquids and apparel lists what to check.

Yes. A read-only share link can lock the floor, choose the layers and carry an expiry date and a view cap, so a buyer sees only the building and layers you choose.

No. It shows what happens inside your own building from your own data. It does not connect to port, customs, airline or airport systems, and it does not write back to your ERP or WMS.

No. Spatial Map is sold online and our team works with customers in Australia remotely, by video call and through the contact form. The product runs in the browser, so there is nothing to install on site.

In US dollars, the same worldwide: a 7-day free trial for up to 5 facilities with no card, then Pro at $60 a month or $600 a year for up to 4 facilities. Larger sites are quoted as custom services, and hardware is quoted per project.

Map one Adelaide cool room or cellar first.

Start the free trial and open the Polar Pharma demo, or send us a plan and a sample of your stock table through the contact form.