New York–New Jersey · Port Newark, Elizabeth and the Turnpike corridor

Warehouse tracking in New Jersey, from the port terminals to the last mile into the city

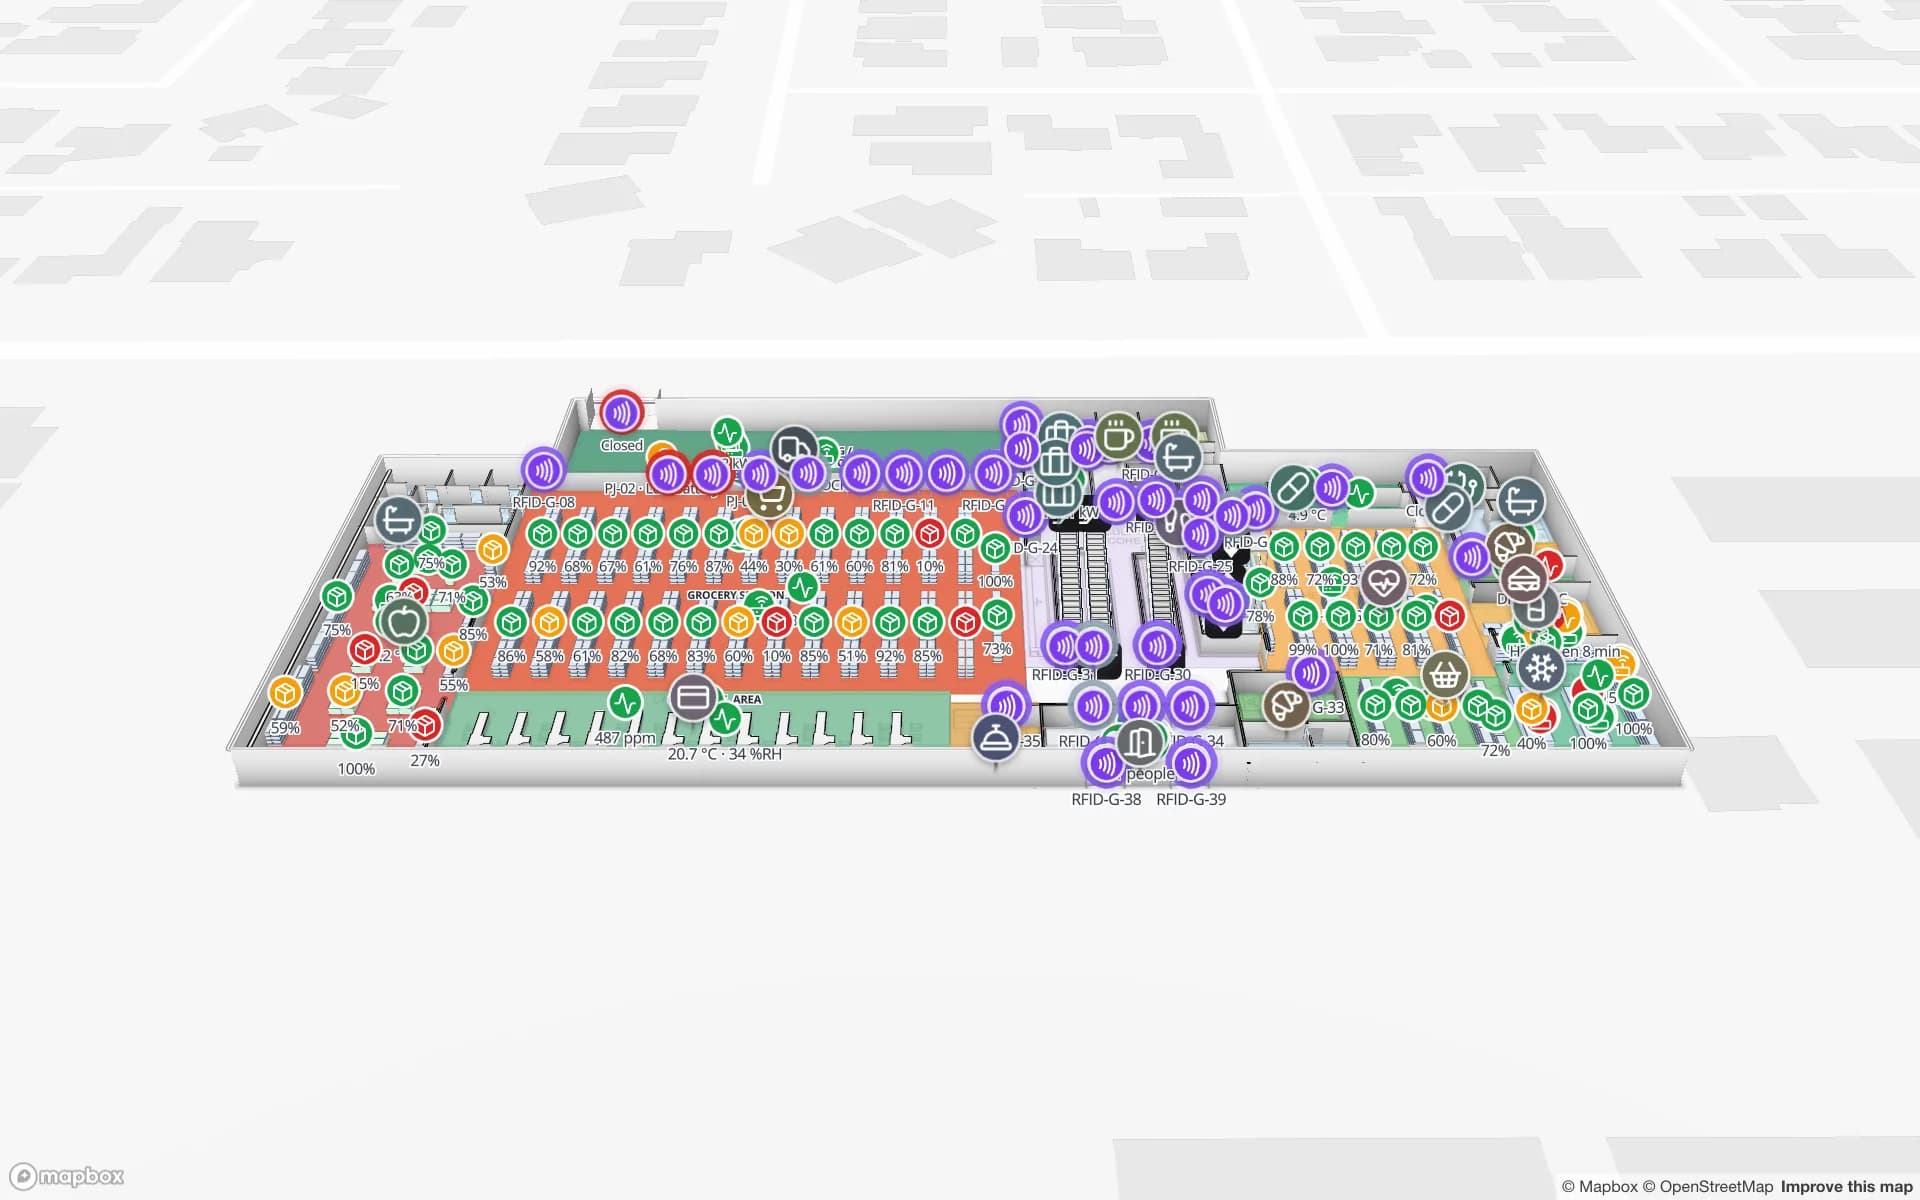
Spatial Map shows a warehouse live on a 3D map: racks colored by stock from your WMS, RFID reads at dock doors, trailers in the yard. Warehouse tracking in New Jersey starts at the harbor, where the Port of New York and New Jersey puts containers onto the Turnpike corridor, and it ends in small last-mile buildings that serve one of the densest consumer markets in the country. Your WMS, readers and sensors supply the data; Spatial Map puts it on the building where it happens.

No credit card. Runs in the browser. Pro is $60/month for up to 4 facilities. Book a demo

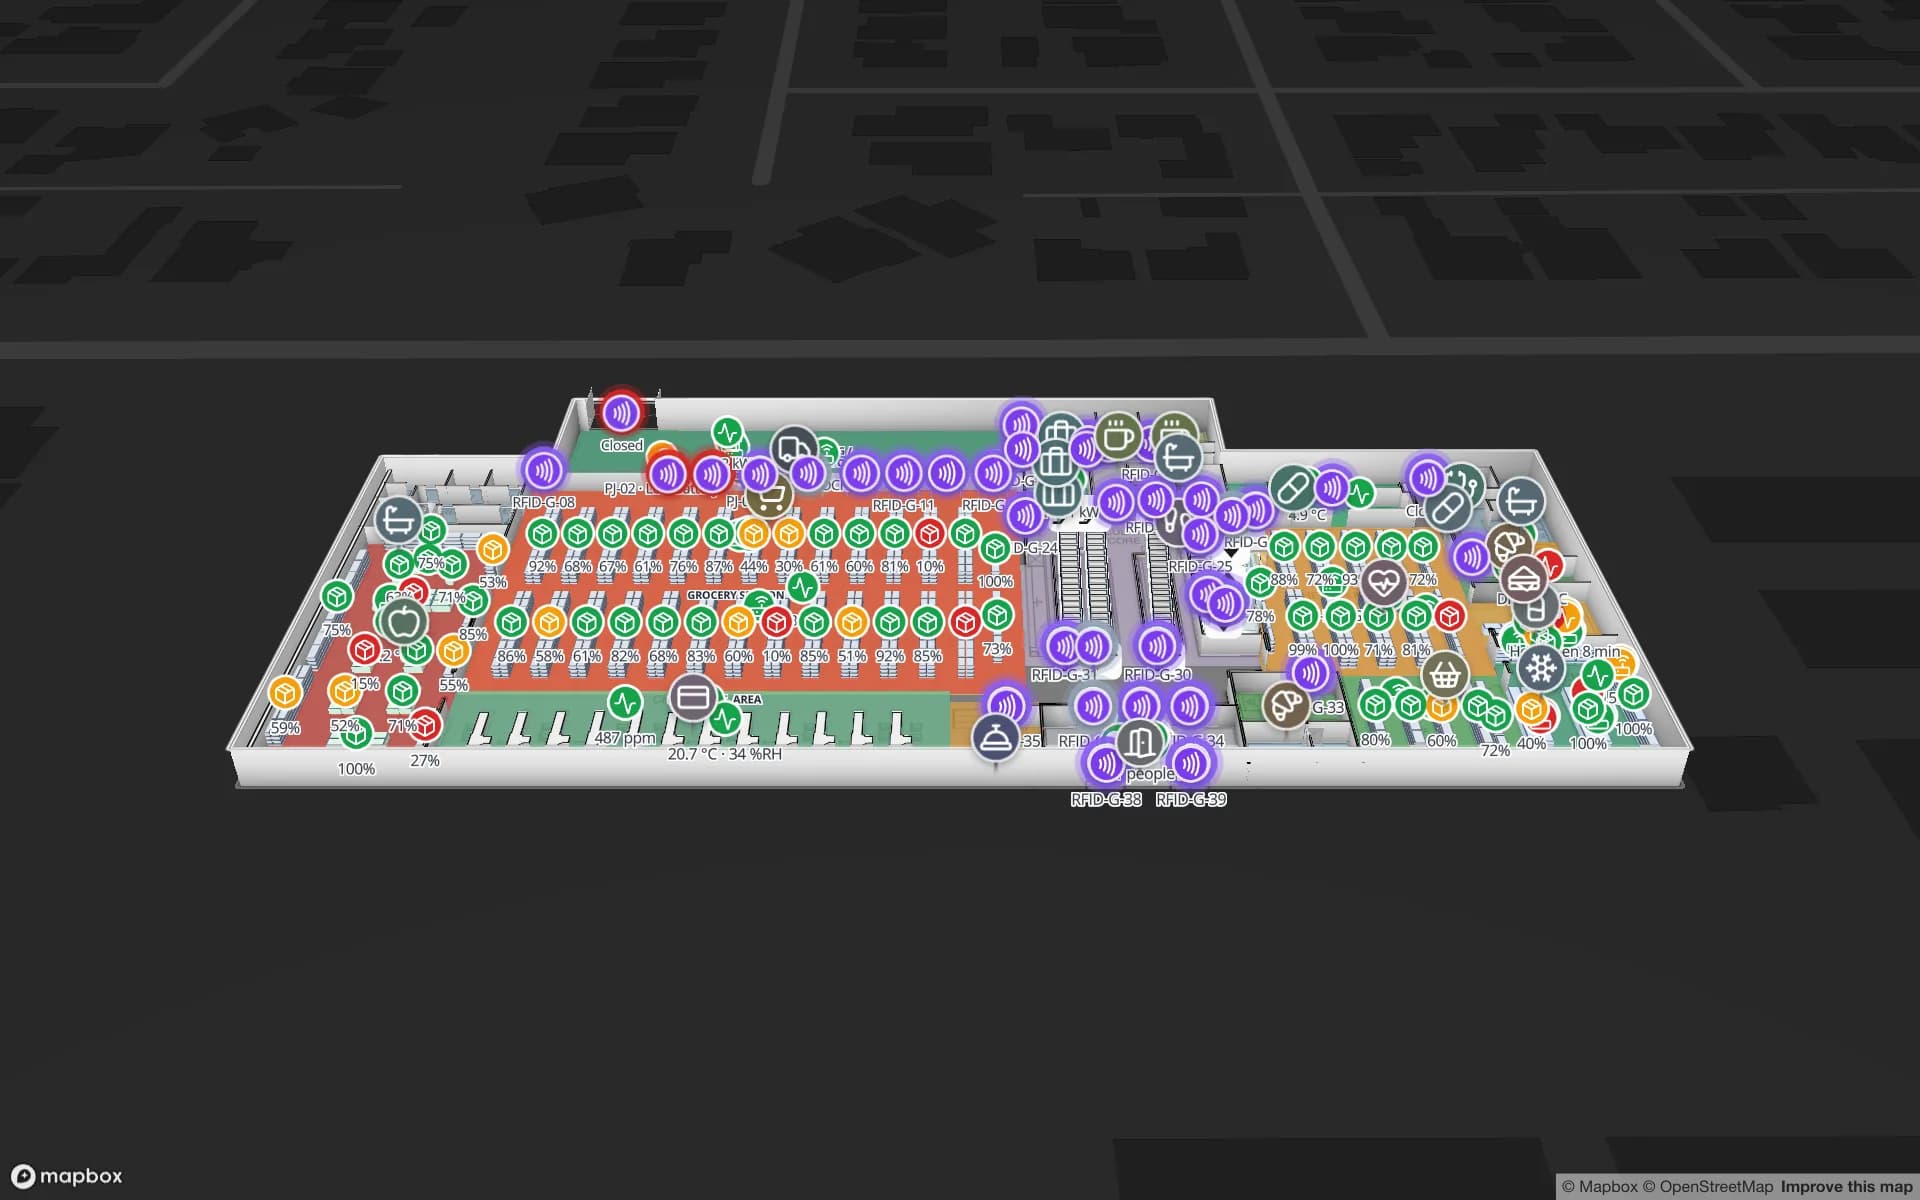
Eastport Cross-Dock Freight Hub, a cross-dock & trailer yard demo, in the Spatial Map 3D viewer with live device markers
Eastport Cross-Dock Freight Hub
Eastport Cross-Dock, a demo freight hub: 50 dock doors, 44 yard slots and 1,180 RFID pallets, with the gate lanes and weighbridge.
Dock doors in the Eastport cross-dock demo
50
RFID pallets moving through Eastport
1,180
Rack locations in the Crestline fulfillment demo
2,204
Free trial, up to 5 facilities, no card
7 days

Port Newark and Elizabeth: more than 2,000 contiguous acres

A 2019 New Jersey Monthly feature, republished by Choose New Jersey, describes the docks as covering “more than 2,000 contiguous acres” across Newark and Elizabeth, and says the Newark/Elizabeth complex handles 80 percent of the containers at the Port of New York and New Jersey. The same piece reports that trucks carry about 85 percent of cargo out of the port and rail carries the rest; the Port Authority describes its ExpressRail network as on-dock and near-dock rail serving the Elizabeth and Newark terminals among others.

For a warehouse, that split decides how the day goes. A container that leaves by truck lands at a dock door within hours, and the building has to know which door, which lane and which pallet. The Eastport demo shows the idea on a cross-dock: 50 dock doors, 44 yard slots and 1,180 RFID pallets on one map, with the gate lanes and weighbridge in front. Spatial Map does not connect to terminal, drayage or port community systems. It shows what your own WMS, yard system and RFID readers report, in the building where the freight actually sits.


Where the container revolution began, and the bridge that had to be raised

Choose New Jersey notes that the first container ship sailed from Newark in 1956, and that the 90-year-old Bayonne Bridge was raised at a cost of $1.7 billion so larger ships can pass beneath it. The same article says new vessels can carry 9,000 or more 40-foot containers. Whatever the final count, bigger ships mean bigger drops: a building that received a few dozen containers on a quiet day may receive several times that when a large vessel is worked.

Peak days are where a live map earns its keep. Draw each dock door, staging lane and overflow area, bind the reads from your portals and your WMS, and the building shows where the surge is piling up. A rule such as “pallet staged more than N minutes” raises an in-app alert, checked every 15 seconds, and the History player replays the afternoon afterward to see which door jammed first. See the post on cross-dock yard visibility for the pattern.

The Turnpike corridor: 148 miles of toll road and a building every few minutes

The New Jersey Turnpike Authority says the Turnpike opened in 1951 as the state’s first modern toll road and has grown from 118 to 148 miles with its extensions. Choose New Jersey adds that a section of the Turnpike runs between the port and Newark Liberty International Airport. Distribution buildings cluster along that spine because a truck can reach the port, the airport and the city from the same ramp, and many of them are multi-tenant: one roof, several customers, several WMS accounts.

That is where Spatial Map is easiest to explain. Put each customer’s racks on their own layer, color the rack locations from that customer’s stock table, and give each client a read-only share link that shows only the layers and floors you choose, with an expiry date and a view cap. The Crestline demo shows 2,204 rack locations, staging lanes and the trailer yard, and Solutions groups facilities, reports and data per program inside one workspace.

The last mile into Manhattan, Brooklyn and Queens

The MTA’s July 2023 briefing on its congestion program says average travel speeds in Manhattan fell 17 percent after 2010, from 9.2 mph to 7.6 mph, and that excess congestion costs businesses, commuters and residents in the region $20 billion a year. Last-mile buildings feel that directly. They are small, their dock windows are tight, and a van that waits 40 minutes for a door has already lost its slot in the street.

Mapping a small building is quick: upload the lease plan or a photographed sketch, let AI Map draft the walls, doors and racks for a person to review, and name the dock doors the way your drivers do. Then track what matters in a last-mile site: staged orders by route, totes in the sortation area, vans waiting at doors. A heatmap of dock activity shows which door is the bottleneck, and an alert on “not updated for N minutes” catches a staging lane that nobody has touched. Spatial Map does not route vans or talk to the city’s tolling or parking systems; those stay in your transport software.

Services for teams in New Jersey

Teams in this corridor usually start from the dock door and work outward:

  • Port-side and cross-dock operators usually begin with inventory tracking at the dock doors, because a pallet in the wrong lane is found only when the trailer is late.
  • Multi-tenant 3PL buildings add asset tracking for returnable totes, pallets and forklifts, then a share link per client.
  • RTLS and UWB is a second step for large buildings where forklifts and people must be located continuously; most sites start with RFID at the doors.
  • If you have no readers yet, our team can source RFID readers, antennas and tags on request, quoted per project, with warranty and device support from the manufacturer: see hardware and demo kits on request.
  • Where a WMS integration or handheld app is missing, our team builds Android RFID handheld apps, ERP and WMS integrations, and other custom software such as POS or booking systems as client projects. The product runs as cloud or on-premises.

Also served nearby

The same page covers Linden, Carteret, Kearny, Secaucus, Edison and Bayonne in New Jersey, and Brooklyn, Queens and Staten Island across the harbor. Nothing needs to be installed at any of them: the map opens in a browser.

How Spatial Map does it

From the dock door to a live building map

  1. 01

    Pick one building

    A cross-dock, a 3PL bay or a last-mile hub, wherever a lost pallet costs most.

  2. 02

    Map doors, lanes and racks

    Upload the plan or a photograph, let AI Map draft the floor, and name dock doors the way your drivers and your WMS do.

  3. 03

    Connect reads and stock

    Your WMS and RFID middleware post rows through the table write API, a polled REST endpoint or CSV and Excel uploads.

  4. 04

    Add door and silence rules

    In-app alerts for pallets staged too long, short loads before the cutoff and portals that stopped reporting.

What New Jersey teams track

Port-side cross-docks

Dock doors, yard slots, gate lanes and pallets staged for the right trailer.

Multi-client 3PL buildings

Rack stock by customer layer, with a read-only share link for each client.

Last-mile and store replenishment

Staged orders by route and rack-level stock for the shelves the van will refill.

Pharma and food cold rooms

Temperature zones, cold-room doors and held pallets in place.

See it on real demo facilities

Fictional names, real floor plans, live sensors, RFID, BLE tags and gateways — open any of them in the browser.

All 13 demo facilities

Warehouse tracking in New Jersey: questions we get

No. It has no link to port community, terminal or customs systems. It shows what happens inside your own building from your own WMS, RFID reads and sensors, so it complements port-level systems rather than replacing them.

No. Spatial Map is indoor mapping software: it shows buildings, dock doors and the yard behind your gate. Road tracking stays with your telematics or transport system; a trailer enters Spatial Map’s picture when it reaches the gate, if your yard system reports it.

Yes. Upload a PDF, an image of the lease plan or a photographed sketch, align it at real size, and let AI Map draft the walls, doors and racks for a person to review.

Yes, through read-only share links. Put each client’s racks and tables on their own layer, choose which layers and floors a link shows, set an expiry and a view cap, and revoke it at any time. The client needs no account.

No. Spatial Map is sold online and our team works with customers in the United States remotely, by video call and through the contact form. There are no local resellers or partners.

In US dollars, the same worldwide: a 7-day free trial for up to 5 facilities with no card, then Pro at $60 a month or $600 a year for up to 4 facilities. RFID hardware, if you ask us to source it, is quoted per project and is not part of the subscription.

Map one New Jersey dock before the next surge.

Start the free trial and open the Eastport demo, or send us the plan of a cross-dock or last-mile building and a sample of your WMS or RFID data through the contact form.