Liverpool · Seaforth, the port’s rail terminal and the Freeport

RFID tracking in Liverpool, from the deep-water berth to the client’s bay

Spatial Map puts RFID reads on a live 3D map of the building where they happen, so a tag at a dock door becomes a pallet in a lane, a carton in a client’s bay or a cage waiting for its trailer. RFID tracking in Liverpool is shaped by one deep-water port and the corridor behind it: the container estate at Seaforth, a rail terminal on the port itself, multi-client warehousing at the quayside and the Freeport sites strung out to the east. Your readers and middleware do the reading; Spatial Map shows each read in place.

No credit card. Runs in the browser. Pro is $60/month for up to 4 facilities. Book a demo

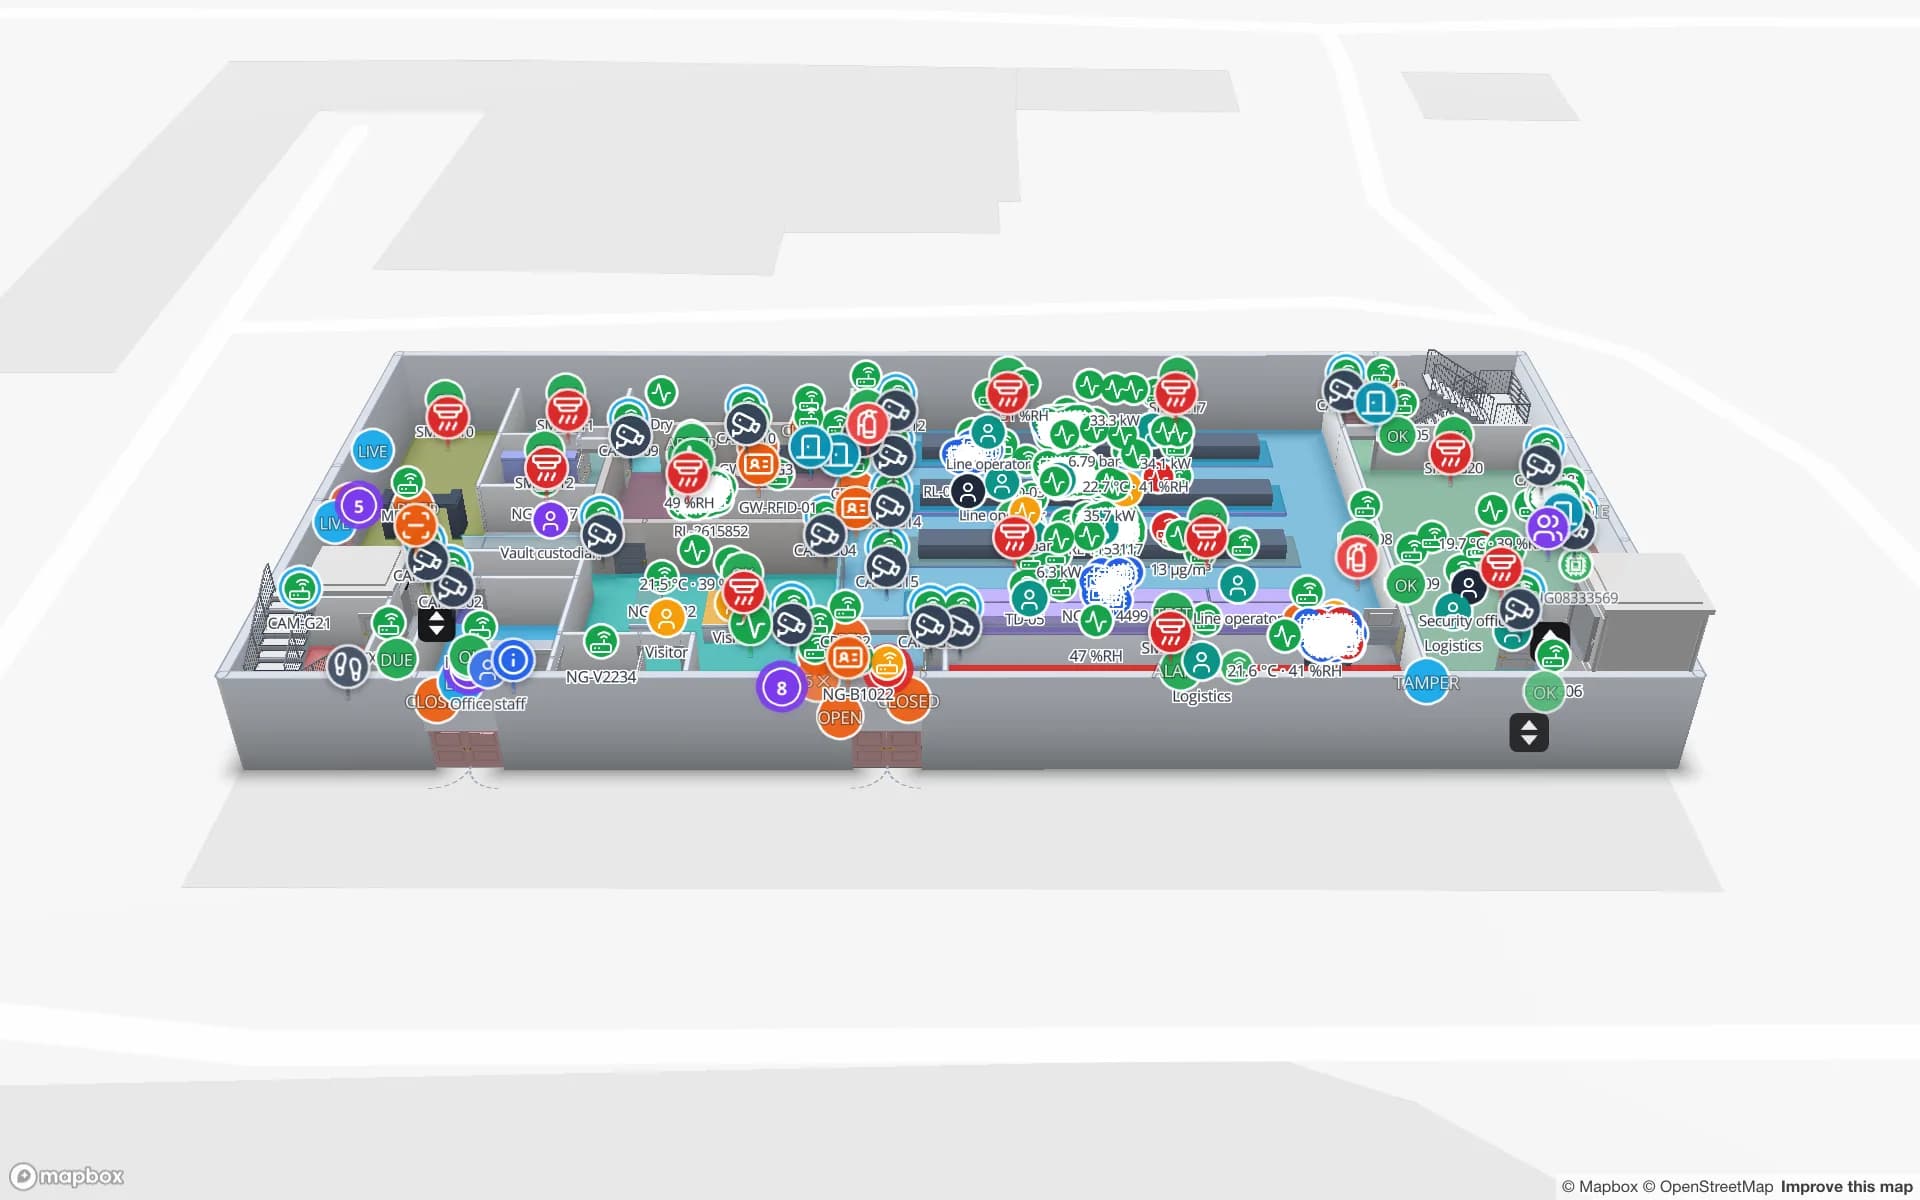
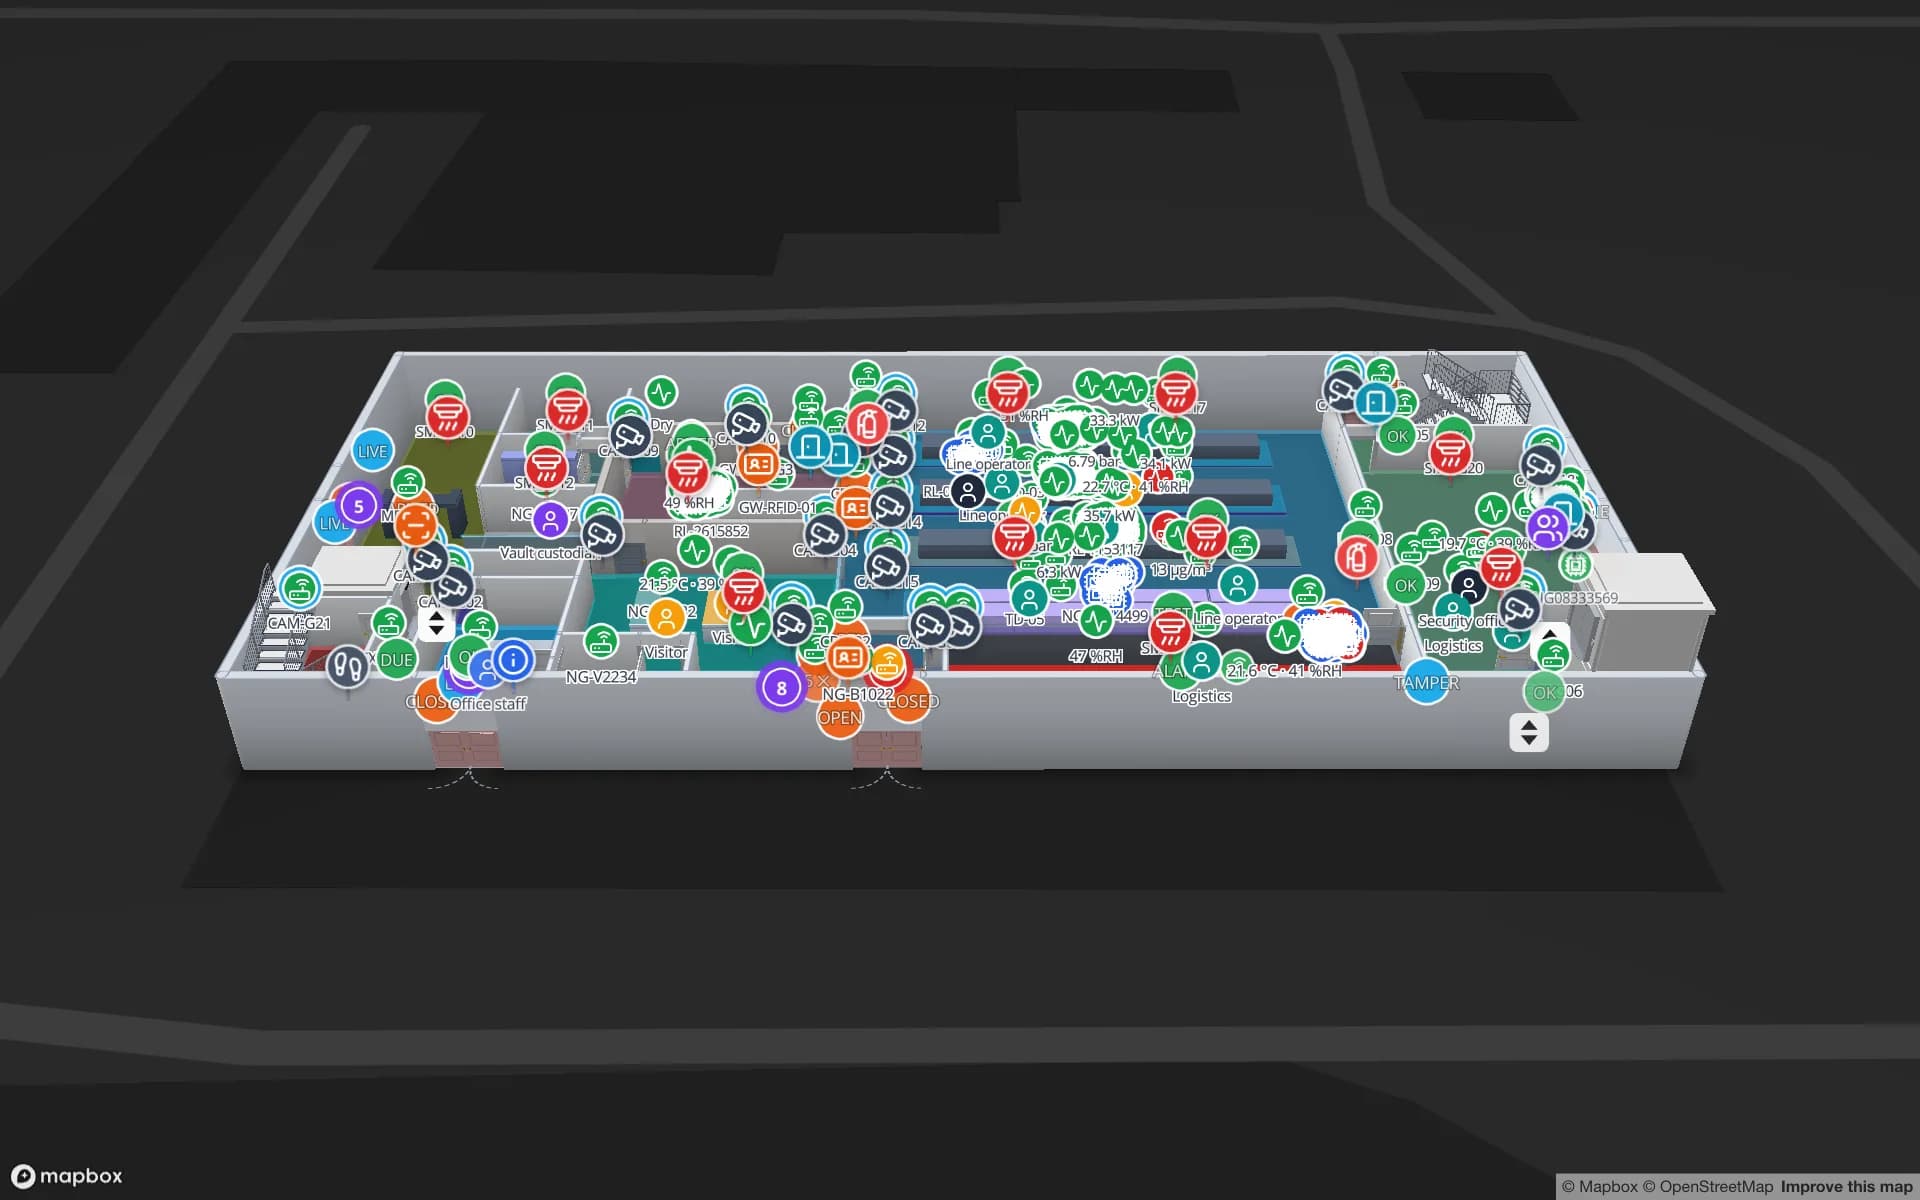
Logistics film: “Move freight on time” beside Eastport Cross-Dock and its trailer yard in 3D
The Logistics film: Eastport Cross-Dock, a demo freight hub with 50 dock doors, 44 yard slots and 1,180 RFID pallets, the gate and weighbridge.
Dock doors in the Eastport cross-dock demo
50
Yard slots on the same map
44
Rack locations in the Crestline fulfilment demo
2,204
Free trial, up to 5 facilities, no card
7 days

Seaforth: the box is the carrier’s, the pallet is yours

The port describes Liverpool2 as its deep-water container terminal for transatlantic trade and deep-sea services, with a maximum draft of 16.5 m, standing on one connected estate at Seaforth beside the older container terminal. The point of it, in the operator’s words, is to bring deep-sea services closer to the manufacturing and population centres of the north of England and the Midlands, within easy reach of the M62, M6 and M58. A container that lands there is the carrier’s unit. What a warehouse cares about is the pallets and cartons inside it.

The practical place for a tag is where a box is stripped or a trailer is loaded: tag each pallet or carton against its order or client reference, read it at the shed door, and the map shows which are staged, which are in racks and which have left. The Eastport demo shows 50 dock doors, 44 yard slots and 1,180 RFID pallets on one map, and the post on integrating RFID readers with an indoor map explains how reads reach it. Spatial Map does not read container numbers, connect to a terminal’s systems or predict vessel arrivals; it shows what your own reads and WMS say.


A rail terminal on the quayside: the train is another lane

The port also describes a purpose-built rail terminal that lets it load and unload freight trains itself, with regular daily services to major ports and inland terminals, and direct access to the Manchester Ship Canal and the inland ports along it, which the Manchester page covers. For a shed that receives from rail, the picture is several kinds of arrival, wagon, trailer and, further up the canal, barge, that all end at the same dock doors.

A train load is a batch. Many boxes arrive together and are stripped over hours, so the question inside the shed is which batch is open, which pallets have come out and which doors they went to. Draw doors and lanes on the plan, name RFID read points the way your middleware does, and a lane that fills out of order shows on the map, with a “count of matching items” rule raising an in-app alert when a batch stalls. Spatial Map has no feed from the rail operator and does not track wagons or trains.

Multi-client quayside warehousing: whose pallet is it?

The port advertises multi-user storage at the quayside, with space for anything from one pallet to 40,000, in industrial, fast-moving consumer goods and temperature-controlled space. In a multi-client shed the hard question is ownership: pallets from several customers share aisles, and each customer wants to see its own stock and nobody else’s. Tag the pallet at goods-in with the client reference, draw each client’s bays as an area, and colour them by the status column your WMS keeps.

Give each client a read-only share link that shows only the floors and layers you choose, with an expiry date and a view cap; they do not need an account. The Crestline demo shows 2,204 rack locations coloured by stock status, and RFID warehouse management covers dock-door portals. For temperature-controlled space, readings from your own sensors can sit on the same map; see the cold-chain solution.

The Freeport sites: new floor space, often without drawings yet

The Liverpool City Region Freeport has three tax sites on the government’s list: Wirral Waters, Parkside in St Helens and 3MG in Widnes. The government’s investment page says the Freeport spans about 45 km from Wirral Waters to Port Salford and includes rail terminals and water-accessible sites. It describes Wirral Waters as dockside land inside the Mersey Waters Enterprise Zone for port-focused business, advanced manufacturing and R&D, and Parkside, on former colliery land, as the city region’s largest strategic employment site.

New sites mean new buildings, often occupied before anyone has drawn the as-built plan. Start from whatever exists, the architect’s DWG (AutoCAD R2004 to R2018, placed as a picture), a PDF sheet or a photograph, and let AI Map draft walls, doors, racks and areas for a person to review (paid plans and the trial, with a monthly limit). The Freeport’s customs and tax reliefs are for you and your own procedures: Spatial Map does not make declarations or hold customs records, but it can show where goods held in a zone physically are, as an area on the plan coloured by the status your WMS already keeps.

Services for teams in Liverpool

Where Liverpool teams usually start depends on the building:

  • Port-side sheds and cross-docks usually begin with inventory tracking at the dock doors, then add yard slots and trailers.
  • Multi-client operators often add asset tracking for returnable cages, pallets and handling kit, which are what go missing between customers.
  • RTLS and UWB matters mainly for big yards and sheds where trucks and forklifts must be located continuously; most buildings will not need it first.
  • If you have no readers or tags yet, our team can source RFID readers, antennas and tags on request, quoted per project, with warranty and device support from the manufacturer: see hardware and demo kits on request.
  • WMS integrations and handheld stock-take apps are built as client projects, including an RFID inventory system; the product runs as cloud or on-premises.

Also served nearby

The same approach covers Bootle, Knowsley, Halewood, Speke, Runcorn, Widnes, St Helens, Birkenhead and Ellesmere Port, and the sheds along the M62 and M58. Nothing needs to be installed at any of them: the map opens in a browser.

How Spatial Map does it

From the quayside shed to a client’s own view

  1. 01

    Pick one shed

    A port-side cross-dock, a multi-client warehouse or a Freeport unit, wherever a mislaid pallet costs most.

  2. 02

    Map doors, bays and lanes

    Upload the plan, photo or sketch, let AI Map draft the floor, and name read points the way your middleware names them.

  3. 03

    Connect reads and stock

    RFID middleware and your WMS post rows through the table write API, a polled REST endpoint or CSV and Excel uploads.

  4. 04

    Share per client

    Read-only links that show one client’s floors and layers, plus in-app alerts for batches that stall and readers that stop reporting.

What Liverpool teams track

Port-side sheds and trailers

Dock doors, yard slots and pallets staged against each trailer or train batch.

Multi-client warehousing

Each client’s pallets by bay and status, with a link that shows only theirs.

Temperature-controlled stock

Cold rooms and pallets on one map, with readings from your own sensors.

Returnable cages and handling kit

Tagged cages and frames followed between clients, with a read trail.

See it on real demo facilities

Fictional names, real floor plans, live sensors, RFID, BLE tags and gateways — open any of them in the browser.

All 13 demo facilities

RFID tracking in Liverpool — questions we get

No. It has no link to terminal, rail or customs systems and does not predict arrivals. It shows what happens inside your own building, from your own RFID reads and WMS, so it sits beside port-level systems rather than replacing them.

Yes. Draw each client’s bays as an area, tag pallets with the client reference, and give each client a read-only share link that shows only the floors and layers you choose, with an expiry date and a view cap. They do not need an account.

No. Container and wagon identification belongs to the carrier and the terminal. Tags go on what you manage: pallets, cartons, cages and handling kit. Spatial Map does not track wagons or trains.

It does not make declarations, hold customs records or connect to customs systems. It can show where goods held in a zone physically are, as an area coloured by the status column your WMS keeps. Your own customs procedures remain the record.

No. Spatial Map is sold online and our team works with customers in the UK remotely, by video call and through the contact form. There are no local resellers or partners, and nothing is installed on site.

In US dollars, the same worldwide: a 7-day free trial for up to 5 facilities with no card, then Pro at $60 a month or $600 a year for up to 4 facilities. RFID hardware, if you ask us to source it, is quoted per project and is not part of the subscription.

Map one Liverpool shed before the next vessel.

Start the free trial and open the Eastport demo, or send us the plan of a shed and a sample of your reads through the contact form.