Beirut · The port, its rebuilding plan and the warehouses behind it

Inventory tracking in Beirut, from the port to the stockroom

Spatial Map is a browser-based live map of a building that shows where stock sits, using the counts, scans and RFID reads your own systems produce. Inventory tracking in Beirut begins at the port: containers for the city’s warehouses and shops come through the Port of Beirut, which is being rebuilt under a published plan, so the businesses behind it plan around moving parts. A live stock map shows what you actually hold. The interface can be used in Arabic, French or English.

No credit card. Runs in the browser. Pro is $60/month for up to 4 facilities. Book a demo

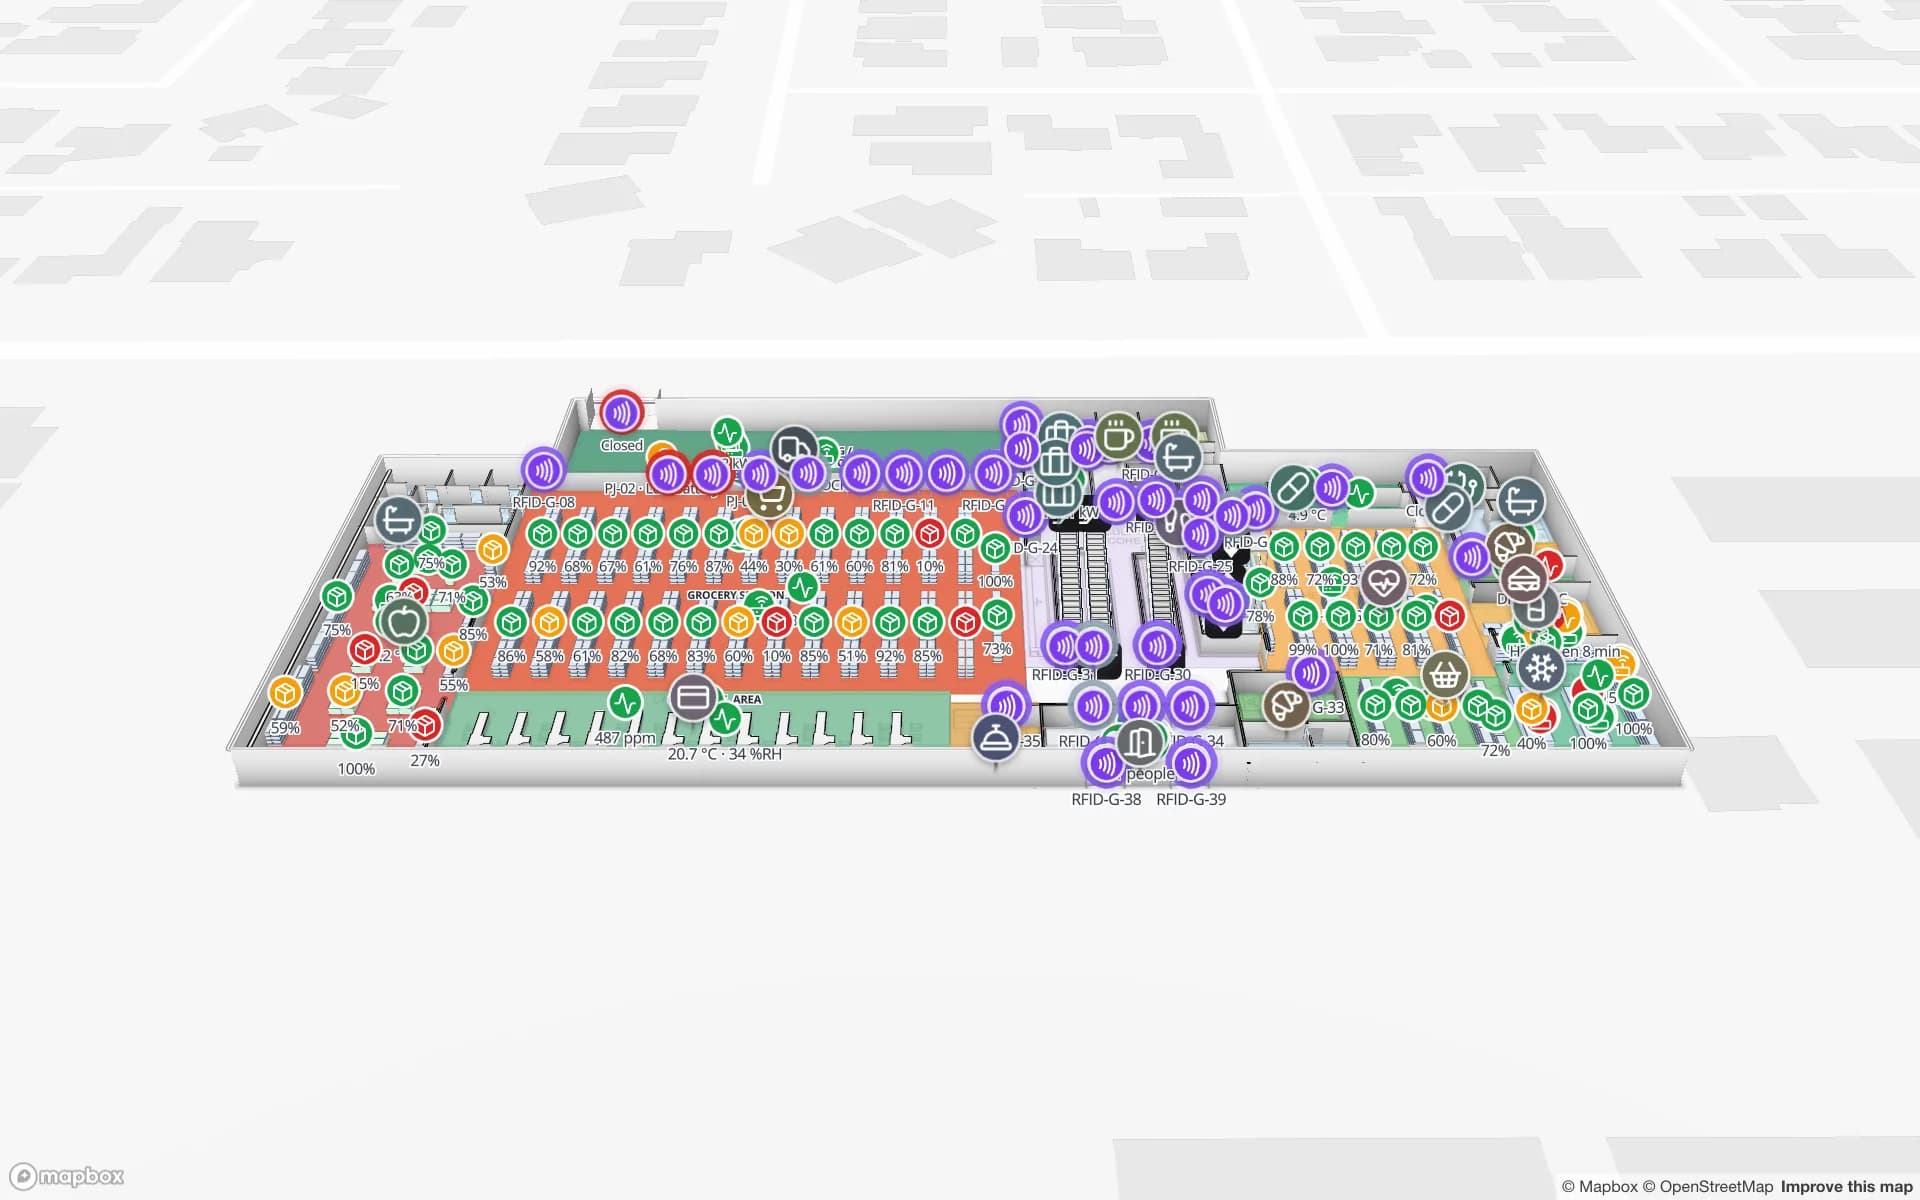
Retail Mart Store, a three-floor retail store demo, in the Spatial Map 3D viewer with live device markers
Retail Mart Store
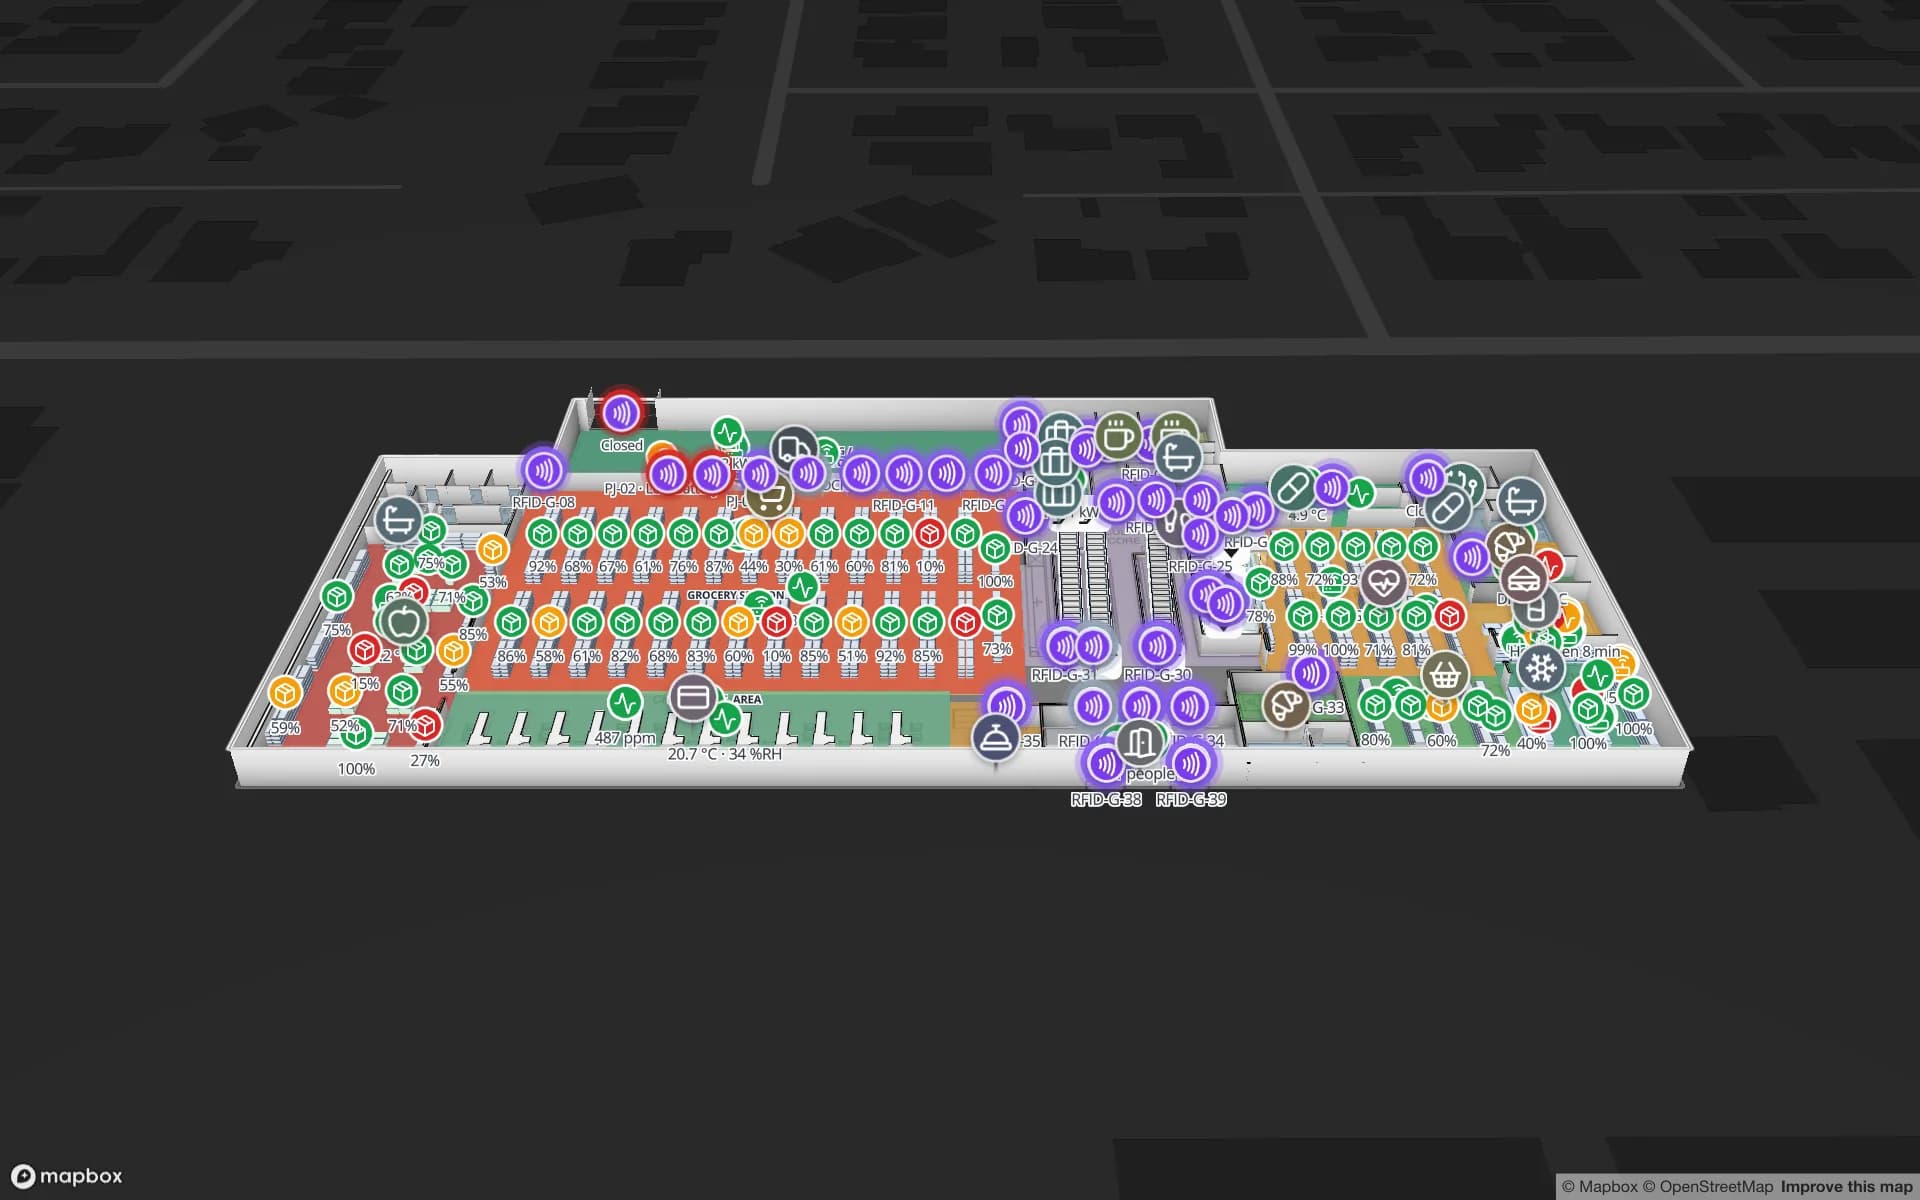
Retail Mart, a demo three-floor store: 85 RFID readers at doors, escalators and lifts, department stock, fridge sensors and BLE-tagged trolleys and staff.
RFID readers in the Retail Mart demo
85
Rack locations in the Crestline fulfilment demo
2,204
Arabic, French and English among the six interface languages
3
Free trial, up to 5 facilities, no card
7 days

The port and its rebuilding plan

The explosion at the Port of Beirut on 4 August 2020 damaged its quays. A plan to rebuild, developed with French government funding by two French engineering firms and presented in March 2024, covers repairing the damaged quays, reorganising the layout for better traffic flow and moving the port to solar power. Restoring state infrastructure was estimated at US$60 to 80 million, to be paid for from port revenue.

The grain silos, which took the worst of the blast, were not part of the 2024 plan. A proposal reported in May 2025 reserves a 25,000 m² plot for a possible reconstruction, pending a decision by the ministries concerned. The planning around the port is therefore still moving, and anyone who stores goods that pass through it is working around that. Spatial Map does not touch any port system. What it offers a warehouse beside the port is a map of its own stock that you can redraw in an afternoon when a lane, a door or a rack moves.


Containers in, pallets out: what the volumes mean for a stockroom

In 2022 a ten-year concession to run the container terminal was awarded. Containers handled at the port reached 800,000 TEU in 2023, up from about 600,000 in 2022 and still below the 1.2 million TEU of 2019. A TEU is one twenty-foot container, so the traffic is counted in boxes, and what matters downstream is what is inside them and where it goes next.

A box becomes pallets, pallets become bins, and each step is a chance to lose count. The simplest start is a spreadsheet: upload a CSV or Excel list of bins and quantities, draw the racks as a grid, and each location is coloured by what it holds; CSV bin inventory to a live rack map shows the steps. Later a handheld count or RFID reads at the receiving door update the same table, and the Crestline demo shows 2,204 rack locations coloured by stock status with the staging lanes before the docks.

Stock you can trust when lead times move

When the next delivery is hard to predict, an accurate count matters more than a fast one. The practical questions are which locations are empty, which are over-full, which items are slow movers that could be moved to the back, and which delivery is late. Give each bin one row, with a quantity and a last-counted date, and a data link colours racks by quantity or by a days-since-count column your system writes. An alert rule set to “count versus threshold” raises an in-app alert when a fast-moving item falls below its reorder level, and Show on map takes you to the rack.

For retail, the same idea runs across a shop. The Retail Mart demo colours departments by shelf stock, and item-level RFID tags on clothing or electronics let a counting walk take minutes; how RFID stock counting works and RFID vs barcode in the warehouse help you decide which suits which stock. Spatial Map does not write back to your ERP, so the ledger stays where it is.

Small teams and mixed languages

Lebanese teams often switch between Arabic, French and English in the same day. The interface comes in all three, Arabic with a full right-to-left layout, and each user picks their own; product names, bin codes and report titles show as you write them, in any script. Our team also works remotely in all three, so a floor plan or an integration can be scoped in the language your team prefers.

Nothing needs installing, and one person can import a plan, draw the racks, upload a spreadsheet and share a read-only link with the owner in the same week. The Lebanon page covers retail, FMCG and venues in more general terms; this page is about stock.

Services for teams in Beirut

Beirut teams tend to follow this order:

Also served nearby

The same page covers the areas around Beirut, such as Sin el Fil, Dekwaneh, Jdeideh and Hazmieh, and the road south to Sidon and north to Jounieh and Tripoli. All of them open in a browser with nothing to install.

How Spatial Map does it

A route from spreadsheet to live stock map

  1. 01

    Pick one stockroom

    A warehouse beside the port, a distribution shed or a shop back room — wherever a wrong count costs most.

  2. 02

    Draw racks and bins

    Upload a plan, photo or sketch, and let AI Map draft the floor; draw racks as a grid with bin locations.

  3. 03

    Load stock and counts

    Upload a CSV or Excel export today; connect handheld counts, RFID middleware or a POS export through the write API later.

  4. 04

    Add low-stock and count rules

    In-app alerts for items below reorder level, locations not counted in a while and readers that stopped reporting.

What Beirut teams track

Distribution warehouses

Bin-level stock, packing and staging lanes and the trailer yard from a spreadsheet or ERP export.

Stores and department stock

Departments coloured by shelf stock, with RFID at exits and fridge sensors.

Port-side receiving

Dock doors, yard slots and pallets staged for the right container.

Chilled and frozen stock

Cold rooms, fridges and freezers coloured by live temperature.

See it on real demo facilities

Fictional names, real floor plans, live sensors, RFID, BLE tags and gateways — open any of them in the browser.

All 13 demo facilities

Inventory tracking in Beirut — questions we get

No. It has no link to port, terminal or customs systems. It shows stock inside your own building from your own counts, scans, RFID reads or ERP exports, so it complements the port-level systems rather than replacing them.

Yes, by file. Upload a CSV or Excel export of bins and quantities whenever you want the map refreshed; every change is kept in the row history. If a system can expose a REST endpoint later, a table can poll it on a schedule.

Yes. Spatial Map is available in Arabic (with a full right-to-left layout), French, English, German, Spanish and Chinese, and each user chooses their own language. Names and codes you type appear exactly as you write them.

No. It shows where stock sits and how it changes, and alerts you in the app when a rule is met, but it does not write back to your ERP or accounting package. The ledger stays the record.

No. Spatial Map is sold online and our team works with customers in Lebanon remotely, by video call and through the contact form, in Arabic, French or English. There are no local resellers or partners.

In US dollars, the same worldwide: a 7-day free trial for up to 5 facilities with no card, then Pro at $60 a month or $600 a year for up to 4 facilities. RFID hardware, if you ask us to source it, is quoted per project and is not part of the subscription.

Count one Beirut stockroom on a live map.

Start the free trial and upload a spreadsheet of bins, or send us the plan of a warehouse or store and a sample of your stock list through the contact form.






