Retail · Supermarkets & grocery

Smart supermarket solutions: chillers, shelves and the backroom on one map

Spatial Map delivers smart supermarket solutions as a live 3D store map: every chiller and freezer with its temperature, fresh and expiry areas, shelf gaps from your stock data, the backroom and receiving dock, and staff and trolley traffic. It is where supermarket cold chain monitoring and floor operations meet on one plan.

Last updated:

No credit card. Runs in the browser. Pro is $60/month for up to 4 facilities. Book a demo

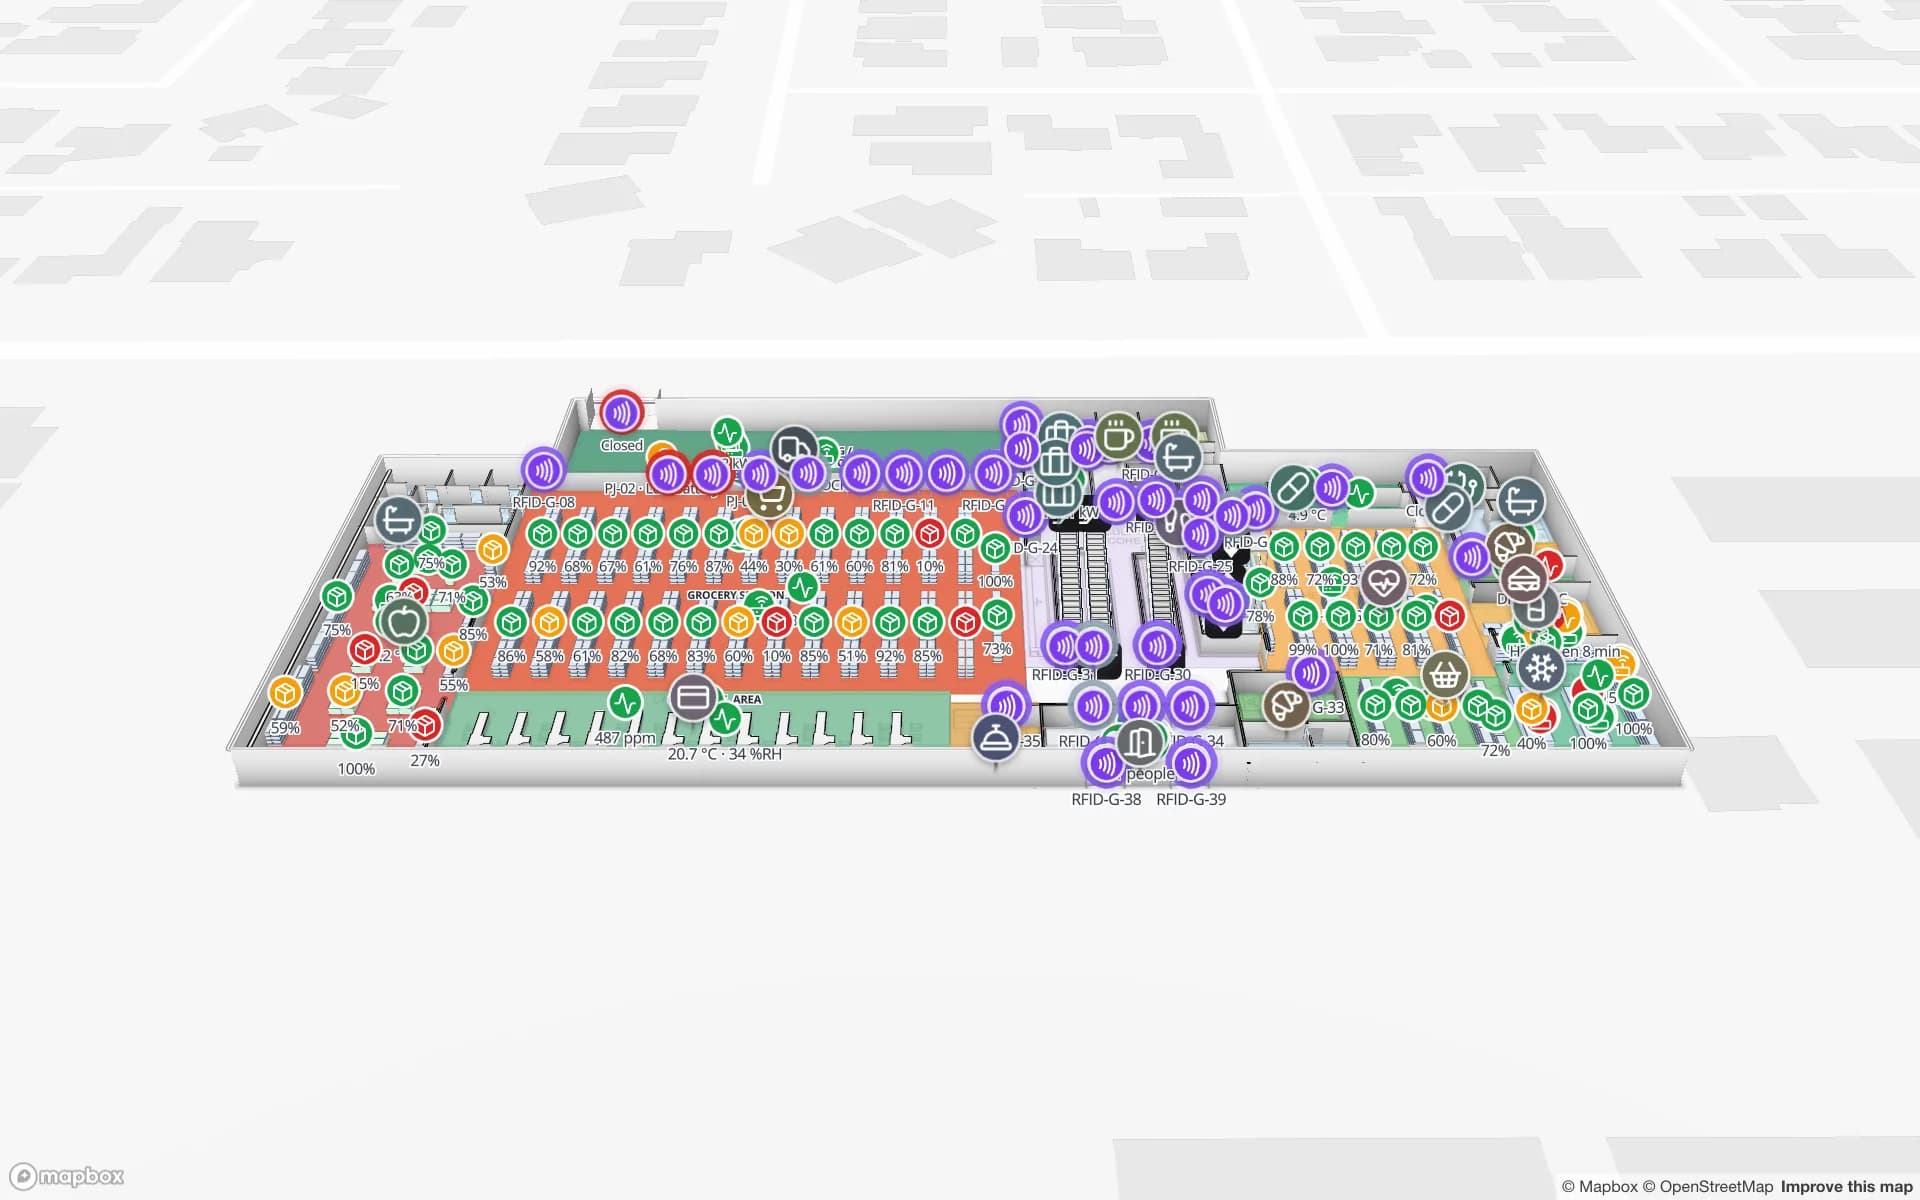
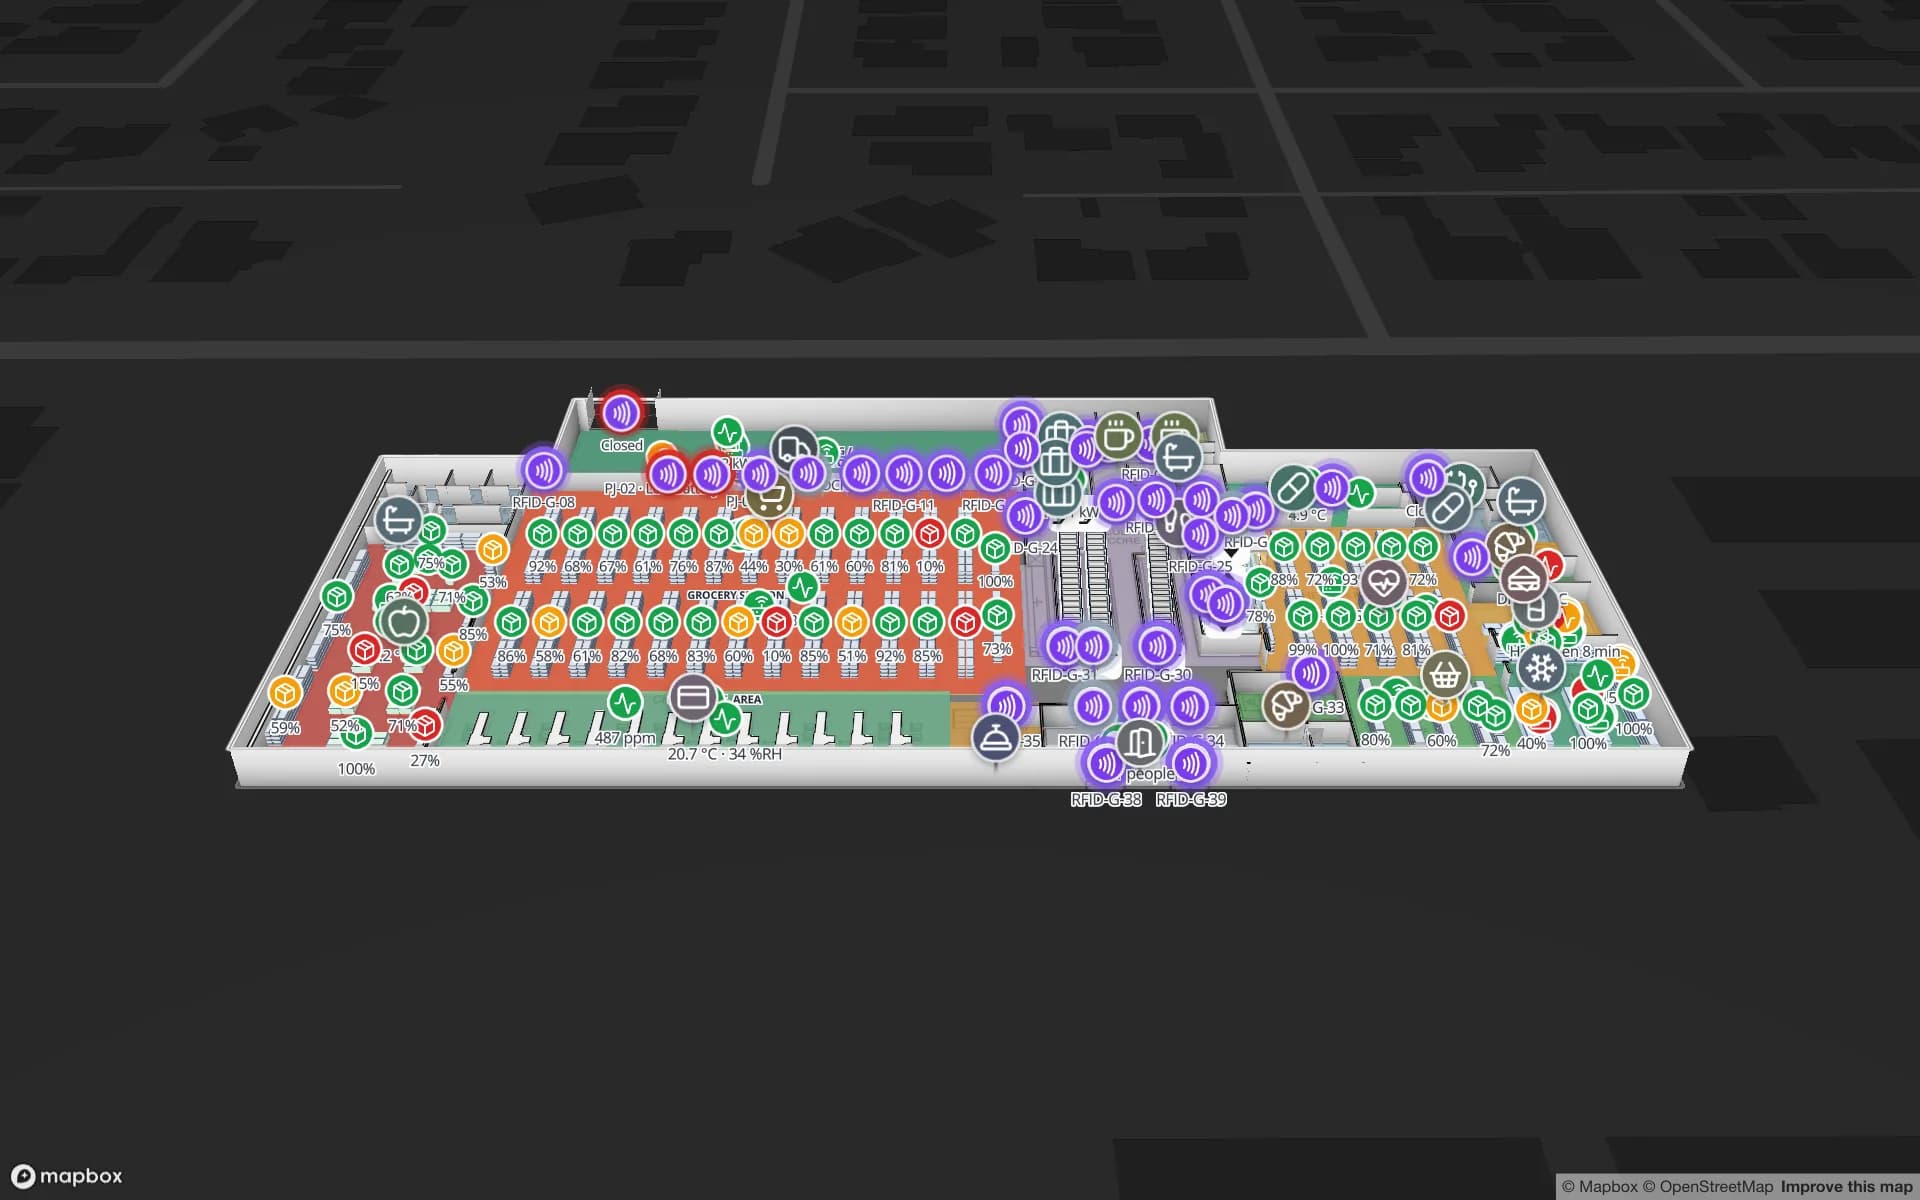
Retail Mart Store, a three-floor retail store demo, in the Spatial Map 3D viewer with live device markers
Retail Mart Store
Retail Mart, a three-floor demo store: fridges and freezers carry temperature markers, shelving carries stock percentages.
Floors in the Retail Mart demo store
3
Shelving runs with daily stock counts in the demo
167
How often alert rules are checked
15 s
Free trial, no credit card
7 days

Chillers and freezers on the map

In a supermarket the cold chain is the part of the store where a quiet failure costs the most. In Spatial Map each chiller, freezer, display case and cold room is a shape on the floor plan with a temperature marker, coloured by thresholds you set: in range, warming, out of range, sensor silent. A probe that stopped reporting looks different from one that reads fine, and both are visible from the aisle they sit in.

Temperature rows come from your probes or logger gateway, written to a table with the write API or fetched by REST polling. Spatial Map does not read probes itself. Alert rules watch the table every 15 seconds: “temperature above 5 °C for 15 minutes” or “not updated for 10 minutes”, with a severity and a message that names the cabinet. Alerts arrive in the app (bell, pop-up and the Alerts page) with Show on map, and clear on their own when the reading recovers. There is no email, SMS or push, so overnight cover still needs your own on-call process. Row history and the History player show the curve afterwards.
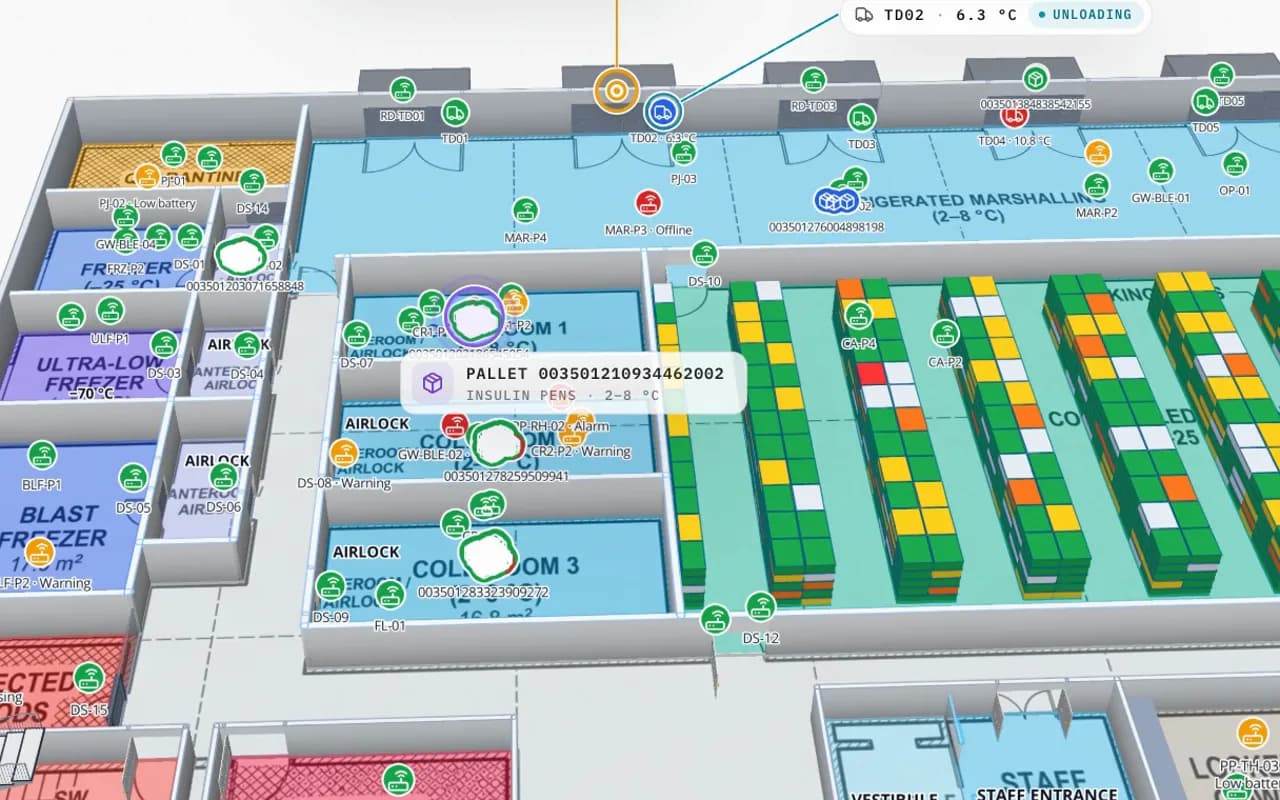

Polar Pharma cold store in 3D: cold rooms, freezers and pallet locations coloured by status, with an insulin pallet and a dock-door reading called out
Polar Pharma — Cold Storage & QC Facility
Cold-chain sensors on the map: markers coloured by temperature range, with the reading history one click away.

Fresh and expiry areas, shelf gaps and the backroom

Draw produce, bakery, dairy, deli and frozen as areas, then tint them from your own numbers. If your inventory or waste system sends days-to-expiry or a markdown flag per department or shelving run, an expiry area turns amber and red the way a stock gap does. Spatial Map shows that status; it does not compute shelf life or decide markdowns.

The same goes for shelf gaps. Daily counts or ERP stock appear as a percentage on each shelving run and tint the department, so a replenishment associate walks to the red rack on the right floor. Because it works from stock data and RFID reads, it sees what your systems know, not a camera view of the shelf. The shelf stock and cold chain guide wires up the Retail Mart demo step by step.

The backroom and receiving dock are shapes too. Delivery rows, cage and roll-container counts or a pallet scan from your handhelds can land on the dock or stockroom zone, so “has the chilled delivery been put away?” has a place to be answered.

  • Fresh and expiry areas — departments coloured by days-to-expiry or markdown status from your data.
  • Shelf gaps — stock percentage per shelving run; low and empty stand out in amber and red.
  • Backroom — stock by zone, so items that never reached the floor are visible.
  • Receiving — dock and chilled-intake zones fed by delivery or scan rows.

Staff, trolleys and traffic

Labour is the biggest cost a store controls, and much of it is spent a few metres from where it is needed. Staff and trolleys appear as live markers when your badge, BLE or RTLS system sends positions; customer traffic tints each department by entries per time bucket; fire extinguishers and first-aid kits sit where they hang, with their next inspection date. The supermarket digital twin guide walks through all three.

A deep tint over bakery with nobody nearby is a staffing gap you can close in ten minutes. Spatial Map shows what your systems send and never tracks people on its own, so agree with your team what is shown and to whom, and aggregate traffic before it is sent. The map supports safety checks; it is not the statutory inspection record.

Grocery store RFID: where it fits today

Item-level grocery store RFID is limited by tag cost and by liquids and foil, which detune standard tags. The practical starting points are case and pallet reads at receiving and the backroom door, and item-level tags on higher-value lines such as cosmetics, alcohol and electronics. Readers show up on the same map as the fridges. The tag, reader and exit detail sits on RFID for retail stores.

What goes on a supermarket map

AreaData your systems sendWhat the map shows
Chillers and freezersProbe temperature and last reading timeMarker coloured by range; in-app alert for “too warm” or “silent”
Fresh and expiry areasDays to expiry or a markdown flagDepartment tinted amber or red
ShelvingDaily count or ERP stock per runStock percentage and low or empty markers
Backroom and receivingDelivery or scan rows per zoneCounts at the dock and stockroom
Aisles and departmentsEntry counts per time bucketTraffic tint or heatmap by floor
Staff and trolleysPositions from badges, BLE or RTLSLive markers with role and zone

Only BlueIOT has a built-in device driver; other position sources connect through the write API or REST polling. See device connections.

How Spatial Map does it

A supermarket on the map in four steps

  1. 01

    Map the floor

    Import the plan, then draw departments, shelving runs, chillers, checkouts, receiving and the backroom. AI Map drafts racks, walls and labels for review.

  2. 02

    Bind the data

    Create tables for stock, temperatures and traffic. Handhelds, loggers and middleware write to them; style rules set the colours.

  3. 03

    Set the alerts

    Rules per table: temperature above a limit for N minutes, a probe not updated, a shelf below a threshold. Alerts arrive in the app.

  4. 04

    Report and share

    Store-overview and cold-chain reports export to PDF or Excel; read-only links go to department heads and head office.

Supermarket use cases

Cold-chain watch

Chillers and freezers coloured by temperature, with in-app alerts and history.

Shelf gaps

Shelf stock percentages and department tints from the daily count.

Receiving and backroom

Delivery and stock rows on the dock and stockroom zones.

Loss prevention

Reader reads at the exits and the trail of a flagged item.

See it on real demo facilities

Fictional names, real floor plans, live sensors, RFID, BLE tags and gateways — open any of them in the browser.

All 13 demo facilities

Smart supermarket solutions — frequently asked questions

No. Your probes or logger gateway send readings to a table with the write API, or Spatial Map polls a REST endpoint. Then temperature markers, alert rules and the cold-chain report work from those rows.

Not today. Alerts show in the app (bell, pop-up, Alerts page) with Show on map; there is no email, SMS or push. Keep your own on-call process for out-of-hours breaches.

It shows gaps that your stock data or RFID reads reveal, such as a rack at 8 percent. It has no shelf cameras or computer vision.

It keeps a readable history of each cabinet and exports reports to PDF or Excel. It is not a certified monitoring system or a statutory record; keep those where your regulator expects them.

Mostly at case and pallet level today, with item tags on higher-value lines. See RFID for retail stores for tags and readers.

Through tables, REST polling or file uploads, with no vendor-specific connectors and no write-back. Two-way integrations and POS work are custom projects.

A 7-day free trial covers up to 5 facilities with no credit card. Pro is $60 a month or $600 a year for up to 4 facilities. Larger store estates and done-for-you mapping are quoted as custom services.

Put every chiller, shelf and delivery on one map.

Start a free trial and open the Retail Mart demo, or send us your store plan and a day of temperature data and we will map it for you.




