Mombasa · The port, container freight stations and the Northern Corridor

Warehouse tracking in Mombasa for freight stations, sheds and transit cargo

Spatial Map does warehouse tracking in Mombasa on a live 3D map of each shed: stock by bay, consignments by destination, forklifts and trucks at their doors, all coloured from your own records and readers. Mombasa is where East Africa’s cargo is first put down, sorted and sent on, and the rules for where it clears have changed more than once. The map keeps the facts that move with the cargo, such as consignment, destination and time in the shed, so a rule change is an edit and not a rebuild.

No credit card. Runs in the browser. Pro is $60/month for up to 4 facilities. Book a demo

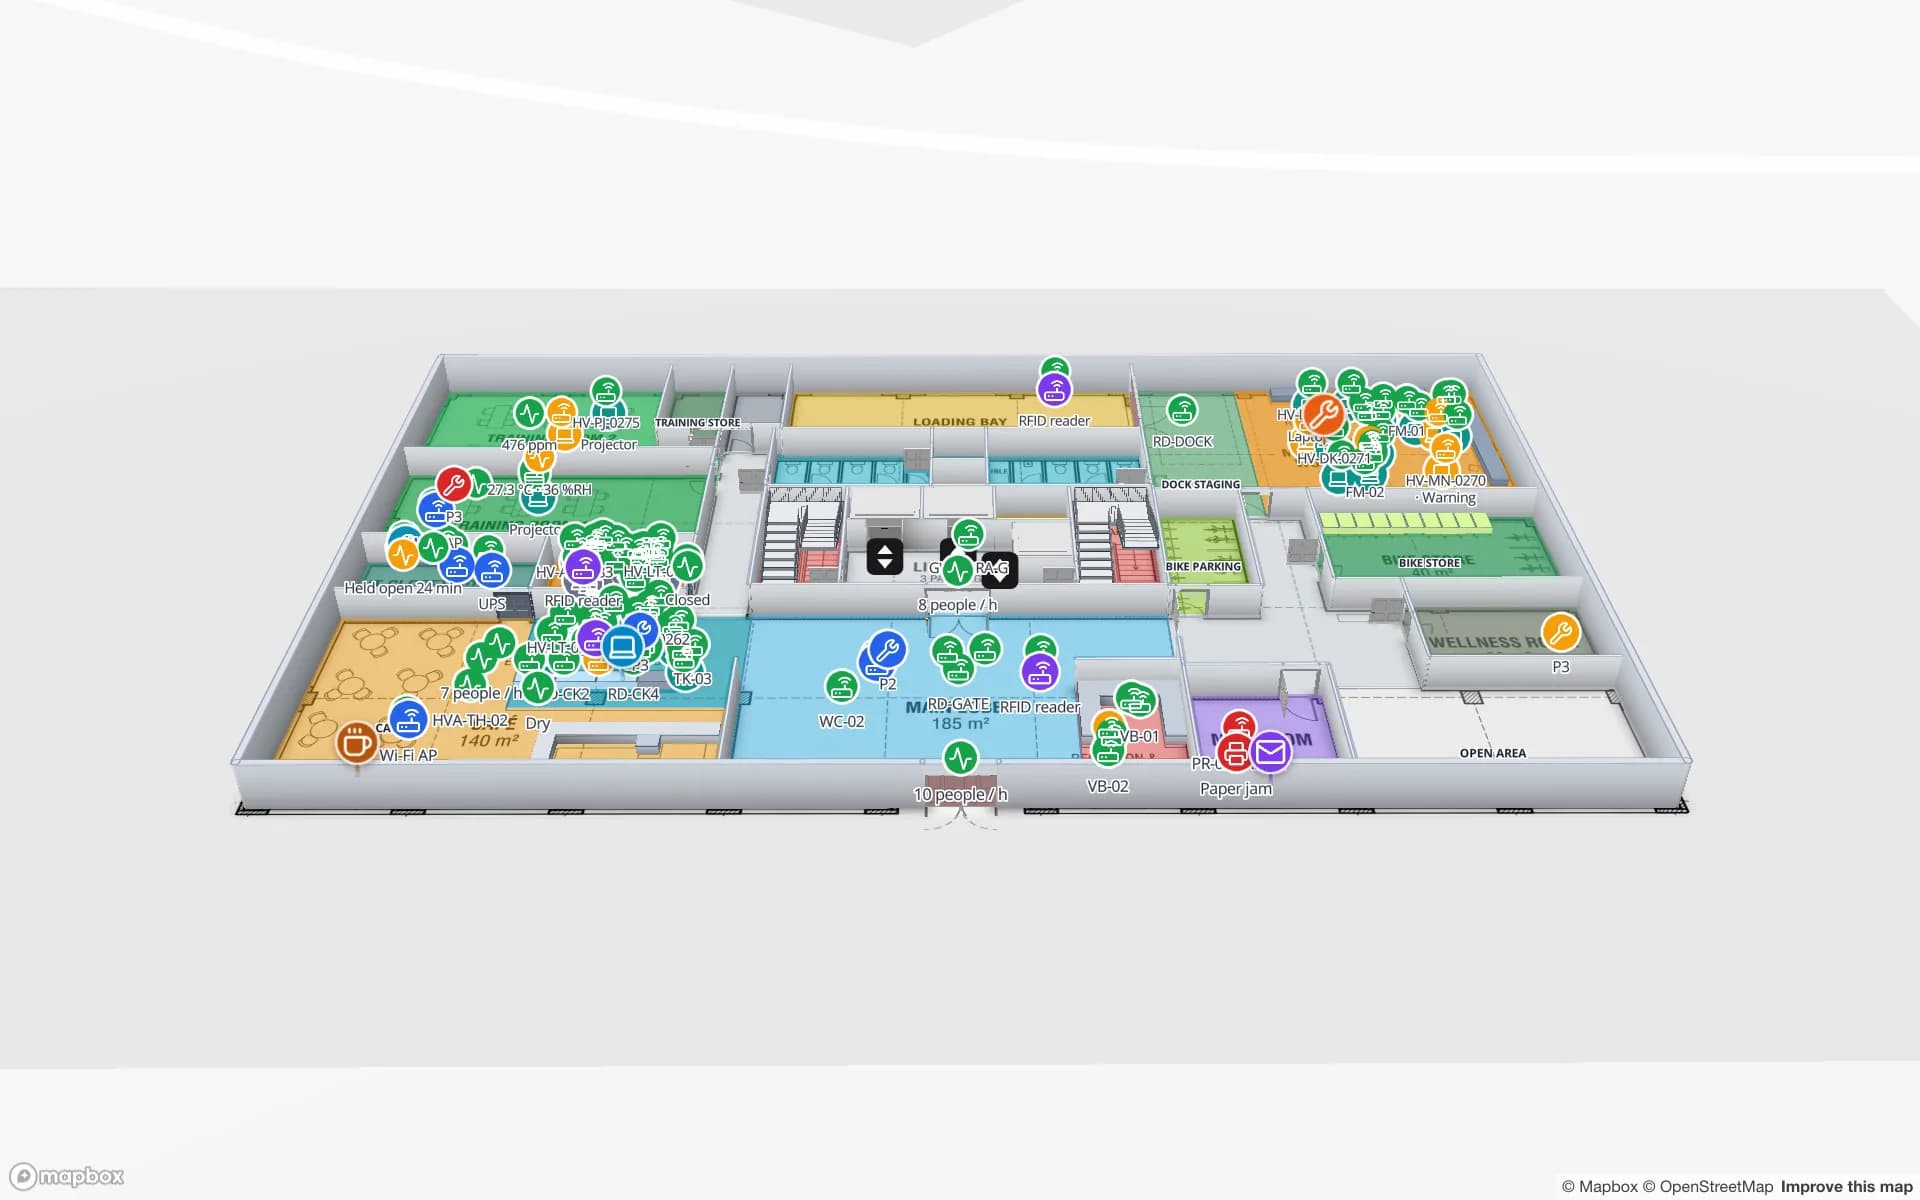
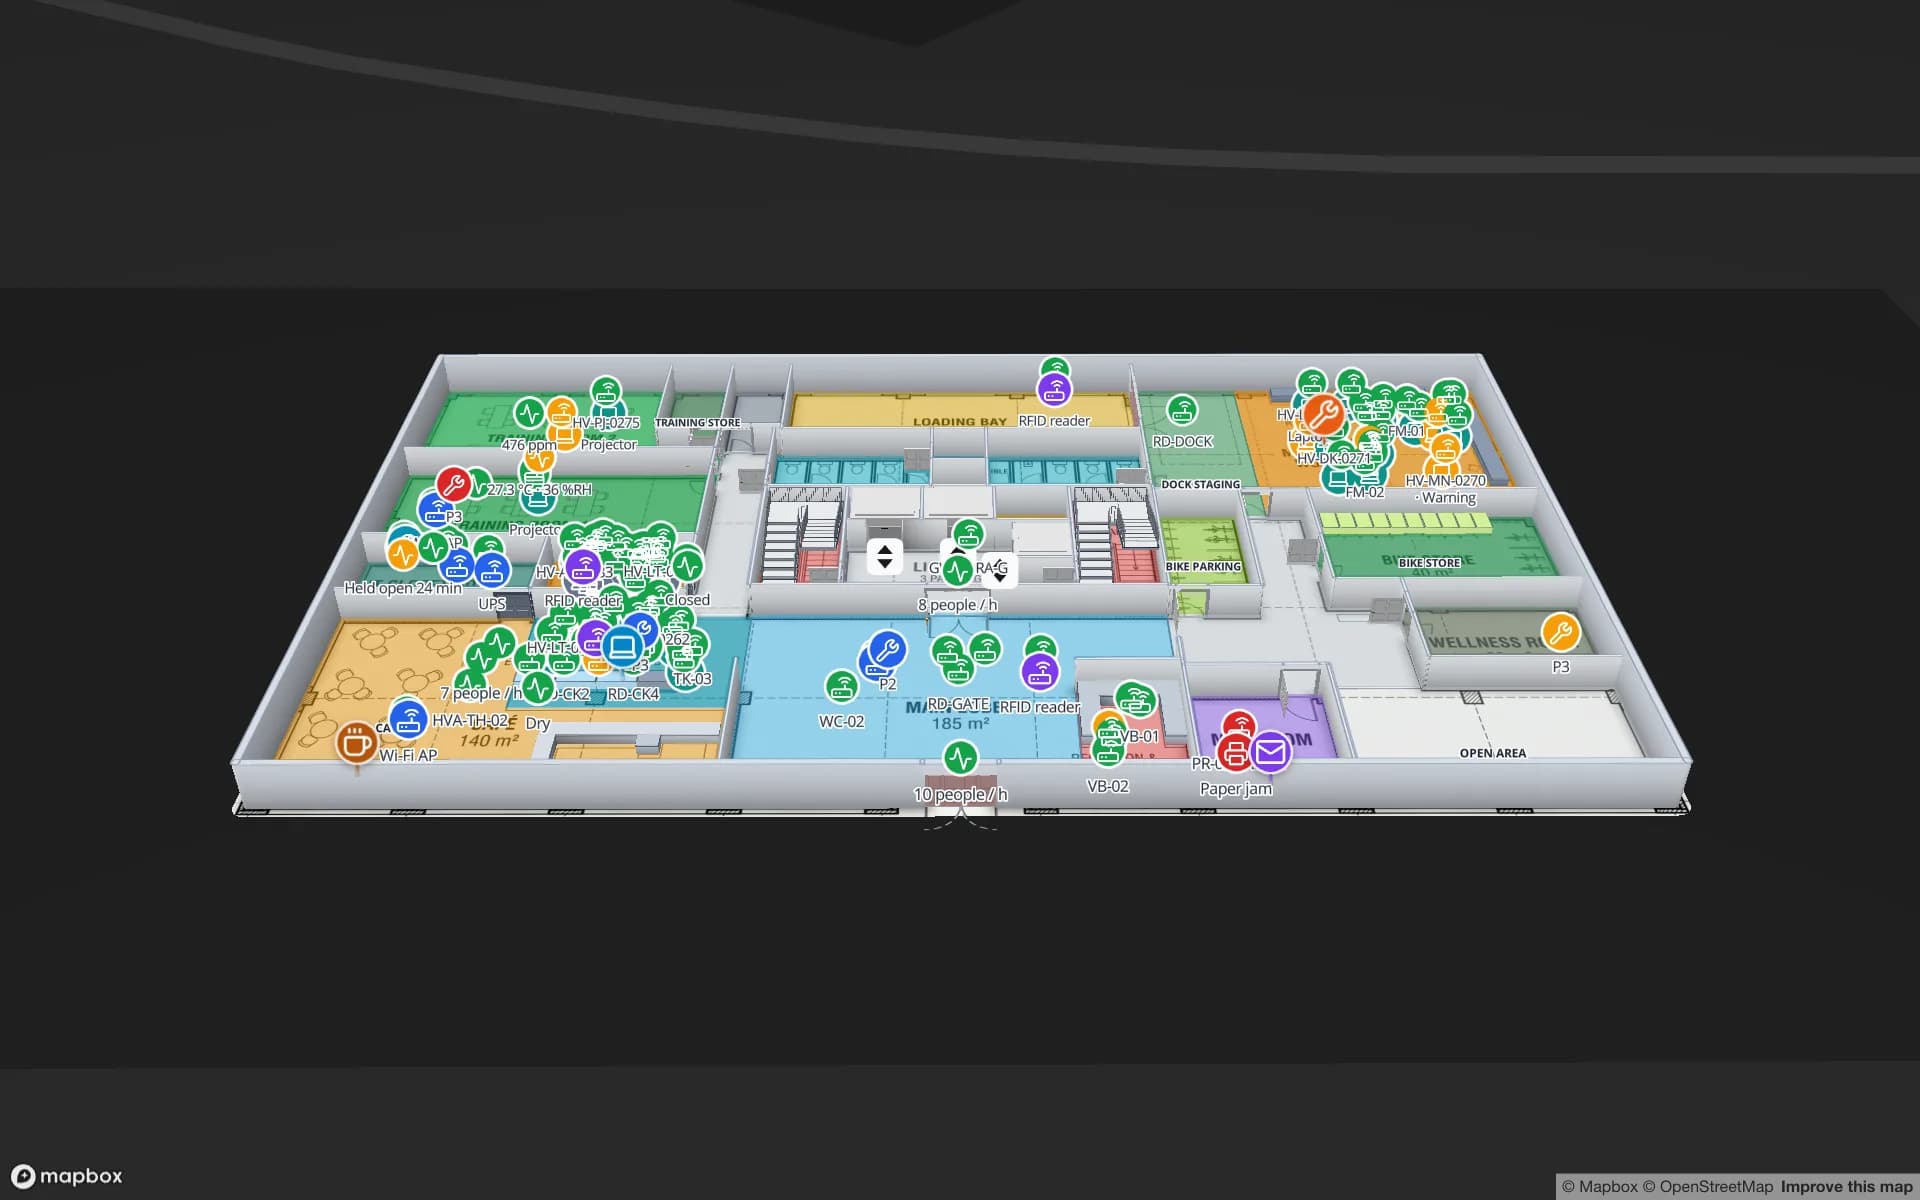
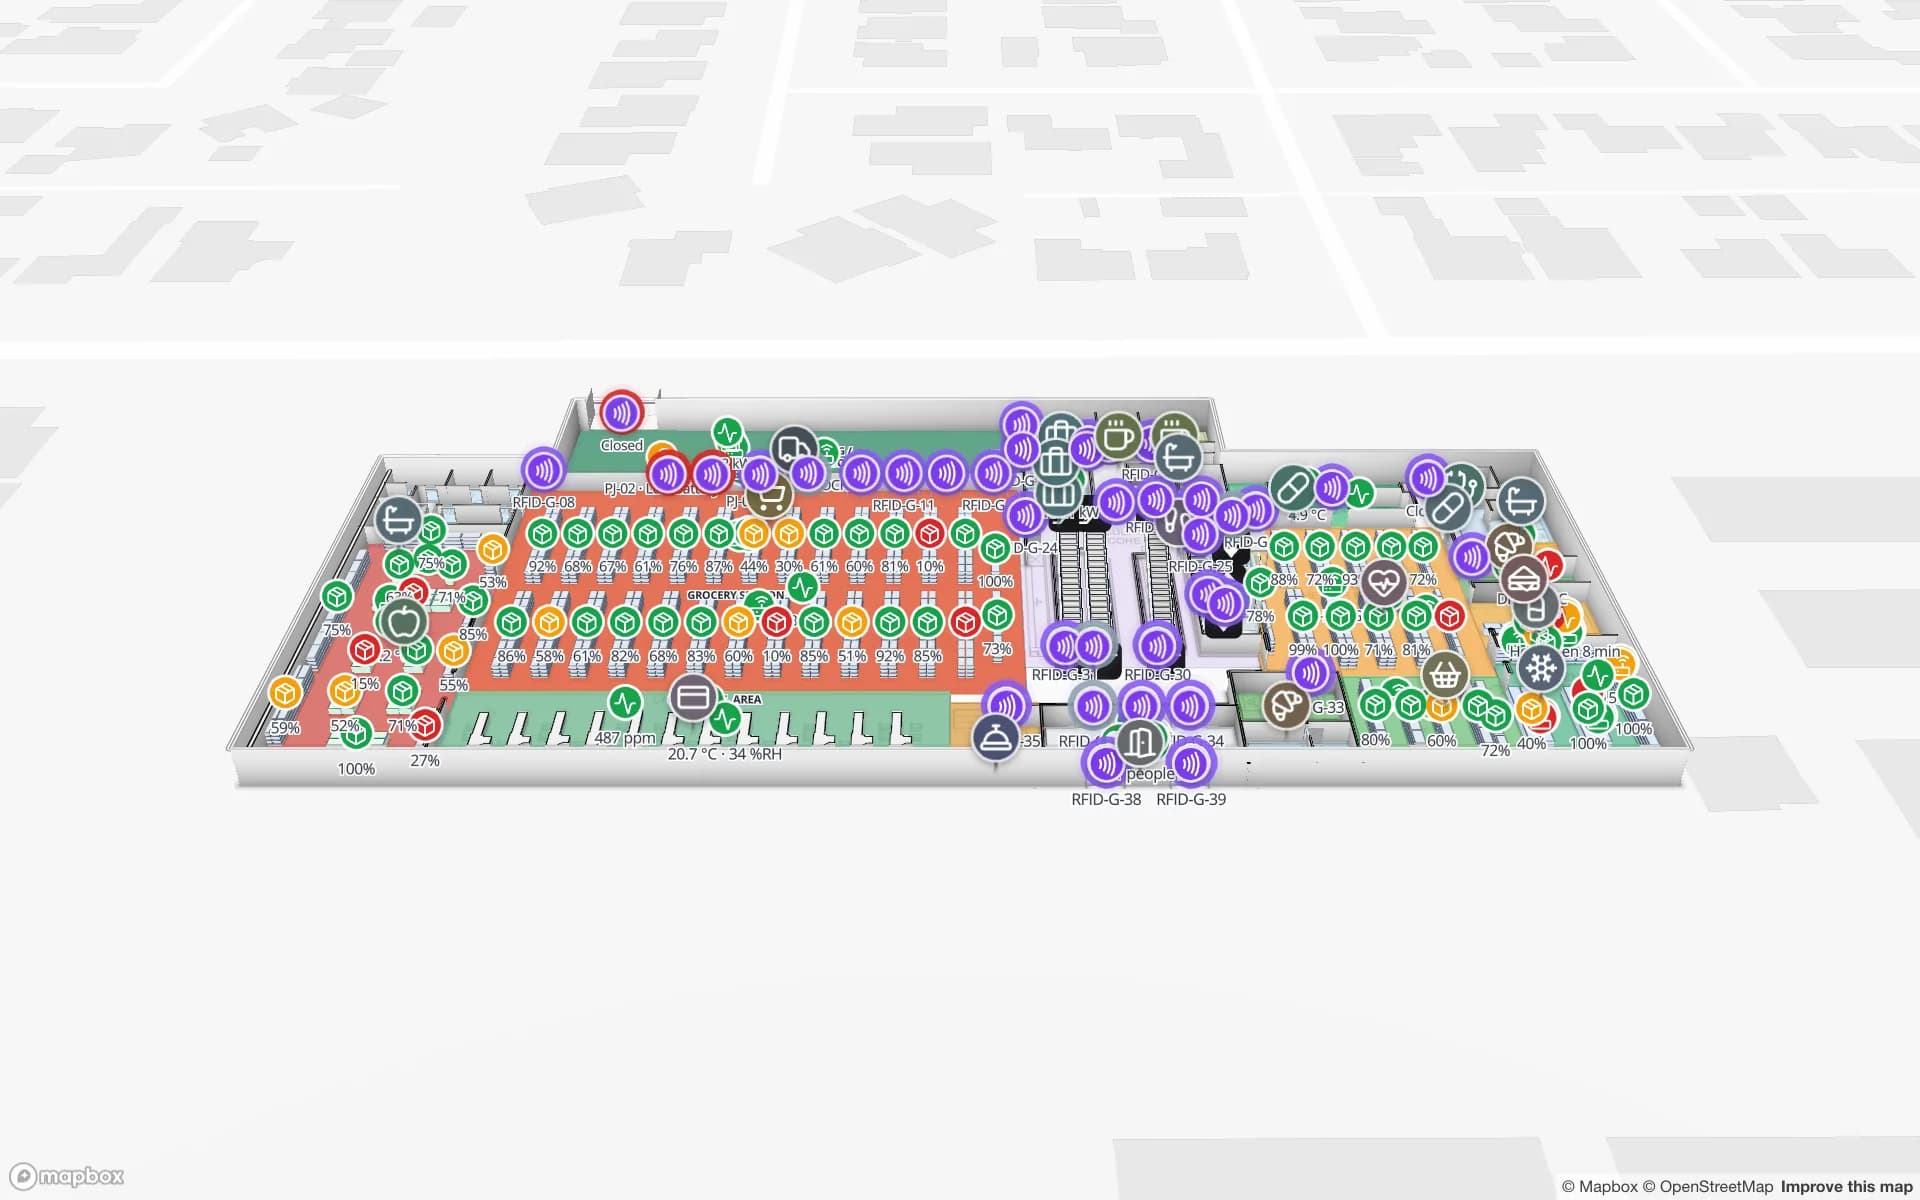
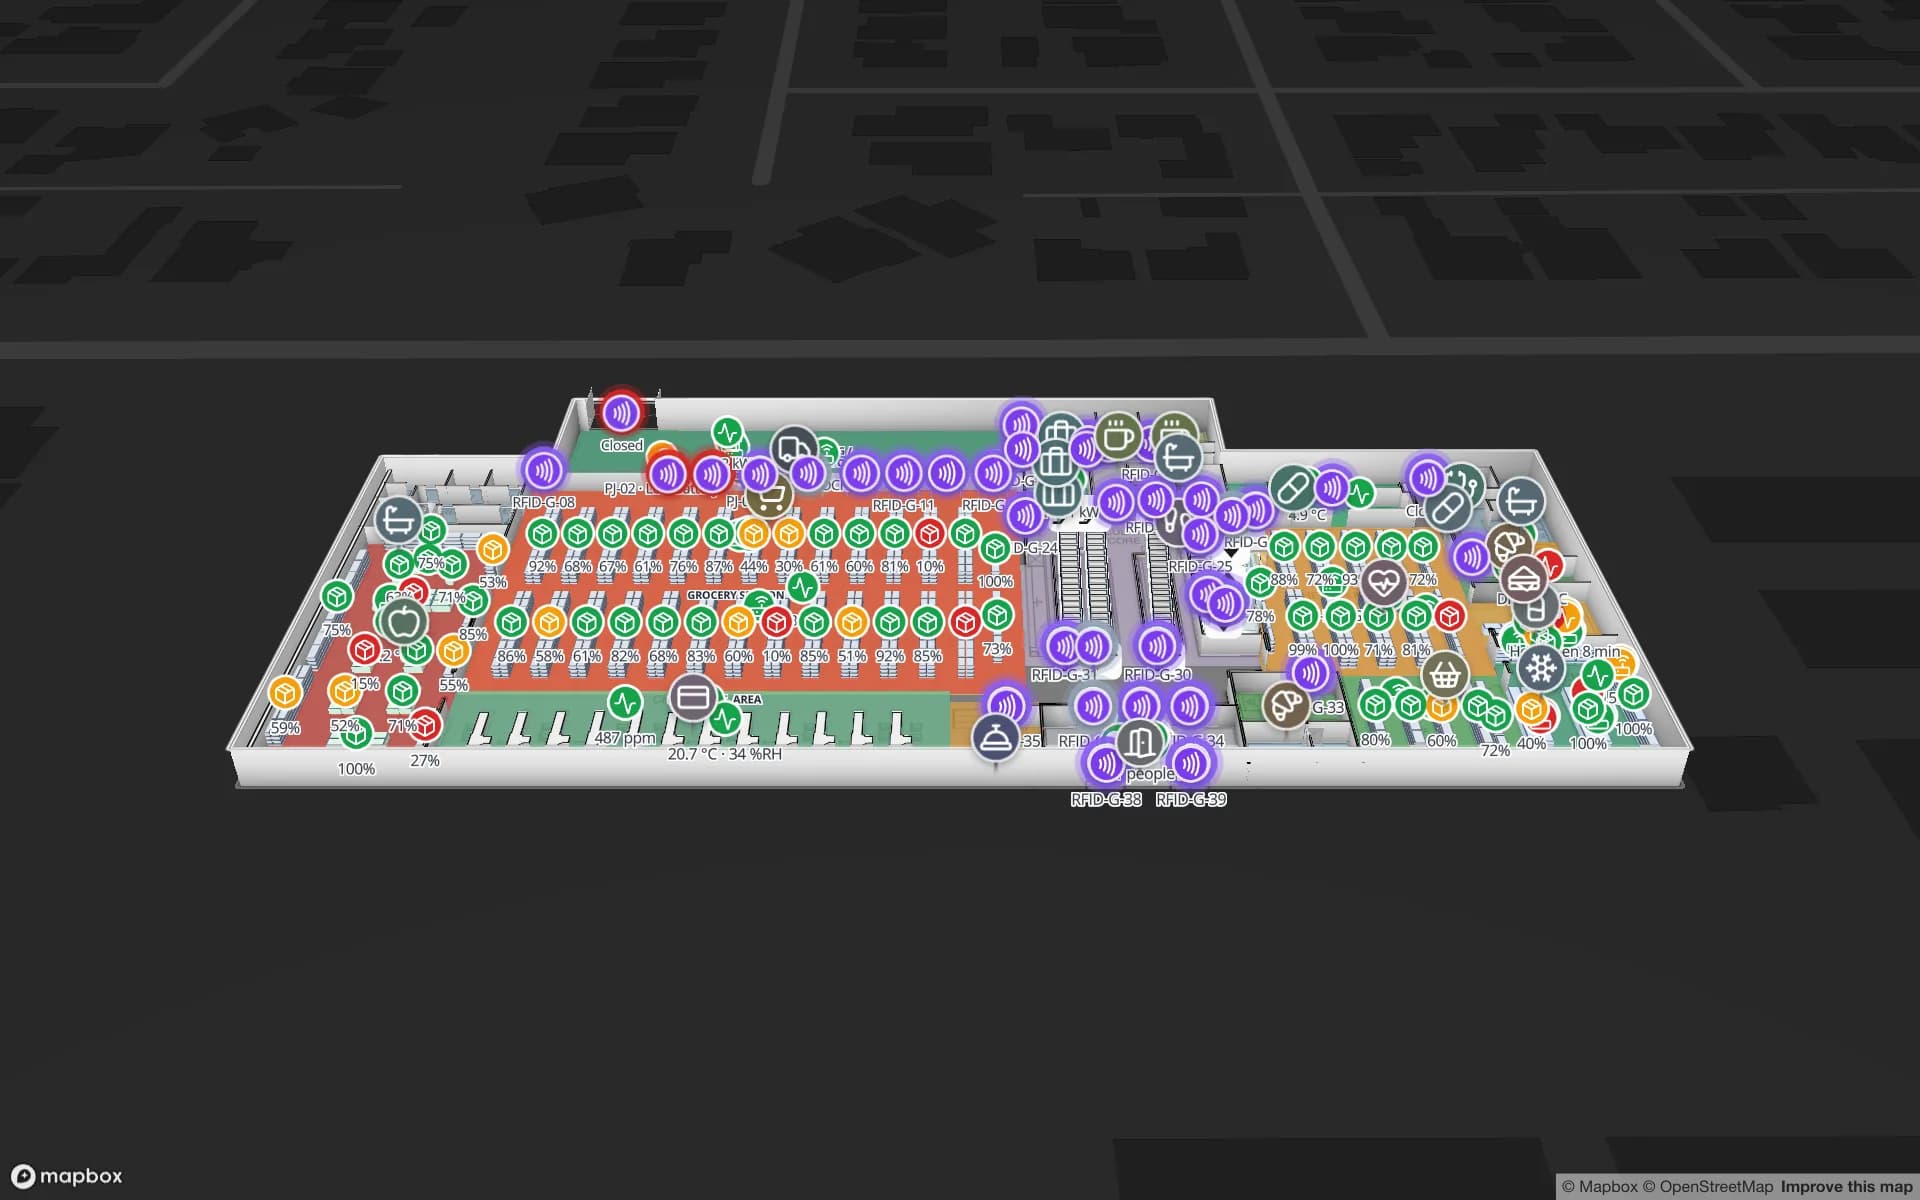
Crestline Fulfillment Center, a fulfillment center demo, in the Spatial Map 3D viewer with live device markers
Crestline Fulfillment Center
Crestline Fulfillment Center, a demo warehouse: 20 racks with 2,204 locations, staging lanes, forklifts and the trailer yard.
Rack locations in the Crestline fulfilment demo
2,204
Dock doors in the Eastport cross-dock demo
50
Write API limit per key for batched stock updates
60 req/min
Free trial, up to 5 facilities, no credit card
7 days

Two container terminals, and everything that happens next

The Kenya Ports Authority describes two container terminals at Mombasa. The Mombasa Container Terminal has berths 16 to 19 with 840 m of quay, and the Kipevu Container Terminal is the second. Boxes leave the quay on trucks or on the Standard Gauge Railway, and a large share lands in container freight stations and warehouses around the island and the mainland.

That is where the cargo stops moving and becomes stock: stripped, sorted by consignee, stored under customs control, re-loaded. Spatial Map draws each shed with its bays, racks, dock doors and lanes and colours them from your yard or WMS data. A pallet or consignment sits in the bay where it was last put; the Crestline demo shows 2,204 rack locations coloured by stock status, with staging lanes in front of the docks. Spatial Map does not connect to KPA, Customs or the terminal operators.


The Northern Corridor means stock for six countries

The Northern Corridor road network covers six countries: Burundi, the Democratic Republic of the Congo, Kenya, Rwanda, South Sudan and Uganda. The Mombasa-Malaba-Kampala road alone is 1,170 km. A shed in Mombasa therefore holds cargo that may be for Nairobi, for Kampala or for Kigali, each with a different route, document set and deadline.

Make the destination a field. The same bay table can carry consignment, consignee, destination country and expected pickup, and a data link colours bays by destination or by days in store. A manager at the head office sees at a glance which Ugandan loads are waiting and which trucks are due, and the History player replays the day when a consignment goes missing.

The SGR, the Nairobi depot and a rulebook that moves

The Standard Gauge Railway runs 472 km from Mombasa to Nairobi, designed to carry 22 million tonnes of cargo a year between the port and the Inland Container Depot at Embakasi. When rail freight began in 2018 the Standard reported that container freight stations, which had been evacuating over 1,200 containers a day, ended up handling mainly Mombasa-bound cargo, under 10 % of port volumes. Later the President returned operations from the Nairobi and Naivasha depots to Mombasa, as The EastAfrican reported in 2022, and in 2025 the CFS Association challenged KPA’s Revised Tariff Book, which the High Court in Mombasa declined to quash.

The practical lesson for a warehouse is that cargo flows can change by directive or by court order, and a system that hard-codes “this shed handles that kind of cargo” goes out of date. Keep the rule outside the map: put origin, destination and clearance route in the table, and the map recolours the day the data changes. For inventory tracking in a bonded or transit shed, this is the difference between a tool that survives the next change and one that does not.

Dongo Kundu and the next generation of sheds

Dongo Kundu, in Likoni in Mombasa County, is a designated Special Economic Zone planned with a free port, a logistics zone and an industrial park, close to the port and the SGR. Planned zones are where new sheds get designed, which means new floor plans, new racking and new dock layouts. Drawing a warehouse before it is built, with racks and doors placed, helps a team agree on flow before steel is ordered. We have not verified the zone’s current build status, so check with the authority before you plan around dates.

If you are moving from an old shed on the island to a new one on the mainland, run both on the map for a month. Upload each plan, tag the pallets that move, and the map shows how many are in which building at any moment, with the History player as the record.

What warehouse tracking in Mombasa is made of

Most Mombasa sheds already have a stock list; what they lack is the where. Start with a CSV: bay, consignment, destination and received date. The CSV bin inventory post shows how to get a rack map up in an afternoon. Then add what is cheap and visible: barcode or RFID scans at the door, BLE tags on forklifts so that the map shows where they are, and a weighbridge or gate table that posts every arrival.

The coast is hot and humid, so test tags and enclosures in your own shed, and treat the map’s “not updated for N minutes” alert as an early warning that a reader or gateway has dropped out. Spatial Map does not read tags itself; your reader, handheld or WMS does, and posts the rows.

Services for teams in Mombasa

Where Mombasa teams usually start:

Also served nearby

The same approach covers Changamwe, Shimanzi and Kipevu, Miritini and Mazeras on the mainland, and Likoni and Voi along the corridor. Nothing is installed at any of them; the map opens in a browser.

How Spatial Map does it

From stock list to shed map

  1. 01

    Start with the stock list

    A CSV with bay, consignment, destination and received date is enough to colour a first rack map.

  2. 02

    Draw one shed

    Upload the plan or a photo, let AI Map draft walls, doors and racks for review, and name bays as your team does.

  3. 03

    Feed it daily

    Your WMS or scanners post rows to a table through the write API, or Spatial Map polls a REST endpoint.

  4. 04

    Add the rules

    In-app alerts for consignments in store too long, a bay overfull, or a reader that went quiet; share a read-only link with clients.

What Mombasa teams track

Container freight stations

Consignments by bay, destination and days in store.

Transit sheds for the corridor

Cargo by destination country with pickup deadlines.

Yards, gates and weighbridges

Trailers waiting, doors in use and every arrival logged.

Forklifts and equipment

Where each machine is and which is idle.

See it on real demo facilities

Fictional names, real floor plans, live sensors, RFID, BLE tags and gateways — open any of them in the browser.

All 13 demo facilities

Warehouse tracking in Mombasa — questions we get

No. It has no link to port, revenue-authority or terminal systems. It shows your own shed from your own stock list, scanners and sensors, so a customs entry stays in the customs system and the location of the cargo stays on the map.

No, if you keep origin, destination and clearance route as fields in the table. The map recolours from the data, so a rule change is an edit to a rule, not a new floor plan.

Yes. A read-only share link can be limited to chosen floors and layers, with an expiry date and a view cap. It opens in any phone or desktop browser with no app to install, and there is no released Spatial Map mobile app.

Yes. Draw the plan from the architect’s PDF or DWG (AutoCAD R2004 to R2018, placed as a picture), place racks and doors, and share it so operations can agree on flow. Dates for the zone itself are for the authority to confirm.

No. Spatial Map is sold online and our team works with Kenyan customers remotely, by video call and through the contact form. There are no local resellers or partners.

In US dollars, the same worldwide: a 7-day free trial for up to 5 facilities with no credit card, then Pro at $60 a month or $600 a year for up to 4 facilities. Scanners and tags, if you ask us to source them, are quoted per project and are not part of the subscription.

Put one Mombasa shed on the map this week.

Start the free trial and open the Crestline demo, or send us a shed plan and a sample stock list through the contact form.