Lyon · Vallée de la Chimie, Édouard-Herriot port, Saint-Exupéry

Asset tracking in Lyon, from the chemical valley to the freight terminals

Spatial Map shows where tagged equipment, tooling and returnable assets are on a live 3D map of each building, using the reads and positions your RFID and BLE systems already produce. Asset tracking in Lyon covers three very different settings: process plants south of the city in the Vallée de la Chimie, freight terminals where road, rail, river and air meet, and the factories and warehouses that feed them. Each is its own facility, all of them can sit in one workspace, and the app speaks French for the people on the floor.

No credit card. Runs in the browser. Pro is $60/month for up to 4 facilities. Book a demo

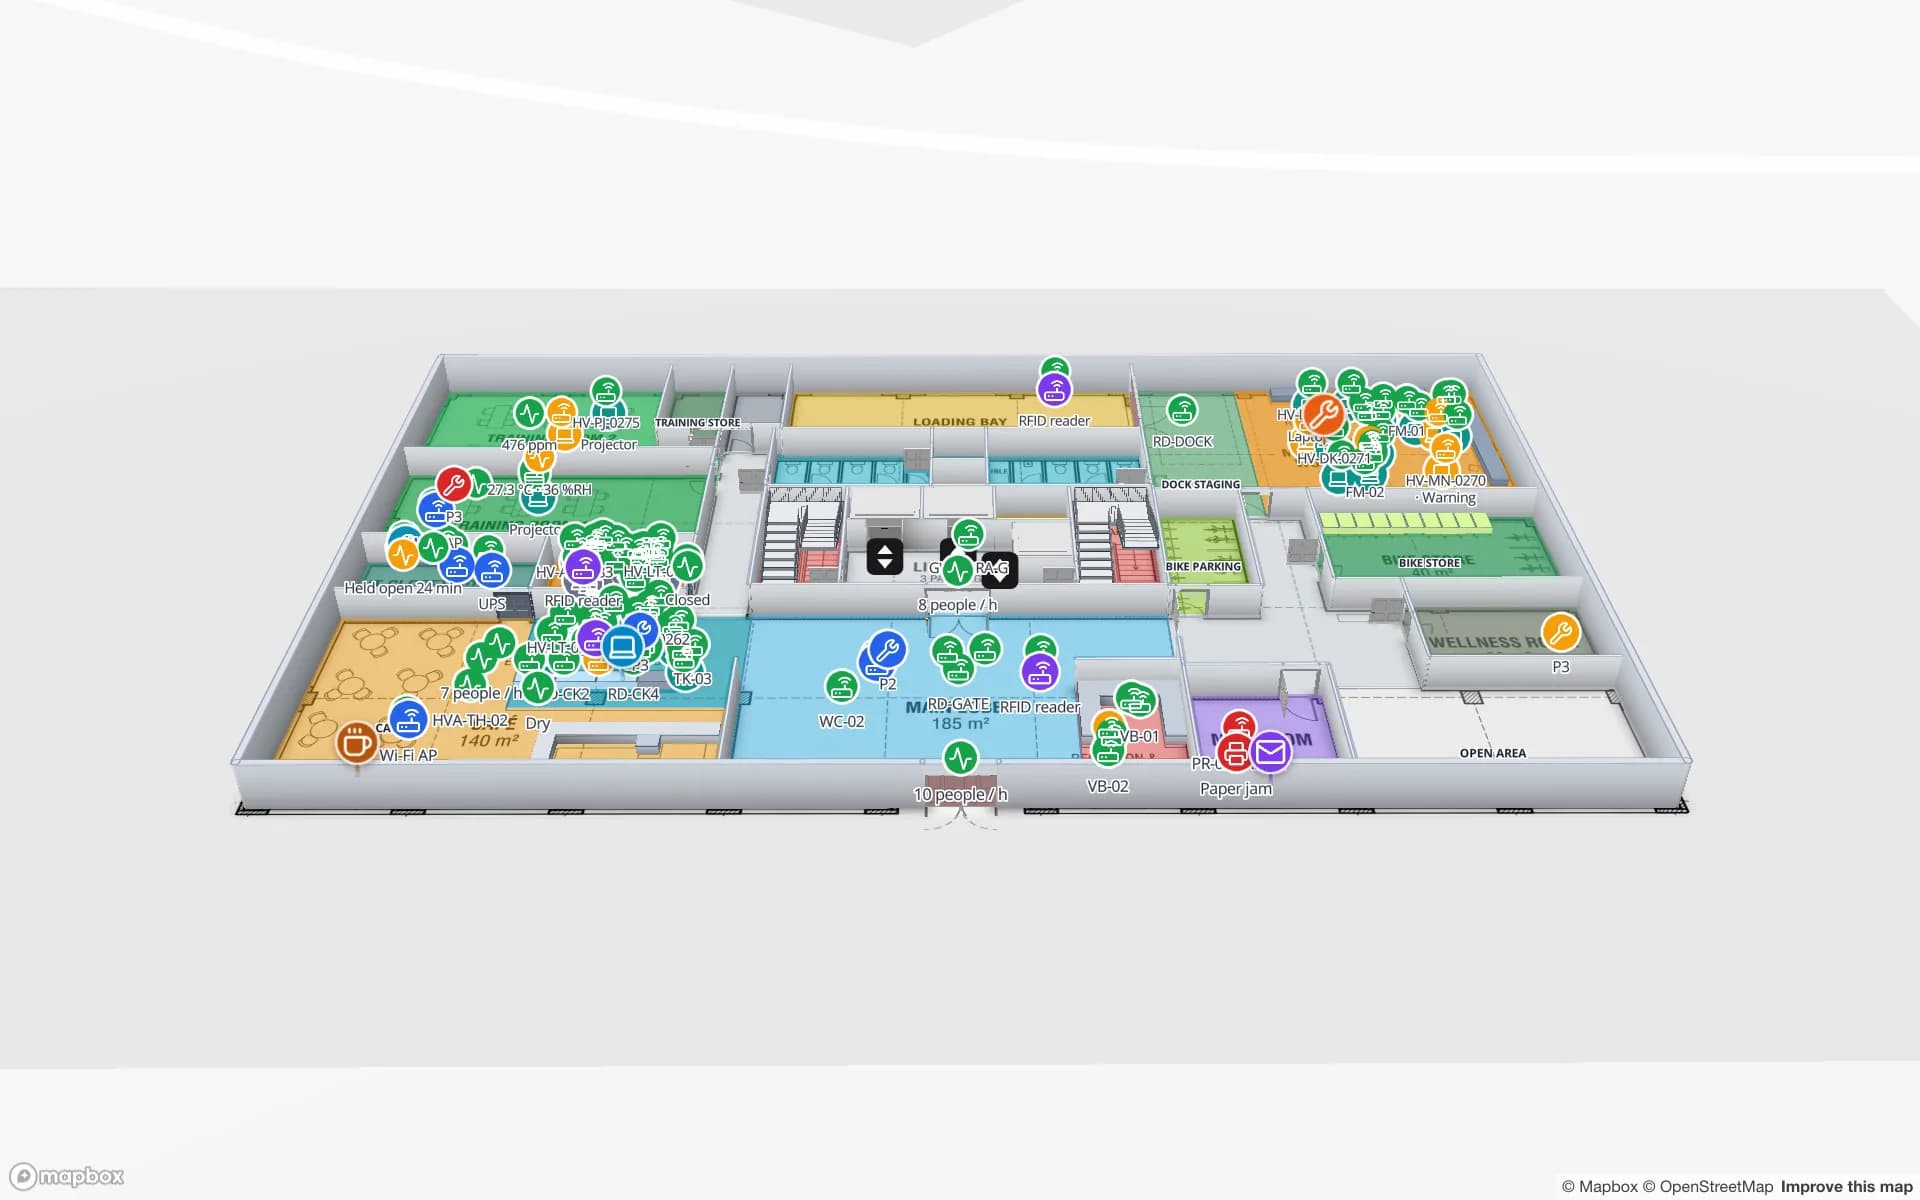
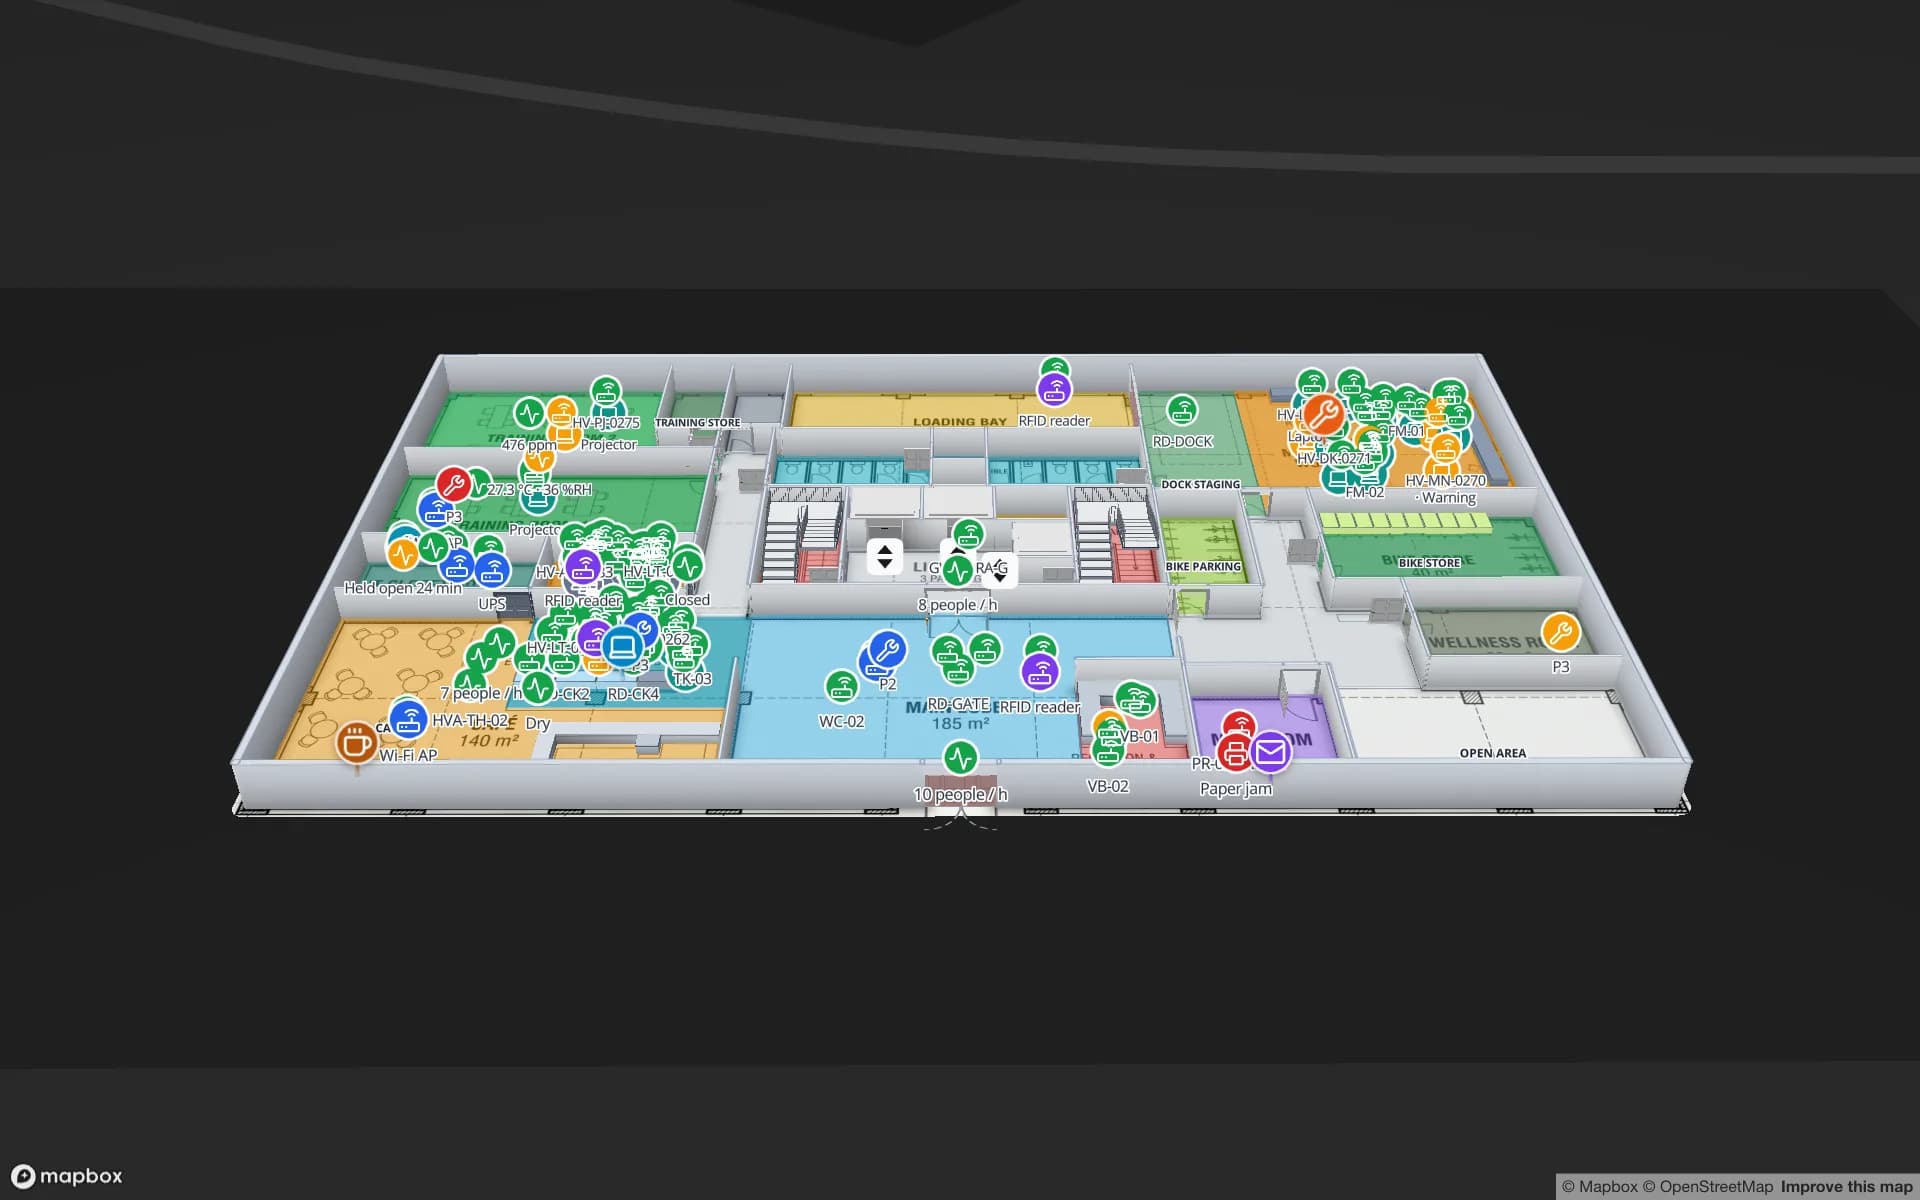
Summit Assembly Plant, a assembly plant demo, in the Spatial Map 3D viewer with live device markers
Summit Assembly Plant
Summit Assembly Plant, a demo factory: lines and workstations, WIP carriers read between stations, tools and crews located on the shop floor and 867 rack locations.
Rack locations in the Summit assembly-plant demo
867
Floors in the Harborview office demo, with an asset register
3
How often alert rules are checked, with alerts shown in the app
15 s
Free trial, up to 5 facilities, no card
7 days

The Vallée de la Chimie: shared equipment and the maintenance stop

South of Lyon, along the Rhône, the Vallée de la Chimie is described by the metropolitan investment agency as one of France’s largest industrial hubs, with nearly 430 companies; its Circulyz eco-park sits in Feyzin, at its heart. Axelera, the competitiveness cluster for chemistry and process industries, runs a decarbonisation project there with thirteen industrial partners aiming at an 80 % cut in CO₂ emissions. Whatever the sites produce, their asset problems look alike: portable instruments, gas detectors, lifting gear, pumps and spares that several teams share, and that move between stores, units and contractors’ vans.

Spatial Map keeps the register as a table — tag ID, owner, home store, status, next inspection date — and draws each store and unit as an area. Tags read at the store door, or BLE tags with gateways named after the units, tell your system where each item is; the map shows the last-seen area, a style rule colours items overdue for return or inspection, and the History player replays where an item has been. A turnaround makes the case: hundreds of contractors’ tools enter a unit and must all leave it. RFID tool tracking covers the crib pattern. Equipment for explosive atmospheres is a choice for your safety team and hardware vendor; Spatial Map only shows what your tags report.


CargoPort, the river port and a hub on four modes

Lyon-Saint-Exupéry’s freight area, CargoPort, describes itself as at the crossroads of air, road and rail networks, with two runways, one of them 4,000 m long, and less than a kilometre from the apron to the motorway entrance. On the river side, a group led by a shipping line won a 30-year sub-concession for the container terminal of the Édouard-Herriot port, with stated plans to grow river and rail traffic on the Mediterranean–Rhône–Saône axis. Trade reporting puts Lyon roughly 320 km upriver from Fos.

A freight terminal’s assets are the things that circulate between operators: pallets and cages, containers, swap bodies, trailers, handling equipment. Tag the returnables, read them at the dock door and at the gate, and the map shows which are on site, which are overdue back to a depot and which are sitting in the wrong lane. The Eastport demo, a cross-dock with a trailer yard, gates and weighbridges, shows the layout, and the post on yard visibility explains how dock doors and yard slots become a live picture. Spatial Map does not connect to terminal, rail or river-port systems; it shows what your own reads and tables say.

Plants, tooling and work in progress

Around the city, the typical factory loses time to a short list of movable things: a die or mould in the wrong press, a gauge off for calibration, a carrier of work in progress that nobody can place. The Summit demo shows the pattern on one plant map: lines and workstations, WIP carriers read between stations, tools and crews located by zone, and 867 raw-material and finished-goods rack locations.

Start narrow. Pick the one pool of assets that causes most searching, put them in a table with a home location, and add reads only where an item changes hands. Many Lyon sites already run a CMMS or ERP; its asset list can seed the table by CSV or Excel upload, and the write API keeps it current afterwards. The post on RFID or BLE for asset tracking helps pick the tag for each class of item.

A cold store and a lab in the same workspace

Not every Lyon asset is a tool. Cold rooms, freezers and the probes inside them are assets too, and so are laboratory instruments and their calibration dates. A cold store drawn in the same workspace shows each room tinted by its live temperature, doors open or closed and pallets on hold, with the history of each reading. The Polar Pharma demo shows 1,140 rack locations over temperature zones and reefer docks; see temperature monitoring for how readings arrive. Spatial Map makes no compliance claim: your quality system stays the record, and the map shows the shift what the building is doing now.

Services for teams in Lyon

Where Lyon teams start depends on the building:

  • Process plants and maintenance teams begin with asset tracking for shared instruments, tools and spares, with an inspection-due colour on the map.
  • Freight terminals and logistics sites begin with inventory tracking and returnable pallets and cages at the dock doors.
  • Large sites where vehicles and people must be found continuously look at RTLS and UWB; a BlueIOT server connects directly and other engines through the write API.
  • If you have no tags, gateways or readers yet, our team can source them on request, quoted per project, with warranty and device support from the manufacturer: see hardware and demo kits on request.
  • Asset back offices, handheld apps and ERP or CMMS integrations are built as client projects, for example an asset management system. The product runs as cloud or on-premises.

Also served nearby

The same page covers Feyzin, Saint-Fons, Pierre-Bénite and Solaize in the chemical valley, Vénissieux and Saint-Priest on the east side, and Villefranche-sur-Saône and Vienne along the rivers. The map opens in a browser at any of them.

How Spatial Map does it

Building a Lyon asset map

  1. 01

    Load the register

    Upload the asset list from your CMMS or ERP as a table: tag ID, owner, home store, next inspection date.

  2. 02

    Map the stores and units

    Import the plan, align it, and draw stores, workshops and units as areas named like your readers and gateways.

  3. 03

    Connect reads and positions

    RFID middleware and BLE gateways post rows through the write API or a polled REST endpoint.

  4. 04

    Add overdue and silence rules

    In-app alerts for items overdue for return or inspection and for readers that stopped reporting.

Where Lyon teams track assets

Shared instruments and tools in process plants

Check-out, last-seen store and inspection-due colours across units and stores.

Returnable pallets and cages at freight terminals

Dock-door reads, yard slots and items overdue back to the depot.

Tooling and WIP carriers in factories

Which die is in which press, which carrier is at which station.

Cold rooms and probes

Rooms tinted by live temperature, door states and held pallets in one workspace.

See it on real demo facilities

Fictional names, real floor plans, live sensors, RFID, BLE tags and gateways — open any of them in the browser.

All 13 demo facilities

Asset tracking in Lyon — questions we get

That depends on the hardware and the zone classification, which are decisions for your safety team, your integrator and the vendor’s datasheet. Spatial Map does not make hardware and cannot verify suitability for explosive atmospheres. It shows what your tags and readers report, and an in-app alert when a reader stops reporting.

Tag the tools, read them at the unit entrance and exit, and keep the register as a table with the contractor as owner. A count rule raises an in-app alert when more tools are inside a unit than were checked out, and the History player replays who took what.

Yes. The app is available in French alongside English, German, Spanish, Arabic and Chinese, and each user picks their own language. Asset names, store names and report titles stay as you write them, accents included.

Yes. Upload a CSV or Excel export to seed the table, then your developers can push changes through the write API (HTTPS, bearer API key, bulk upsert, 60 requests per minute per key), or expose a REST endpoint that Spatial Map polls. It does not write back to your CMMS.

No. Spatial Map is sold online and our team works with customers in France remotely, by video call and through the contact form, in French or English. There are no local resellers or partners.

In US dollars, the same worldwide: a 7-day free trial for up to 5 facilities with no card, then Pro at $60 a month or $600 a year for up to 4 facilities. Tags and readers, if you ask us to source them, are quoted per project and are not part of the subscription.

Track one shared-equipment pool first.

Start the free trial and open the Summit demo, or send us your asset list and the plan of a plant, store or terminal through the contact form.